Bruce Wang
Amazon’s Elastic Load Balancing (ELB), offered as part of the Amazon Web Services (AWS) platform, allows for the distribution of incoming traffic requests across EC2 instances. Load balancers reduce the maximum load placed on individual hosts, increase the fault tolerance of applications, and provide a single client-side connection point to simplify client access. Amazon offers three types of ELBs: Classic ELBs, Application Load Balancers (ALBs), and Network Load Balancers (NLBs). AWS NLBs differ from the other ELBs in that they route incoming client requests at the TCP connection level, using connection header details to determine which target to connect the client to.
Any issues in your NLBs may result in loss of application functionality, so it is crucial to ensure they are working properly. Monitoring your NLBs gives you insight into key network traffic metrics to help troubleshoot possible issues in your application more efficiently.
Datadog’s AWS integration now allows you to collect and analyze NLB metrics alongside more than 1,000 other integrations, including Classic ELBs, ALBs, and the rest of the AWS platform.

Key AWS NLB metrics and tags
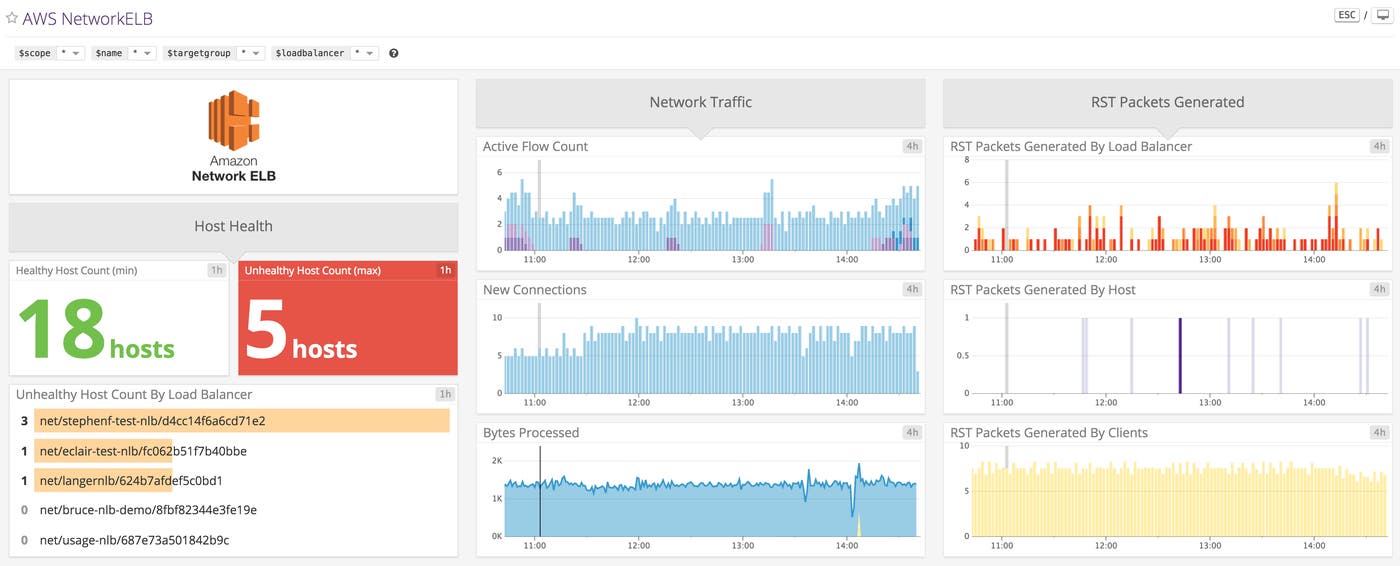
Datadog’s NLB integration comes with a customizable, out-of-the-box dashboard, pictured above, that enables you to start monitoring your NLB metrics right away. Along with relevant tags provided by Amazon CloudWatch, such as load balancer name, target group name, and availability zone, Datadog’s NLB integration automatically ingests any custom tags that you add and applies them to your metrics. Here are some ways that you can use key NLB metrics to help you monitor your infrastructure.
Monitor network traffic
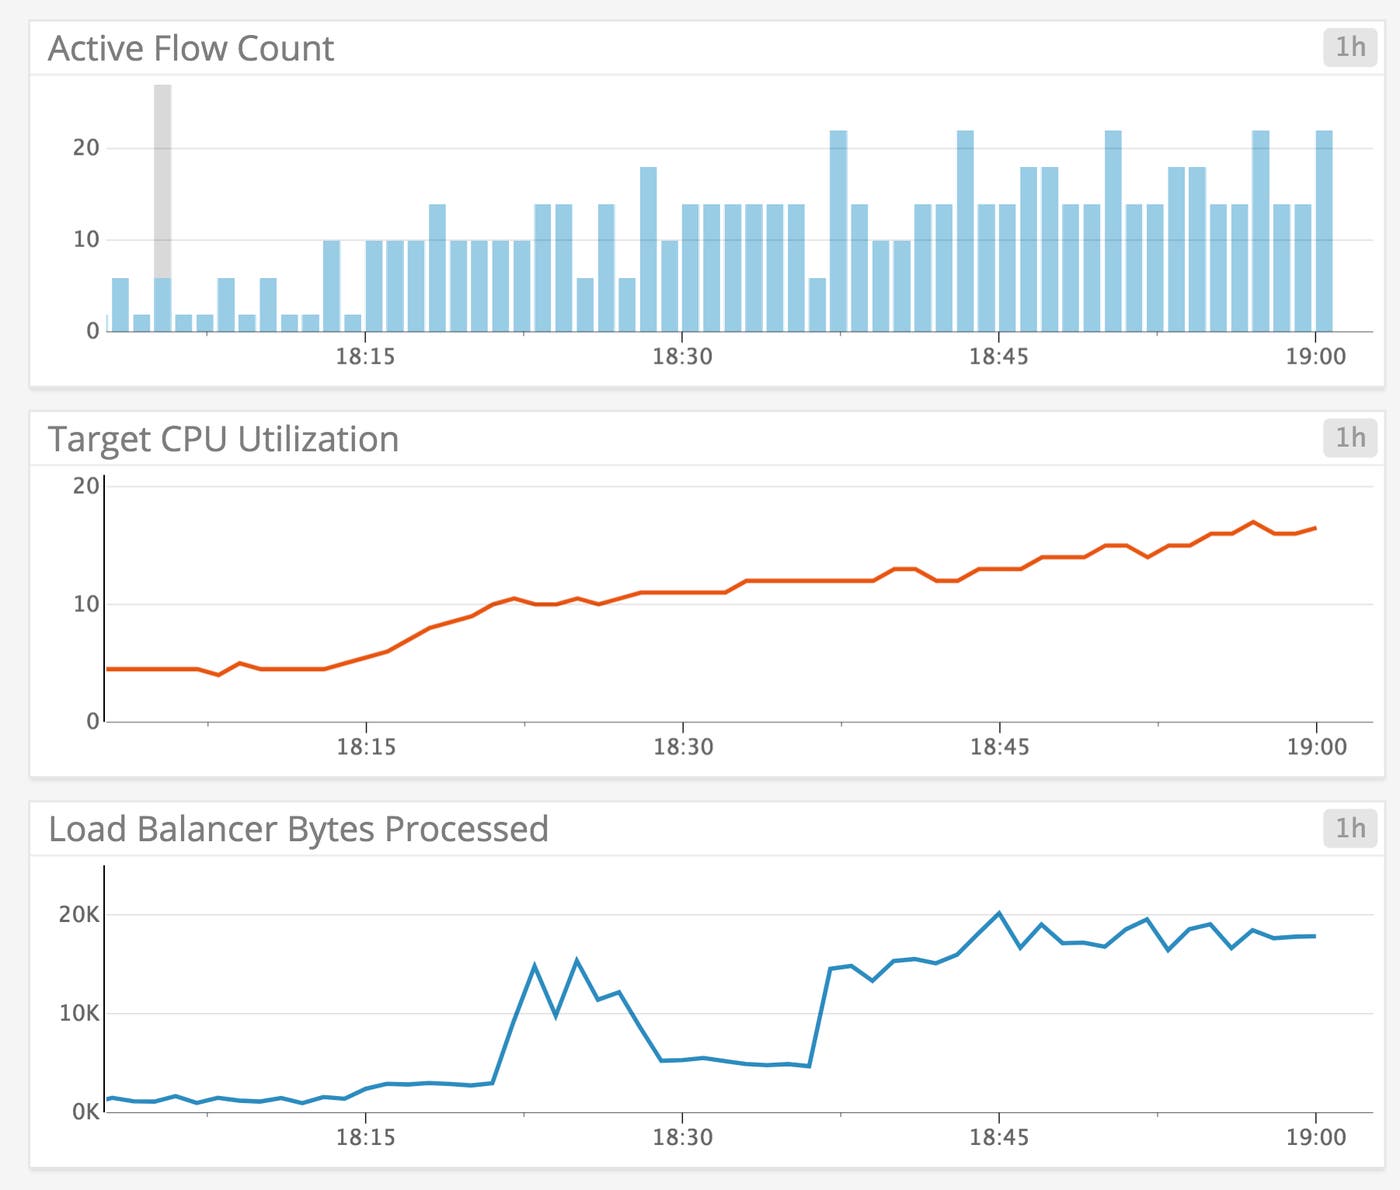
You can monitor the number of bytes processed and requests handled by your NLBs to effectively gauge the level of network traffic in your application. Comparing these metrics with application-level metrics—such as latency and errors—can help you determine whether decreases in performance are simply caused by hosts becoming overwhelmed with requests, or whether other factors are at play.
NLBs will automatically scale along with your EC2 fleet if you use your load balancer in conjunction with AWS Auto Scaling, but other parts of your infrastructure may also need to be scaled accordingly. Since Datadog also integrates with the rest of the AWS platform, you can compare and correlate network traffic with metrics across other components of your infrastructure to determine which resources need to be scaled accordingly.

Keep track of reset packets
Reset (RST) packets are responsible for the immediate termination of a TCP connection. They can be generated by target hosts, clients, or the load balancer itself. An abnormal rise in the number of reset packets generated by the load balancer likely requires an immediate response, as this means that the load balancer is dropping a significant amount of connections.
On customizable Datadog dashboards you can correlate data between NLBs and your other systems. For instance, you can compare the number of reset packets sent by hosts against key application metrics, such as latency or resource utilization, to determine if infrastructure issues are affecting your users.
Visualize host health
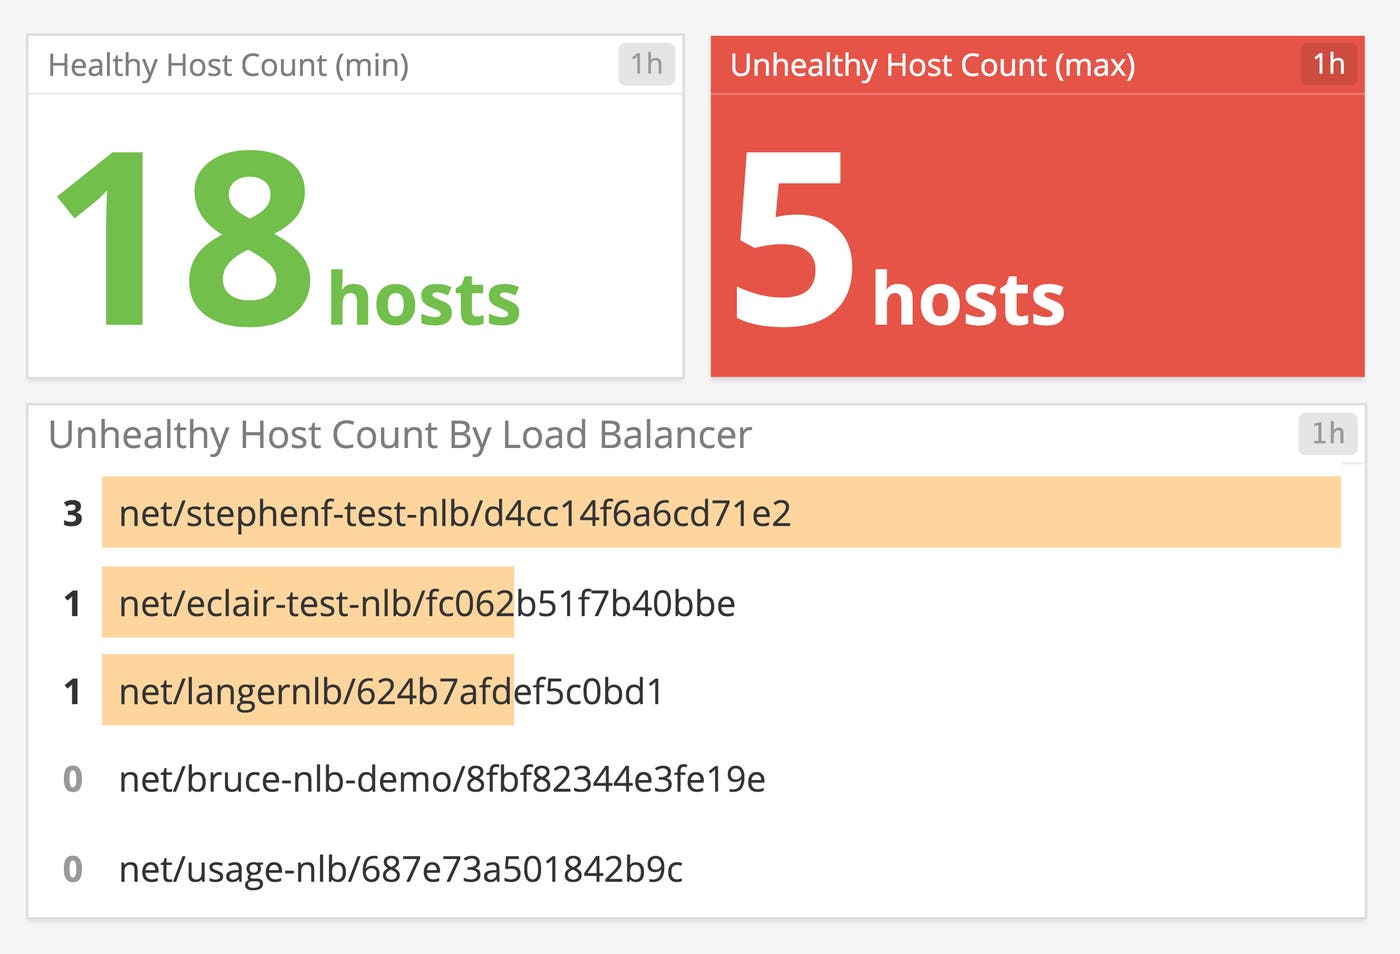
Observing the aggregate health of hosts is a great way to monitor the overall health of your backend. NLBs will—in accordance with provided settings—periodically send requests to check the status of target hosts. Setting up automated alerts on the number of healthy or unhealthy hosts enables you to quickly get notified about any issues.
Using Datadog’s selection of visualizations allows you to quickly gain insight into the health of your infrastructure. For instance, you can use a toplist to identify particular areas of concern at a glance.

Start monitoring your NLBs today
If you’re already using Datadog, check out our documentation for instructions on how to begin monitoring your NLBs and the rest of your AWS environment. And if you don’t yet have a Datadog account, here’s a free trial to get you started.


