
Pratik Parekh
When handling telemetry data, many organizations face a familiar set of challenges: separate tools for logs and metrics, inconsistent or missing tags that weaken visibility and cost attribution, and high costs from low-value logs and high-cardinality metrics. Without a unified way to manage the telemetry, central teams can’t easily enforce data standards or stop low-value, malformed, or high-cardinality metrics from being ingested. This leads to visibility gaps and unnecessary spend.
Datadog Observability Pipelines now supports metric data in addition to logs, giving organizations a single place to manage governance for both telemetry types. With this update, teams can control ingestion costs by applying consistent tag policies, removing unnecessary or malformed metrics, and limiting tag cardinality directly in the pipeline. This unified approach improves data quality, reduces tool sprawl, and simplifies the operational work required to maintain reliable, cost-efficient observability data.
In this post, you’ll learn how to:
Unify governance for logs and metrics in one place
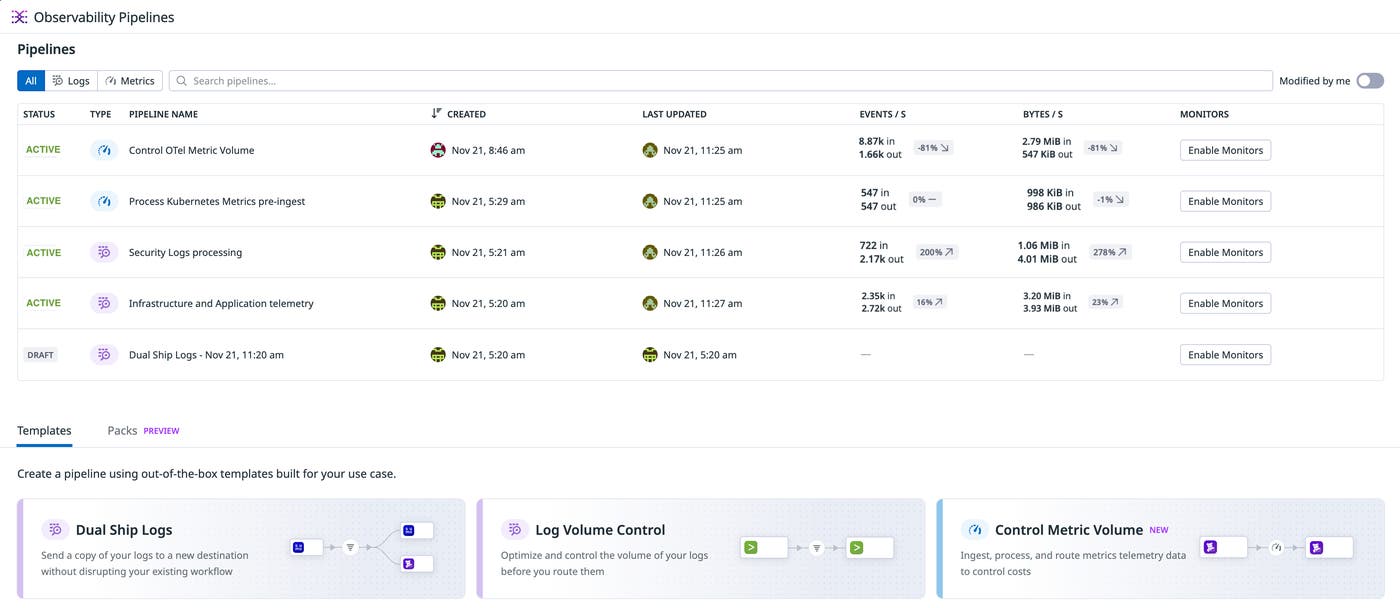
Many organizations maintain separate tooling to process logs and metrics, which creates uneven governance and increases the operational burden on central teams. By adding support for metrics, Observability Pipelines allows teams to manage both telemetry types through a single control plane. This helps eliminate the need to run parallel pipelines or maintain separate policy engines, and gives platform teams a consistent way to apply routing, filtering, and tagging standards across all their data.
With a unified pipeline, teams no longer need different systems to enforce tag requirements, control cardinality, or remove low-value signals. Observability Pipelines can now ingest and process metrics from the Datadog Agent or the OpenTelemetry Collector by using the same processors that are already used for logs. This enables organizations to apply the same governance model across their telemetry data without introducing new tools or workflows.
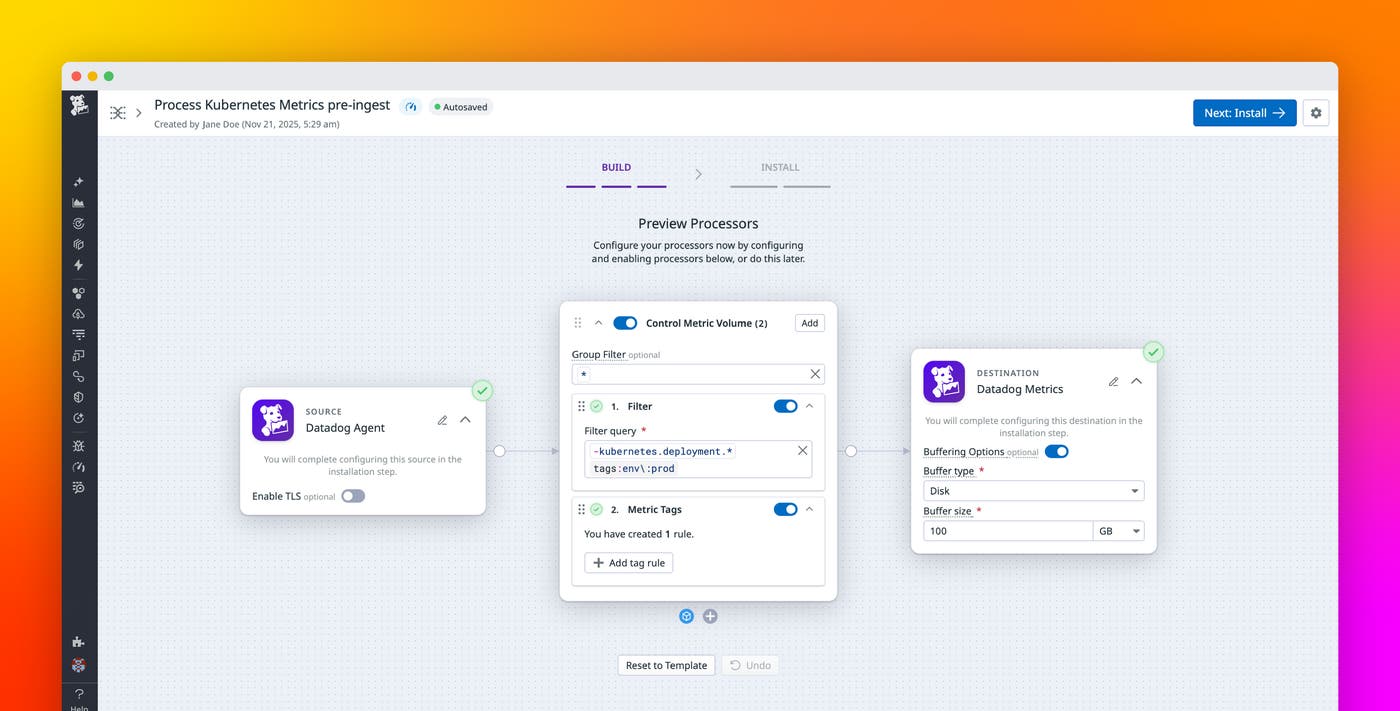
A dedicated metrics template in the interface makes it easy to set up these pipelines, while API and Terraform support enables teams to manage them as code. This consolidated approach helps reduce tool sprawl, improves data consistency, and gives teams a clearer, more reliable foundation for observability across their environment.
Filter and transform metric data
Observability Pipelines adds granular control over the quality and volume of metric data. You can define rules to include or exclude metrics based on names or tag patterns. Filters can match expressions, such as name:container.net.*, or exclude data containing specific tag values. This gives teams the flexibility to remove metrics that are low value or tagged incorrectly before they reach their destination.
You can also govern tag hygiene directly in the pipeline. Inclusion and exclusion lists let you specify which tags must appear on a metric and which tags should be removed. For example, you can ensure that every metric includes tags such as env, host, and service. Metrics missing these tags are dropped automatically, preventing incomplete data from being ingested or indexed. The same mechanism allows you to remove unwanted tags that contribute to high cardinality, improving cost control and simplifying analysis.
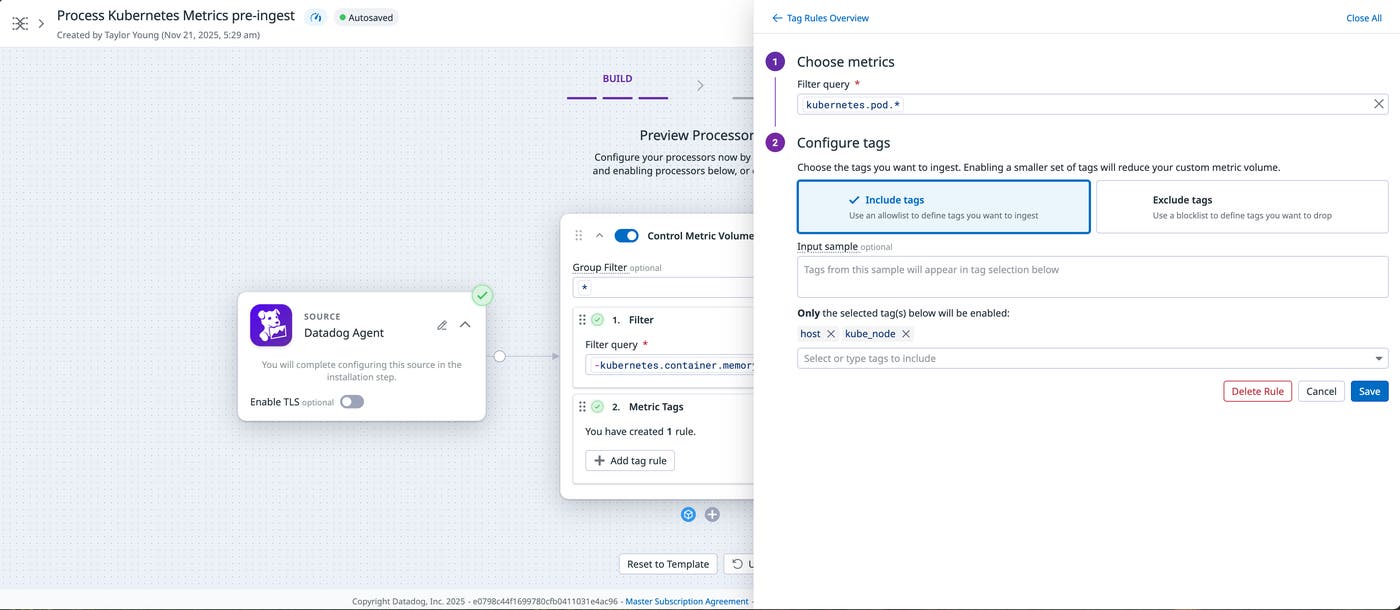
These filters and tag processors provide a way to centrally enforce organizational policies for metric naming, tagging, and structure.
Control tag cardinality
Individual teams often publish their own business-critical metrics, and it’s easy for a tag like user_id or request_id to slip in unnoticed. Because these tags can take on effectively unlimited values, they cause a metric’s cardinality—and its ingestion and indexing cost—to spike quickly. By the time a central team notices, the damage is often already done.
The Tag Cardinality Control processor lets you apply cardinality safeguards centrally before metrics ever reach your destination. You define a filter query to select which metrics the processor applies to, then set a limit on the number of distinct values allowed per tag. When a metric exceeds that limit, you choose whether to drop just the offending tag or drop the entire datapoint.
For more granular control, you can configure per-metric overrides. You can set a custom cardinality limit for a specific metric or exclude the metric entirely. Within a metric override, you can go a level deeper and apply per-tag overrides—for example, allowing unlimited values for host while capping values for region at five. If a tag is dropped due to a cardinality limit, you can pair the Tag Cardinality Control processor with the Aggregate processor downstream to recalculate the metric based on its remaining tags.
Monitor pipeline health with built-in diagnostics
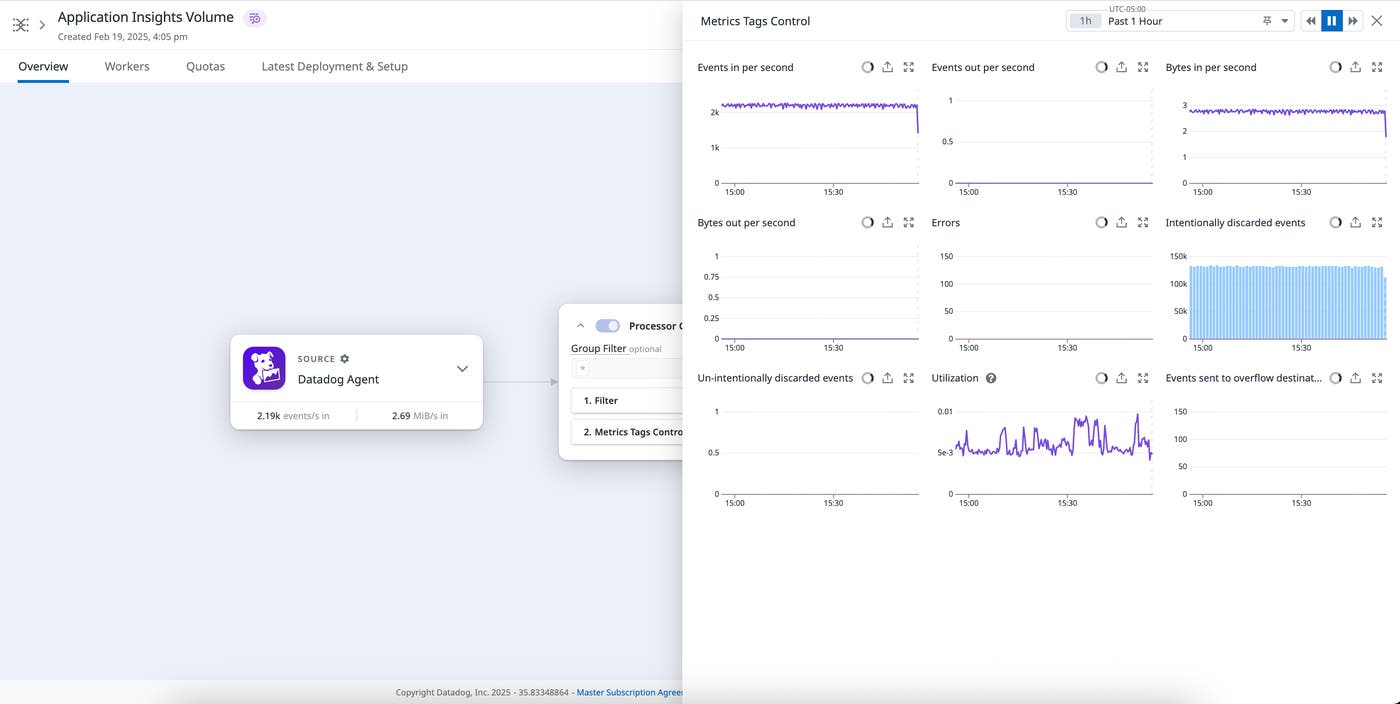
Observability Pipelines publishes diagnostic logs and metrics that report on pipeline activity and health. Each component emits metrics that include counts for events received and sent, bytes processed, events dropped, and utilization rate. This visibility helps teams confirm that pipelines are operating as expected and quickly identify points of congestion or data loss.
You can easily access these health indicators from the pipeline UI and Datadog Metrics Explorer. As you refine filters or modify tag inclusion lists in your pipeline, you can use these diagnostics to verify that your changes are applied correctly and the throughput remains stable.
Unify data ingestion and governance with Observability Pipelines
By adding support for metrics, Datadog Observability Pipelines provides a unified system for governing your telemetry data. Teams can consolidate tooling by managing both logs and metrics data while using the same interface, processors, and governance logic. This approach reduces tool fragmentation, helps ensure consistent tagging policies, and helps control the scale and cost of observability data. To learn more about configuring metric pipelines, read the Observability Pipelines documentation.
If you’re new to Datadog, you can sign up for a 14-day free trial to get started.
