
Tori Engler
Product Marketing Manager

Shelly Matskel
Product Manager
Kafka is a crucial and widely used technology: 80% of the Fortune 100 rely on the event streaming platform as part of their stack, according to Apache. But Kafka issues can be complex to manage and even more difficult to troubleshoot, as the same symptom can point to very different problems. Suppose consumer lag on your checkout-events topic suddenly exceeds its SLA. The cause might be an offline partition, a consumer that has stopped processing messages, a configuration change, or a payload that the consumer cannot deserialize. Determining which problem you have, and whether unprocessed messages are approaching their retention limit, can require correlating many different layers of your stack to piece together Kafka health, application behavior, configuration and schema changes, and message content.
Datadog Kafka Console collects health and performance data directly from your Kafka infrastructure, providing a mission-control center from which you can identify and remediate issues across your clusters, brokers, topics, partitions, consumer groups, configurations, schemas, and messages. With context from these sources, Kafka operators, platform engineers, and application developers can determine what is failing, understand the potential impact, and investigate the underlying cause without piecing together information from separate workflows.
In this post, we’ll show how Kafka Console helps you:
- Identify issues across brokers, partitions, and schemas
- Troubleshoot Kafka at the message level
- Connect Kafka infrastructure and application context
Identify issues across brokers, partitions, and schemas
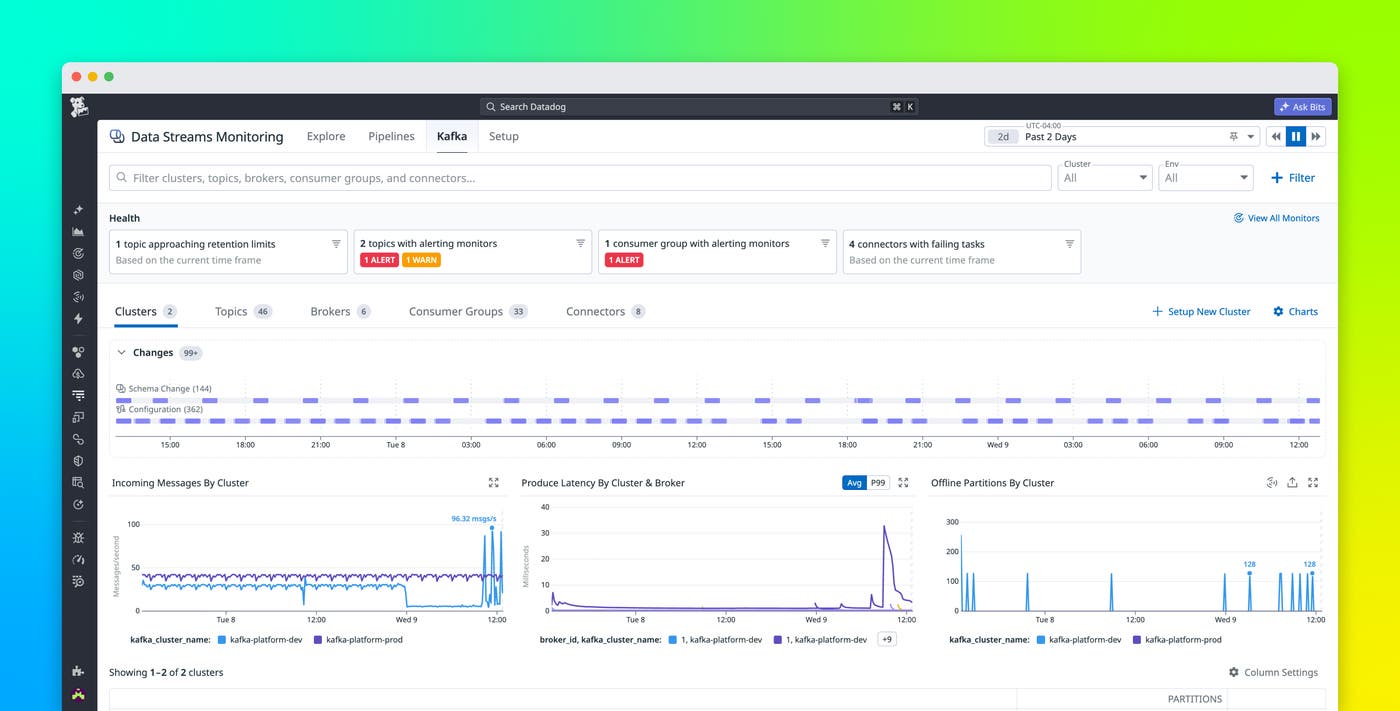
Kafka Console helps you determine whether Kafka is available and keeping up with the applications that depend on it. After you set up Kafka Console, a Datadog Agent check connects to your Kafka cluster and collects health and performance data. The Clusters, Topics, and Brokers views provide health information for resources including brokers, topics, partitions, and consumer groups.
Kafka Console also provides recommended monitor templates for these Kafka resources, including offline partitions and consumer lag approaching time- or byte-based retention limits. This lets you alert teams when a Kafka condition puts a pipeline at risk rather than waiting for someone to notice the problem on a dashboard.
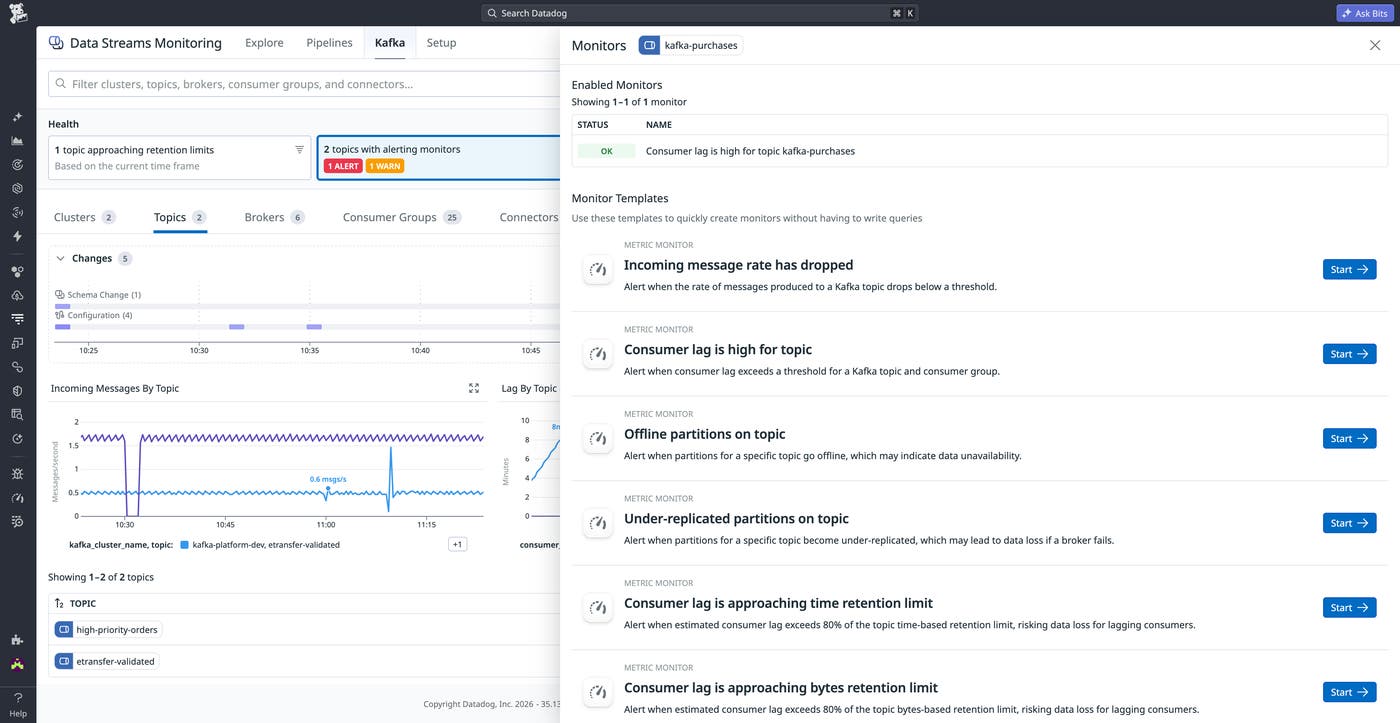
For example, if lag spikes on the checkout-events topic, you can inspect its partition state, throughput, and consumer lag from the topic view. Kafka Console surfaces conditions such as offline and under-replicated partitions and shows the maximum consumer lag across partitions. It can also indicate whether lag is approaching the topic’s retention limit, which helps you understand when a processing delay is becoming a data loss risk rather than relying on a manual estimate.
Kafka Console also correlates configuration and schema changes with Kafka health. Change events appear on throughput and lag graphs, and you can open a detected configuration change to inspect what changed. If lag starts increasing after a configuration or schema update, that temporal context gives you a concrete place to begin investigating instead of assuming that the broker or consumer is responsible.
When application context is available, the topic view also lists producer and consumer services and links them to ownership information from the Software Catalog, such as the responsible team, repository, on-call engineer, and Slack channel. This context helps platform teams determine which services are affected and identify the appropriate owner when a producer or consumer is misbehaving.
Troubleshoot Kafka at the message level
Metrics can tell you that a consumer has fallen behind or started returning errors, but they cannot always explain what was in the message that triggered the problem. Kafka Console lets authorized users retrieve messages from topics on demand so they can inspect the payload associated with an issue.
Consider a consumer that begins reporting deserialization errors on checkout-events. The stack trace tells you deserialization failed, while the Messages view shows you why: Retrieve the message by partition and offset and inspect the exact field and value that broke it. Combined with schema version history, you can determine whether an unexpected message structure or schema change contributed to the failure.
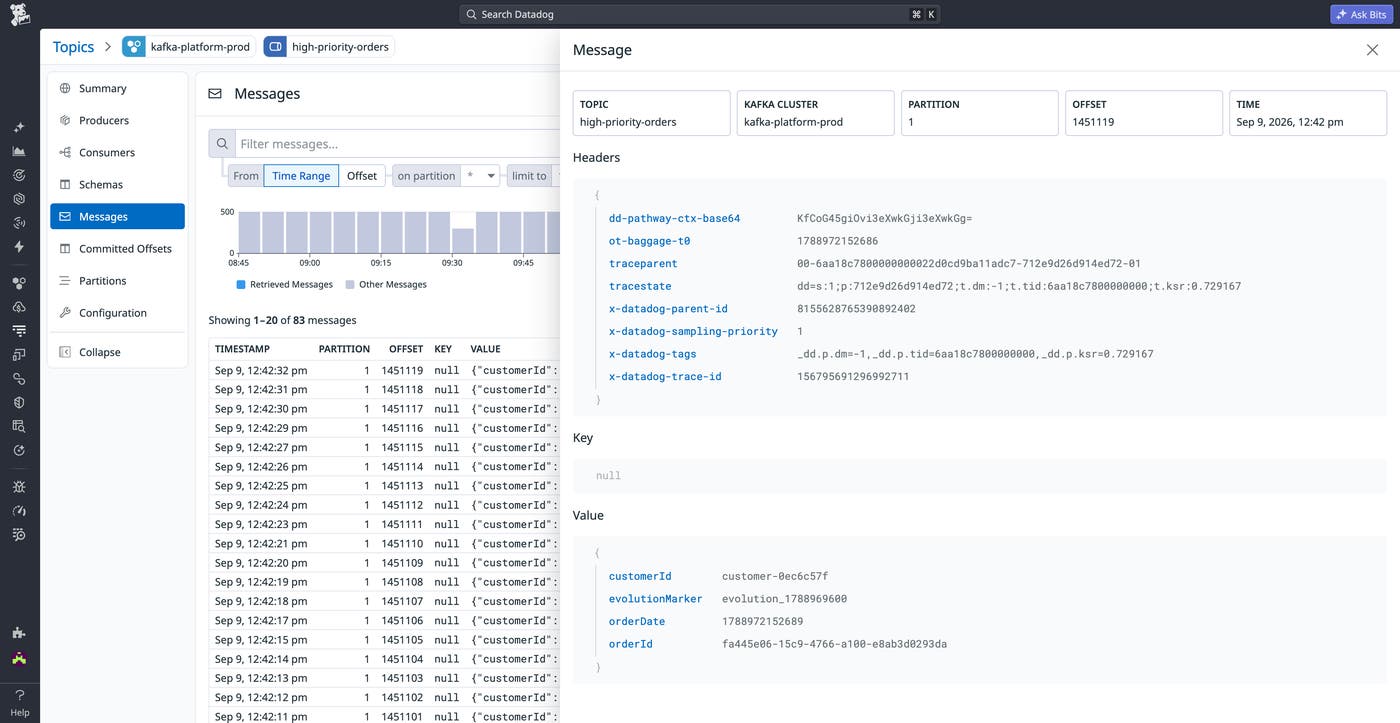
Message inspection requires additional access because payloads can contain sensitive application data. In addition to the Kafka permissions required for cluster monitoring, the Datadog Agent user needs read access to the relevant topics. Remote Configuration must be enabled at the organization, Agent, and API key levels, and Datadog users who retrieve messages need the Data Streams Monitoring Capture Messages permission. See the Kafka Console setup documentation for the complete prerequisites.
Kafka Console can also collect schemas from a configured schema registry. From a topic, you can inspect its current key or value schema and compare versions. Bringing schemas and message payloads into the same investigation as lag, throughput, and configuration changes helps you distinguish an infrastructure problem from a data problem that metrics alone cannot explain.
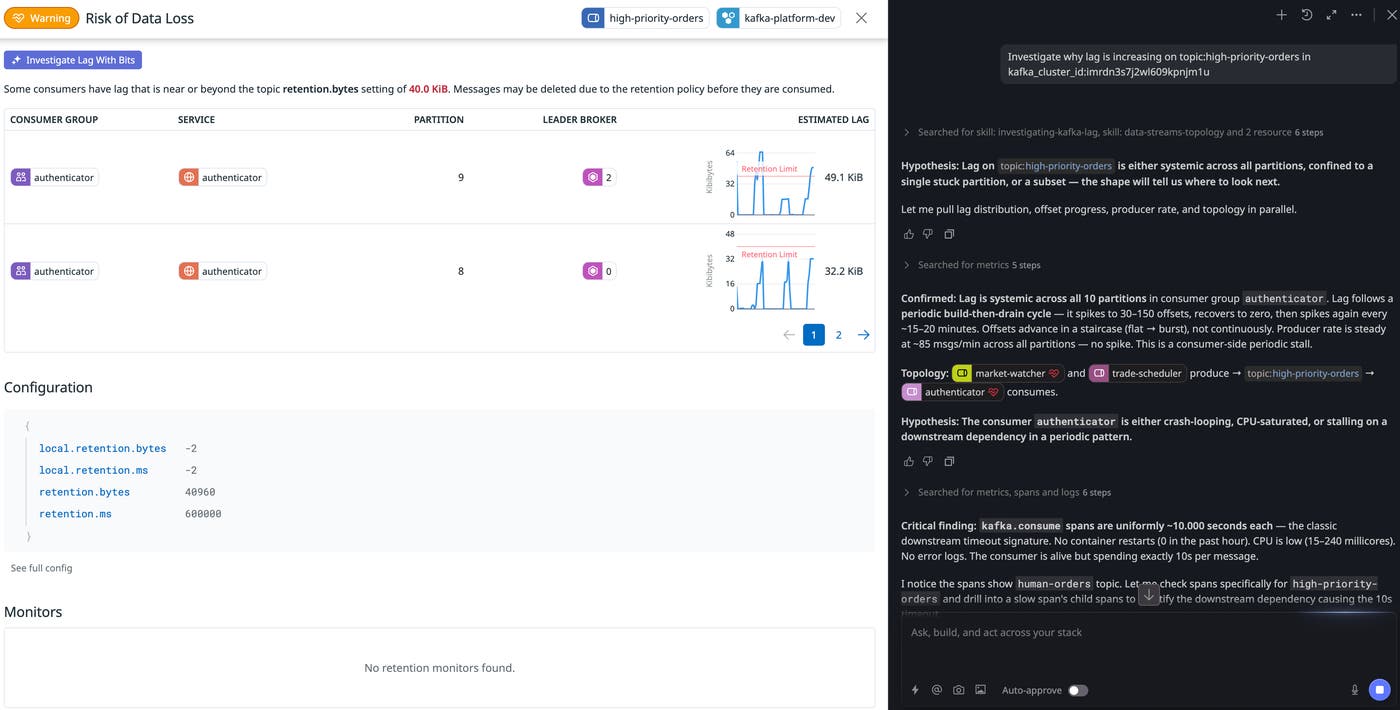
Using all of this rich context, Bits AI can investigate Kafka issues for you. Within any monitor, click “Investigate with Bits” to get a clear investigation report, a hypothesis tree, and a recommended fix to resolve issues in minutes.
Optimize Kafka performance
After you identify a Kafka performance problem, determining which configuration to change can require another round of investigation. Kafka Console provides recommendations for Kafka configurations to help teams improve throughput, reduce lag, and use cluster resources more efficiently.
For example, persistent consumer lag can indicate that a consumer’s configuration does not match the workload it needs to process. Kafka Console can surface configuration recommendations that give you a starting point for tuning rather than requiring you to identify candidate settings through trial and error.
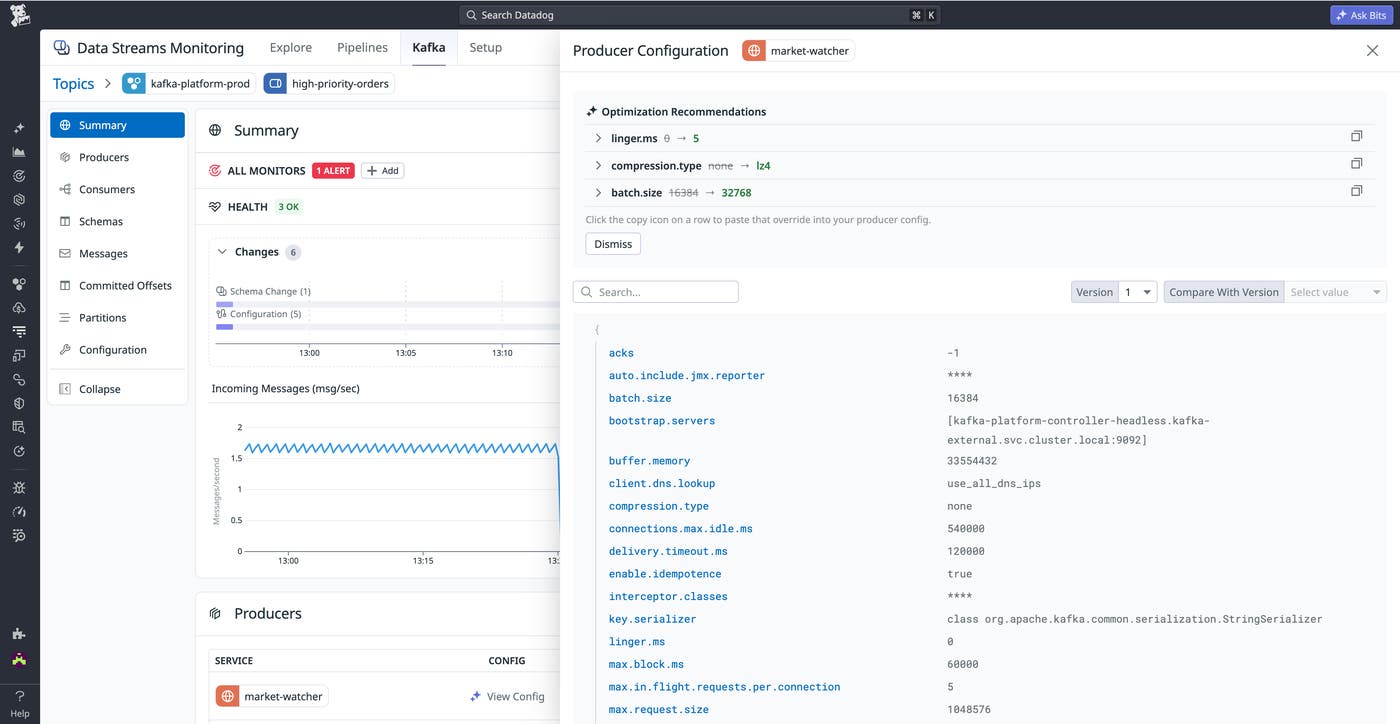
Kafka Console brings these recommendations into the same Datadog workflows where teams investigate Kafka health. Kafka context is available alongside Data Streams Monitoring (DSM) data when both are in use. In addition, Kafka Console works with Datadog’s AI capabilities, including Bits AI and the Datadog MCP Server, as part of troubleshooting and optimization workflows. All Kafka data surfaced in the Datadog UI is available through the MCP Server, including bundled skills that bring expert-level Kafka knowledge to common investigation workflows. Kafka users can simply ask, “Why is my topic lagging?” without needing to understand the minutiae of brokers, replication, serialization, and configuration options.
Connect Kafka infrastructure and application context
Kafka Console and Data Streams Monitoring provide complementary views of Kafka-based applications. Kafka Console collects information directly from Kafka clusters, so you can monitor cluster health without instrumenting producer and consumer application code. Meanwhile, DSM application instrumentation maps data flow and latency across producer and consumer services.
This distinction matters when troubleshooting. If checkout-service falls behind on checkout-events, Kafka Console can help you inspect broker and partition health, lag, configurations, schemas, and messages. DSM can add application-level context about the producer and consumer services that participate in the pipeline. Teams can use Kafka Console independently, use DSM independently, or combine them for broker-to-application context.
Because Kafka Console reads Kafka health data from the cluster, application teams can investigate infrastructure-level causes even when their applications are not instrumented for DSM. When DSM instrumentation is available, platform teams can connect Kafka problems to affected services and application owners, reducing the ambiguity that often surrounds responsibility for streaming pipeline failures.
Investigate Kafka issues with Kafka Console
Kafka Console helps Kafka operators and application teams identify what is failing, understand the potential impact, and investigate the cause with Kafka health, configuration, schema, and message context in Datadog, using Bits AI or with your preferred agent via the Datadog MCP. This control center for Kafka is particularly useful when symptoms such as consumer lag could originate from infrastructure, application behavior, or the data itself.
To configure Kafka Console and review its requirements, see the Kafka Console documentation and Kafka Console setup guide. You can also review the Kafka monitors and automation documentation to start alerting on conditions such as offline partitions and consumer lag approaching retention limits.
If you don’t have a Datadog account, sign up for 14-day free trial to monitor, inspect, and tune Kafka from broker to message.
