
Paul Gottschling
Datadog Technical Content Writer

David M. Lentz
In Part 2, we showed you how to use Istio's built-in features and integrations with third-party tools to visualize your service mesh, including the metrics that we introduced in Part 1. While Istio's containerized architecture makes it straightforward to plug in different kinds of visualization software like Kiali and Grafana, you can get deeper visibility into your service mesh and reduce the time you spend troubleshooting by monitoring Istio with a single platform.
In this post, we'll show you how to use Datadog to monitor Istio, including how to:
Collect metrics, traces, and logs automatically from Istio's internal components and the services running within your mesh
Use dashboards to visualize Istio metrics alongside metrics from Kubernetes and your containerized applications
Visualize request traces between services in your mesh to find bottlenecks and misconfigurations
Search and analyze all of the logs in your mesh to understand trends and get context
Set alerts to get notified automatically of issues within your mesh
With Datadog, you can seamlessly navigate between Istio metrics, traces, and logs to place your Istio data in the context of your infrastructure as a whole. You can also use alerts to get notified automatically of possible issues within your Istio deployment.
How to run Datadog in your Istio mesh
The Datadog Agent is open source software that collects metrics, traces, and logs from your environment and sends them to Datadog. Datadog's Istio integration queries Istio's Prometheus endpoints automatically, meaning that you don't need to run your own Prometheus server to collect data from Istio. In this section, we'll show you how to set up the Datadog Agent to get deep visibility into your Istio service mesh.
These instructions are intended for users of Istio versions prior to 1.5. For instructions on setting up Datadog to monitor Istio versions 1.5 and later, see our dedicated post.
Set up the Datadog Agent
To start monitoring your Istio Kubernetes cluster, you'll need to deploy:
A node-based Agent that runs on every node in your cluster, gathering metrics, traces, and logs to send to Datadog
A Cluster Agent that runs as a Deployment, communicating with the Kubernetes API server and providing cluster-level metadata to node-based Agents
With this approach, we can avoid the overhead of having all node-based Agents communicate with the Kubernetes control plane, as well as enrich metrics collected from node-based Agents with cluster-level metadata, such as the names of services running within the cluster.
You can install the Datadog Cluster Agent and node-based Agents using our Helm chart. This is available from the datadog repository, which you can add with the following commands:
helm repo add datadog https://helm.datadoghq.com;helm repo update;The command for installing the Datadog Helm chart, which we will explain in more detail below, is the following:
helm install datadog \ datadog/datadog \ --namespace datadog \ --create-namespace \ --values ./dd-values.yaml;This command uses the --create-namespace flag to create a dedicated Kubernetes namespace for our Datadog resources, making it easier for us to query them and execute commands via kubectl. We are using the --namespace flag to call this namespace datadog.
The --values flag indicates the path of a Helm values file that we will use to configure our Datadog installation. In this guide, we will show you how to set up this file in order to get comprehensive visibility into your Istio mesh. After configuring Datadog to collect the data we will introduce in this guide, your values file will have the following content:
# Configure the node-based Agentdatadog: apiKey: <DATADOG_API_KEY> # "Set up the Istio integration" clusterChecks: enabled: true # Receiving traces apm: enabled: true # Set up Istio log collection logs: containerCollectAll: true enabled: true acExclude: "name:datadog-agent name:datadog-cluster-agent" # Enable the Process Agent and system probe processAgent: processCollection: true networkMonitoring: enabled: true
# Configure the Cluster AgentclusterAgent: enabled: true # Disable automatic sidecar injection for Datadog Agent pods podAnnotations: sidecar.istio.io/inject: "false"
# Disable automatic sidecar injection for Datadog Agent podsagents: podAnnotations: sidecar.istio.io/inject: "false"To install Datadog in your Istio cluster, you will need to:
Configure permissions for the node-based Agents and Cluster Agent
Disable automatic sidecar injection for Datadog Agent pods
Configure permissions for the Cluster Agent and node-based Agents
Both the Cluster Agent and node-based Agents take advantage of Kubernetes' built-in role-based access control (RBAC), including:
A ClusterRole that declares a named set of permissions for accessing Kubernetes resources, in this case to allow the Agent to collect data on your cluster
A ClusterRoleBinding that assigns the ClusterRole to the service account that the Datadog Agent will use to access the Kubernetes API server
The Datadog Helm chart installs these RBAC resources by default, so you won't need to add anything to your Helm values file. However, if you want the node-based Agent and Cluster Agent to use existing RBAC resources instead, you should include the following:
agents: rbac: serviceAccountName: <EXISTING_SERVICE_ACCOUNT_NAME>clusterAgent: rbac: create: false serviceAccountName: <EXISTING_SERVICE_ACCOUNT_NAME>Configure the Cluster Agent
To deploy the Cluster Agent, add the following to your values file:
clusterAgent: enabled: trueThis option instructs the Helm installation to declare two Kubernetes resources:
A Deployment that adds an instance of the Cluster Agent pod to your cluster
A Service that allows the Datadog Cluster Agent to communicate with the rest of your cluster
Note that the Cluster Agent only runs on Linux-based Kubernetes hosts, even if the other hosts in the cluster use Windows. If you would like to deploy the Cluster Agent into a cluster with Windows-based hosts, follow our documentation.
Configure the node-based Agent
The node-based Agent collects metrics, traces, and logs from containers running on each node and sends this data to Datadog. The Datadog Helm chart deploys a DaemonSet that schedules one node-based Agent pod on each node in the cluster, including newly launched nodes. To enable the node-based Agent, add your Datadog API key to the values file when installing the Helm chart:
datadog: apiKey: <DATADOG_API_KEY>If you prefer to include your API key in a Kubernetes Secret managed outside the Datadog Helm chart, you can deploy your Secret separately, then refer to its metadata.name within your values file:
datadog: apiKeyExistingSecret: <NAME_OF_YOUR_SECRET>Disable automatic sidecar injection for Datadog Agent pods
You'll also want to prevent Istio from automatically injecting Envoy sidecars into your Datadog Agent pods and interfering with data collection. You should disable automatic sidecar injection for both the Cluster Agent and node-based Agents by adding the following to your Helm values file:
agents: podAnnotations: sidecar.istio.io/inject: "false"
clusterAgent: podAnnotations: sidecar.istio.io/inject: "false"After installing the Datadog Helm chart, run the following kubectl command to verify that your Cluster Agent and node-based Agent pods are running. There should be one pod named datadog-agent-<STRING> running per node, and a single instance of datadog-cluster-agent-<STRING>.
$ kubectl -n <DATADOG_NAMESPACE> get podsNAME READY STATUS RESTARTS AGEdatadog-agent-bqtdt 1/1 Running 0 4d22hdatadog-agent-gb5fs 1/1 Running 0 4d22hdatadog-agent-lttmq 1/1 Running 0 4d22hdatadog-agent-vnkqx 1/1 Running 0 4d22hdatadog-cluster-agent-9b5b56d6d-jwg2l 1/1 Running 0 5d22hOnce you've deployed the Cluster Agent and node-based Agents, Datadog will start to report host– and platform-level metrics from your Kubernetes cluster.
Before you can get metrics from Pilot, Galley, Mixer, Citadel, and services within your mesh, you'll need to set up Datadog's Istio integration.
Set up the Istio integration
The Datadog Agent's Istio integration automatically queries Istio's Prometheus metrics endpoints, enriches all of the data with tags, and forwards it to the Datadog platform. The Datadog Cluster Agent uses a feature called endpoint checks to detect Istio's Kubernetes services, identify the pods that back them, and send configurations to the Agents on the nodes running those pods. Each node-based Agent then uses these configurations to query the Istio pods running on the local node for data.
If you horizontally scale an Istio component, there is a risk that requests to that component's Kubernetes service will load balance randomly across the component's pods. Endpoint checks enable the Datadog Agent to bypass Istio's Kubernetes services and query the backing pods directly, avoiding the risk of load balancing queries.
The Datadog Agent uses Autodiscovery to track the services exposing Istio's Prometheus endpoints. We can enable the Istio integration by annotating these services. The annotations contain Autodiscovery templates—when the Cluster Agent detects that a currently deployed service contains a relevant annotation, it will identify each backing pod, populate the template with the pod's IP address, and send the resulting configuration to a node-based Agent. We'll create one Autodiscovery template per Istio component—each Agent will only load configurations for Istio pods running on its own node.
Note that you'll need to run versions 6.17+ or 7.17+ of the node-based Agent and version 1.5.2+ of the Datadog Cluster Agent.
Run the following script to annotate each Istio service using kubectl patch. Since there are multiple ways to install Istio, this approach lets you annotate your services without touching their manifests.
#!/bin/bashkubectl -n istio-system patch service istio-telemetry --patch "$(cat<<EOFmetadata: annotations: ad.datadoghq.com/endpoints.check_names: '["istio"]' ad.datadoghq.com/endpoints.init_configs: '[{}]' ad.datadoghq.com/endpoints.instances: | [ { "istio_mesh_endpoint": "http://%%host%%:42422/metrics", "mixer_endpoint": "http://%%host%%:15014/metrics", "send_histograms_buckets": true } ]EOF)"
kubectl -n istio-system patch service istio-galley --patch "$(cat<<EOFmetadata: annotations: ad.datadoghq.com/endpoints.check_names: '["istio"]' ad.datadoghq.com/endpoints.init_configs: '[{}]' ad.datadoghq.com/endpoints.instances: | [ { "galley_endpoint": "http://%%host%%:15014/metrics", "send_histograms_buckets": true } ]EOF)"
kubectl -n istio-system patch service istio-pilot --patch "$(cat<<EOFmetadata: annotations: ad.datadoghq.com/endpoints.check_names: '["istio"]' ad.datadoghq.com/endpoints.init_configs: '[{}]' ad.datadoghq.com/endpoints.instances: | [ { "pilot_endpoint": "http://%%host%%:15014/metrics", "send_histograms_buckets": true } ]EOF)"
kubectl -n istio-system patch service istio-citadel --patch "$(cat<<EOFmetadata: annotations: ad.datadoghq.com/endpoints.check_names: '["istio"]' ad.datadoghq.com/endpoints.init_configs: '[{}]' ad.datadoghq.com/endpoints.instances: | [ { "citadel_endpoint": "http://%%host%%:15014/metrics", "send_histograms_buckets": true } ]EOF)"When the Cluster Agent identifies a Kubernetes service that contains these annotations, it uses them to fill in configuration details for the Istio integration. The %%host%% template variable becomes the IP of a pod backing the service. The Cluster Agent sends the configuration to a Datadog Agent running on the same node, and the Agent uses the configuration to query the pod's metrics endpoint.
You can also provide a value for the option send_histograms_buckets—if this option is enabled (the default), the Datadog Agent will tag any histogram-based metrics with the upper_bound prefix, indicating the name of the metric's quantile bucket.
The Datadog Cluster Agent sends endpoint check configurations to node-based Agents using cluster checks. To enable these checks, make sure you've enabled the Cluster Agent and add the following to your values file:
datadog: clusterChecks: enabled: trueFinally, enable the Istio integration by clicking the tile in your Datadog account.
Once the installation is complete, the node-based Agents will collect endpoint check configurations from the Cluster Agent, and you should expect to see metrics flowing into Datadog's out-of-the-box dashboard for Istio, which we'll explain in more detail later.
Visualize all of your Istio metrics together
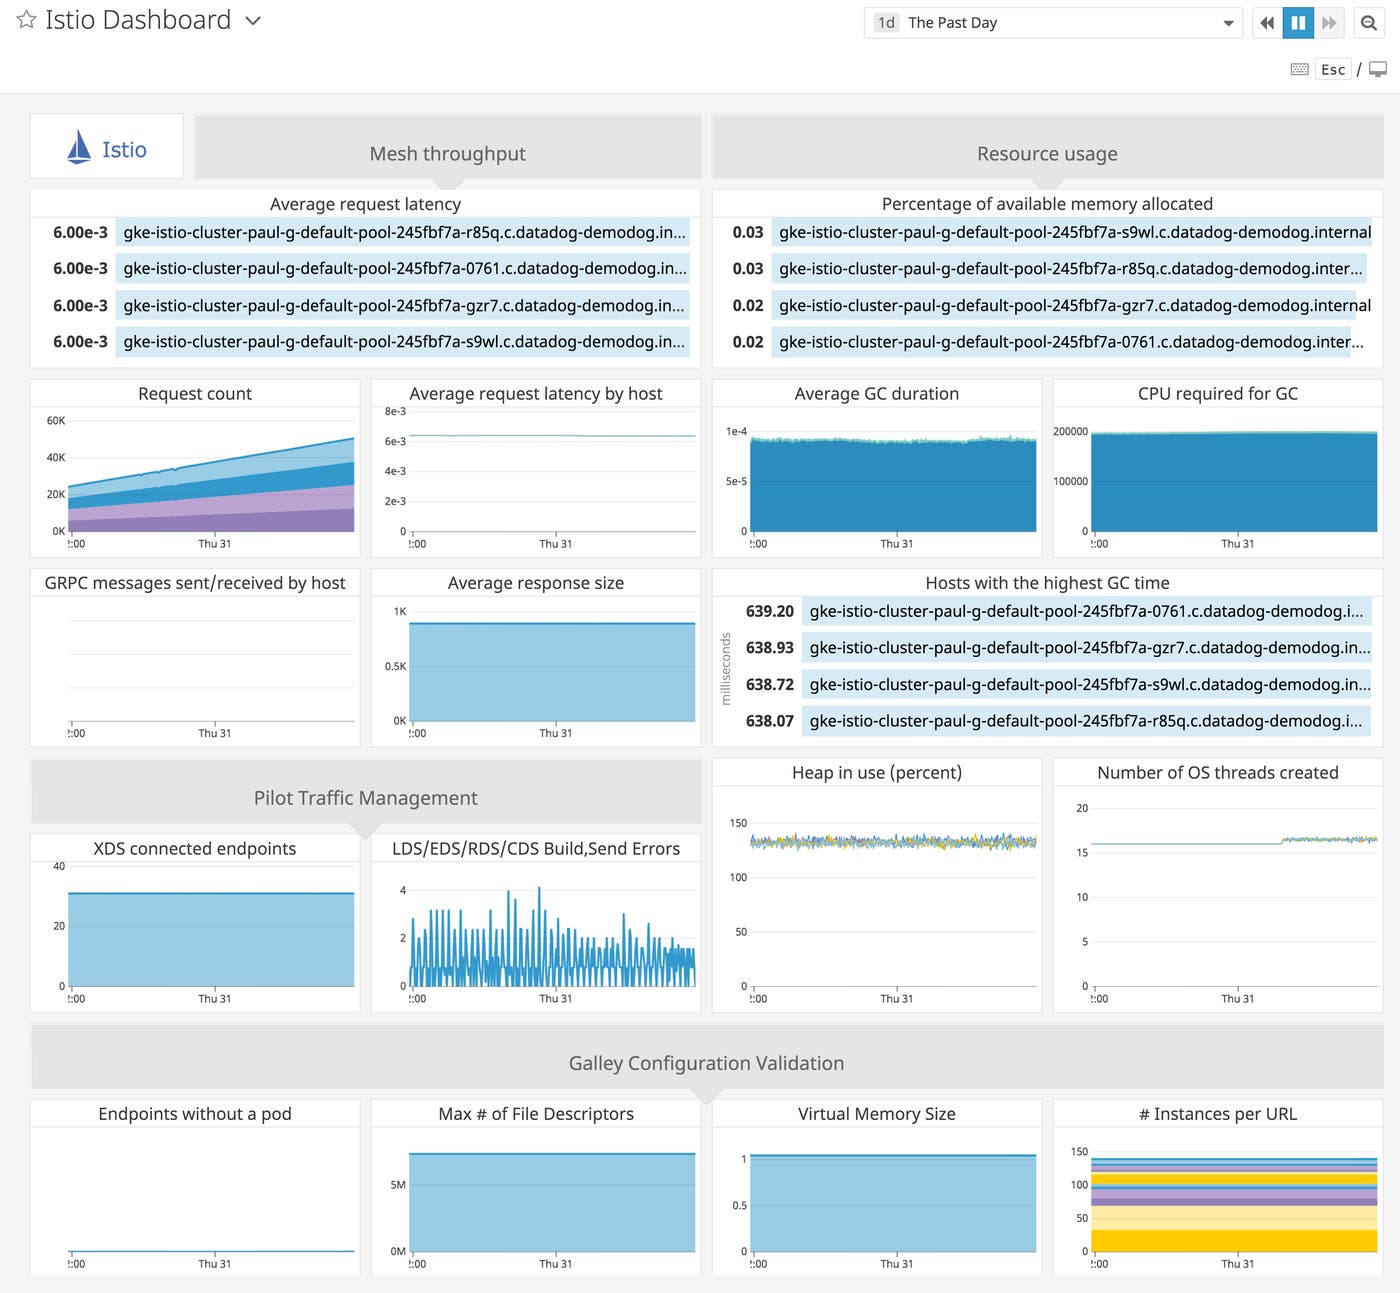
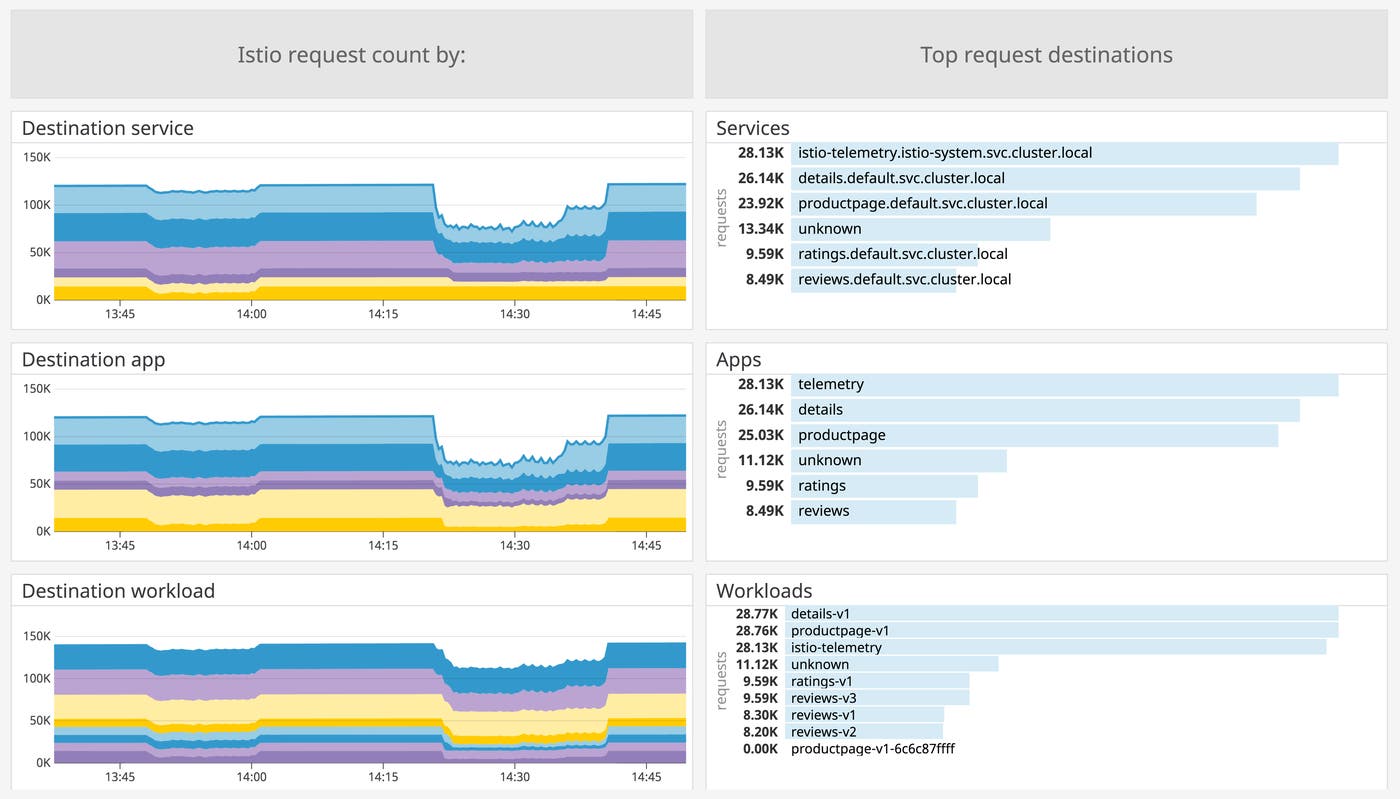
After installing the Datadog Agent and enabling the Istio integration, you'll have access to an out-of-the-box dashboard showing key Istio metrics. You can see request throughput and latency from throughout your mesh, as well as resource utilization metrics for each of Istio's internal components.
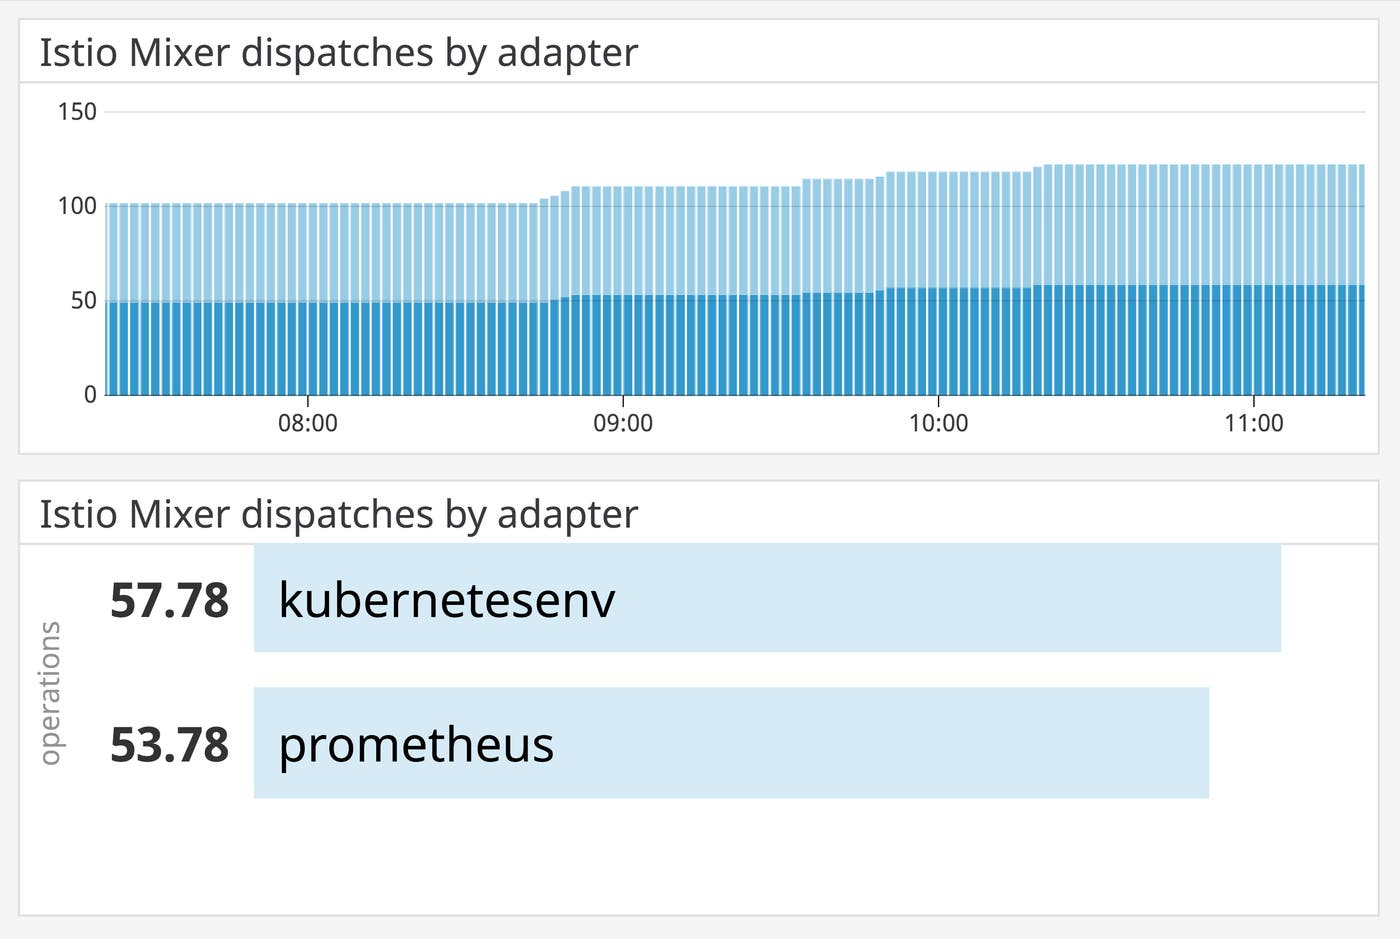
You can then clone the out-of-the-box Istio dashboard and customize it to produce the most helpful view for your environment. Datadog imports tags automatically from Docker, Kubernetes, and Istio, as well as from the mesh-level metrics that Mixer exports to Prometheus (e.g., source_app and destination_service_name). You can use tags to group and filter dashboard widgets to get visibility into Istio's performance. For example, the following timeseries graph and toplist use the adapter tag to show how many dispatches Mixer makes to each adapter.
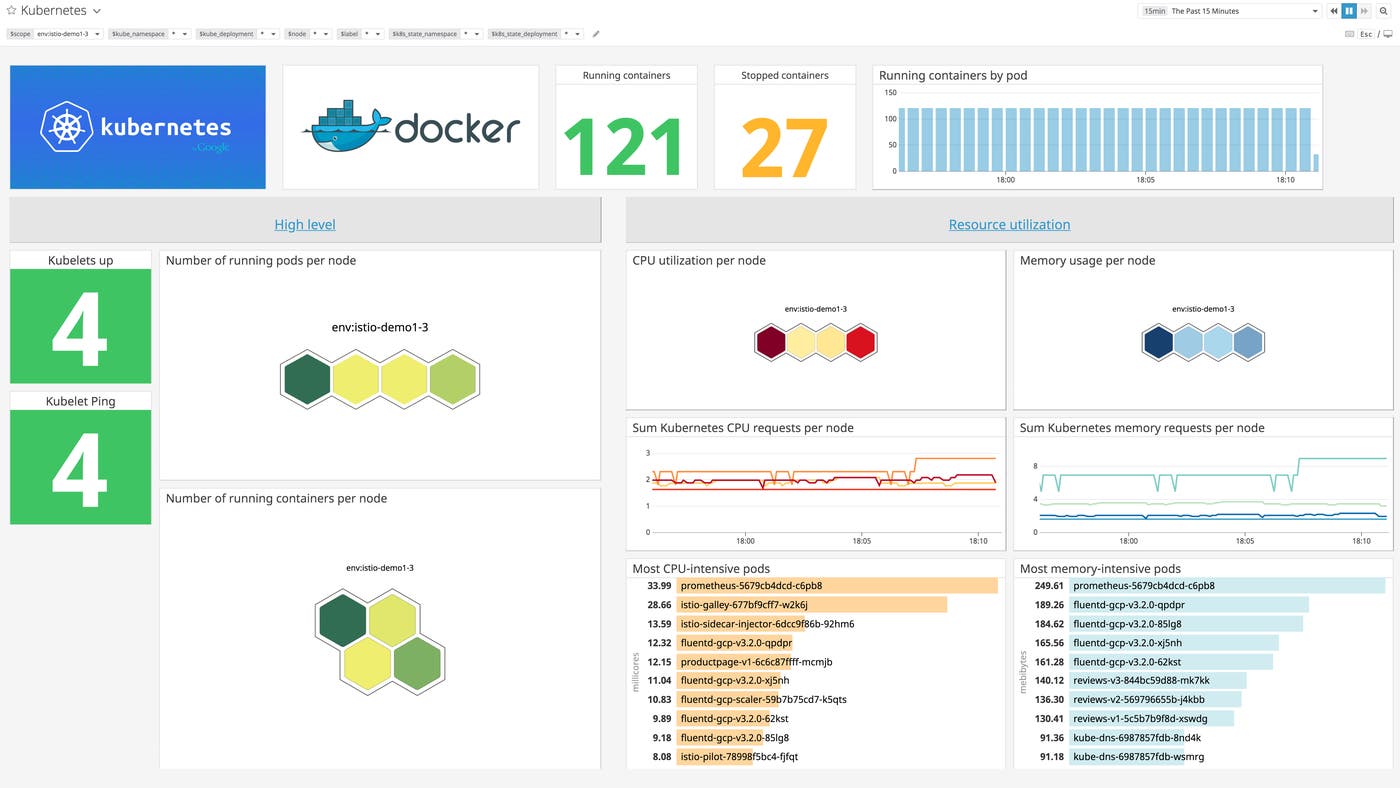
You can also quickly understand the scope of an issue (does it affect a host, a pod, or your whole cluster?) by using Datadog's mapping features: the host map and container map. Using the container map, you can easily localize issues within your Kubernetes cluster. And if issues are due to resource constraints within your Istio nodes, this will become apparent within the host map.
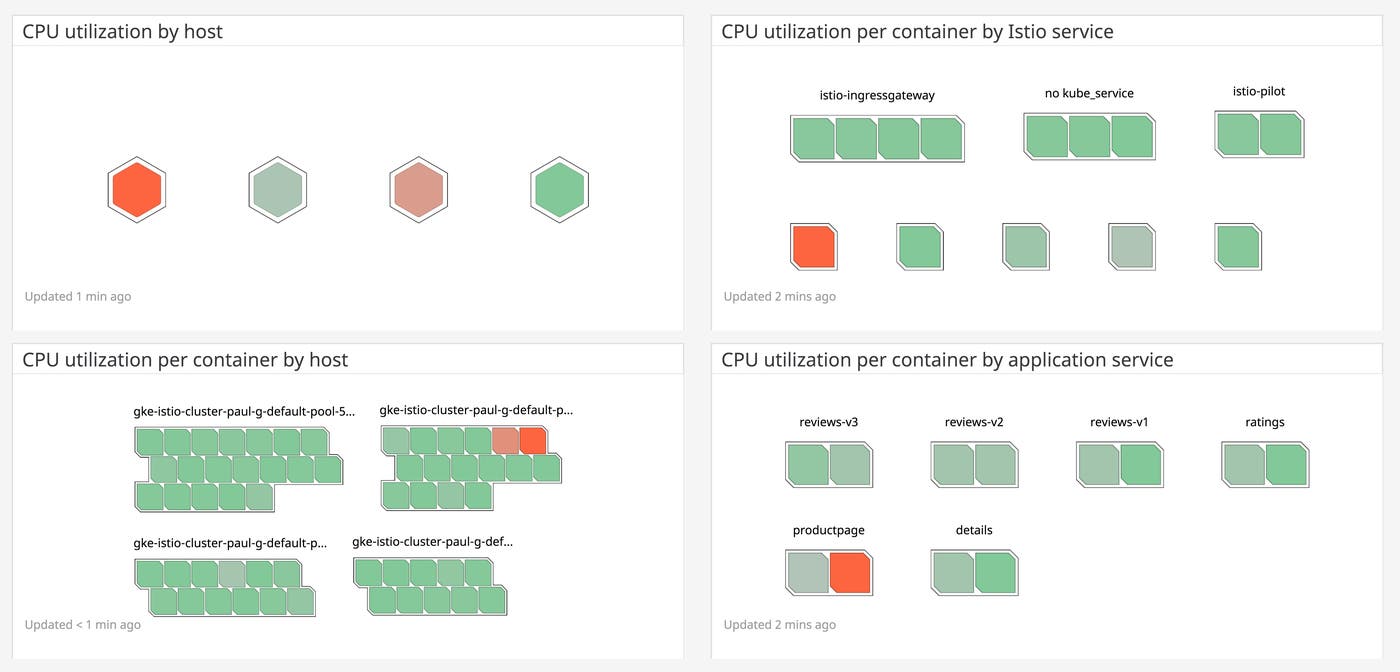
You can color the host map based on the current value of any metric (and the container map based on any resource metric), making it clear which parts of your infrastructure are underperforming or overloaded. You can then use tags to group and filter the maps, helping you answer any questions about your infrastructure.
The dashboard above shows CPU utilization in our Istio deployment. In the upper-left widget, we can see that this metric is high for two hosts. To investigate, we can use the container map on the bottom left to see if any container running within those hosts is facing unusual load. Istio's components might run on any node in your cluster—the same goes for the pods running your services. To monitor our pods regardless of where they are running, we can group containers by the service tag, making it clear which Istio components or mesh-level services are facing the heaviest demand. The kube_namespace tag allows us to view components and services separately.
Get insights into mesh activity
Getting visibility into traffic between Istio-managed services is key to understanding the health and performance of your service mesh. With Datadog's distributed tracing and application performance monitoring (APM), you can trace requests between your Istio-managed services to understand your mesh and troubleshoot issues. You can display your entire service topology using the Service Map, visualize the path of each request through your mesh using flame graphs, and get a detailed performance portrait of each service. From APM, you can easily navigate to related metrics and logs, allowing you to troubleshoot more quickly than you would with dedicated graphing, tracing, and log collection tools.
Set up tracing
Receiving traces
You'll need to instruct the node-based Agents to accept traces. Enabling this is straightforward: set the datadog.apm.enabled option to true in your Helm values file.
datadog: apm: enabled: trueThis setting makes several changes to the node-based Agents and Cluster Agent, including:
Deploying the Trace Agent within the node-based Agent pod, which allows node-based Agents to receive traces and report them to Datadog
Using a Kubernetes
Serviceto direct trace data to an available node-based Agent podSetting up a Kubernetes
NetworkPolicythat allows APM traces to reach node-based Agent pods
After you install the Datadog Helm chart, the node-based Agents should be able to receive traces from Envoy proxies throughout your cluster. In the next step, you'll configure Istio to send traces to the Datadog Agent.
Sending traces
Istio has built-in support for distributed tracing using several possible backends, including Datadog. You need to configure tracing by setting three options:
pilot.traceSamplingis the percentage of requests that Istio will record as traces. Set this to100.00to send all traces to Datadog.global.proxy.tracerinstructs Istio to use a particular tracing backend, in our casedatadog.tracing.enabledinstructs Istio to record traces of requests within your service mesh.
Run the following command to enable Istio to send traces automatically to Datadog:
istioctl manifest apply --set values.global.proxy.tracer=datadog --set values.pilot.traceSampling=100.0Visualize mesh topology with the Service Map
Datadog automatically generates a Service Map from distributed traces, allowing you to quickly understand how services communicate within your mesh. The Service Map gives you a quick read into the results of your Istio configuration, so you can identify issues and determine where you might begin to optimize your network.
If you have set up alerts for any of your services (we'll introduce these in a moment), the Service Map will show their status. In this example, an alert has triggered for the productpage service in the default namespace. We can navigate directly from the Service Map to see which alerts have triggered.
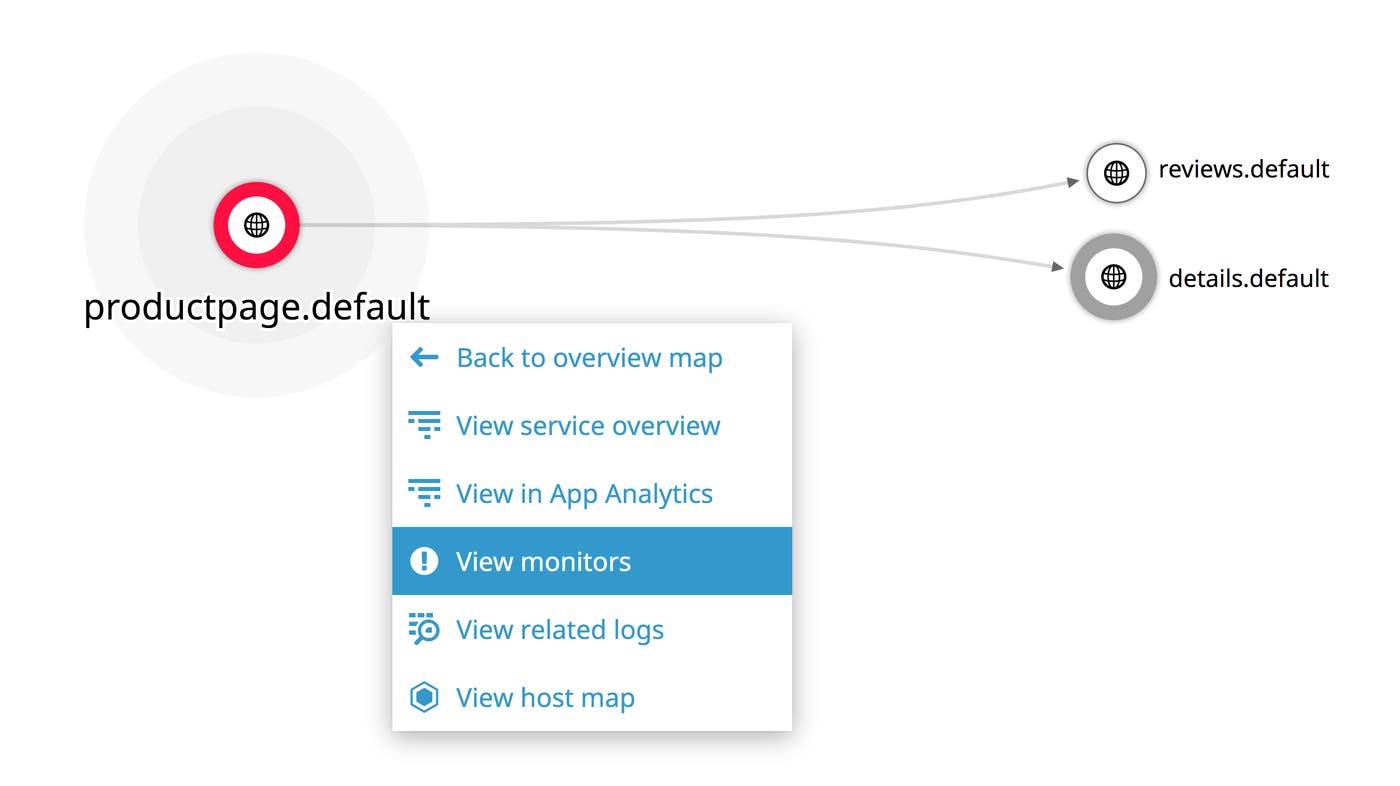
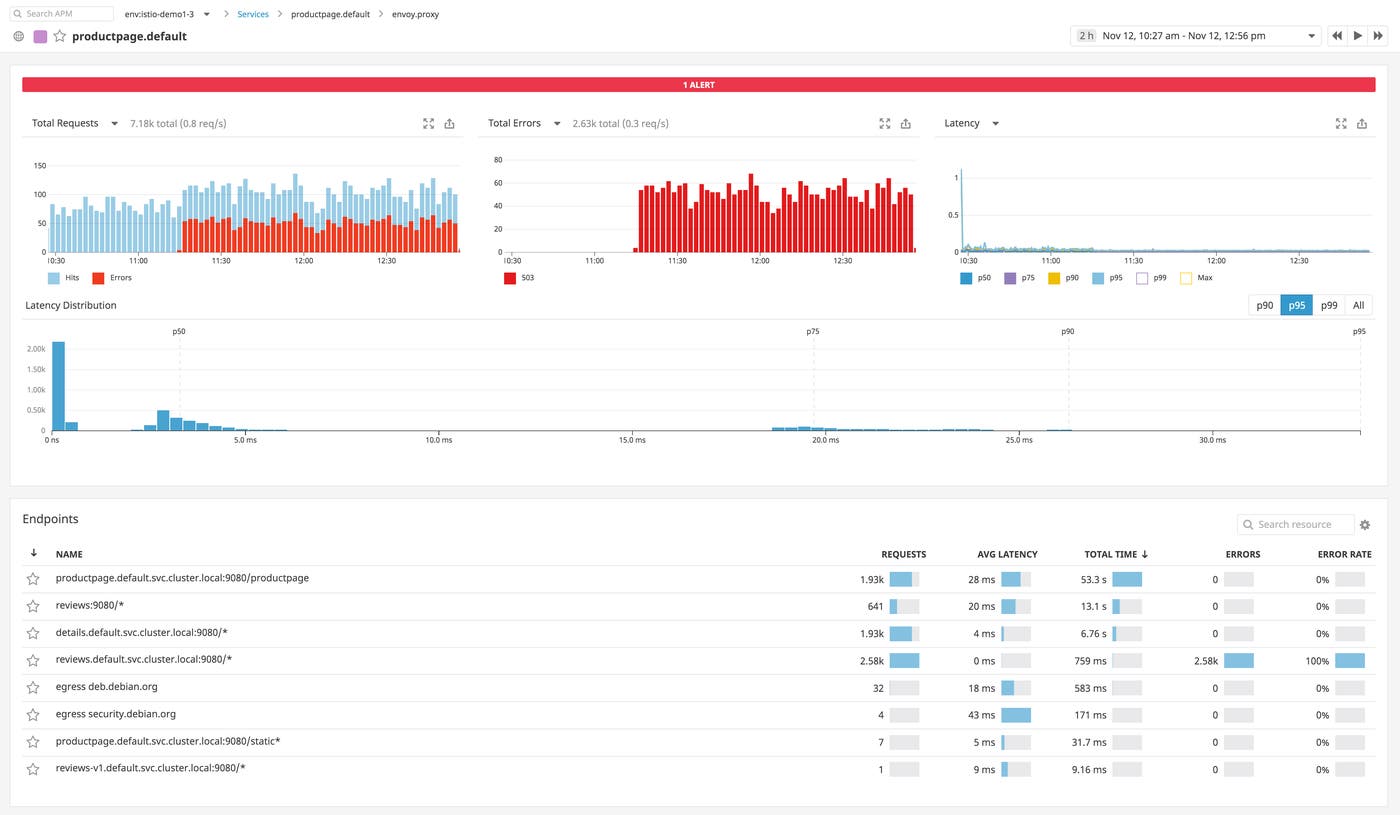
And if you click on "View service overview," you can get more context into service-level issues by viewing request rates, error rates, and latencies for a single service over time. For example, we can navigate to the overview of the productpage service to see when the service started reporting a high rate of errors, and correlate the beginning of the issue with metrics, traces, and logs from the same time.
Visualize mesh requests with flame graphs
Once you set up APM in your Istio mesh, you can inspect individual request traces using flame graphs. A flame graph is a visualization that displays the service calls that were executed to fulfill a request. The duration of each service call is represented by the width of the span, and in the sidebar, you can see the services called and the percent of time spent on each. You can click any span to see further information, such as metadata and error messages.
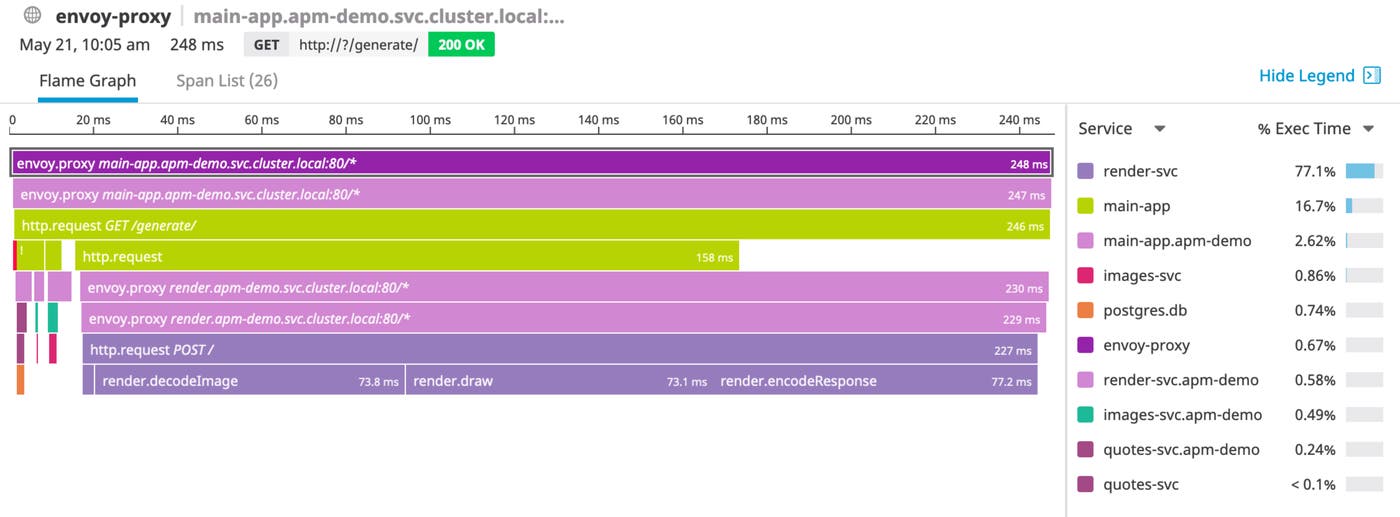
Note that in several spans, envoy.proxy precedes the name of the resource (which is the specific endpoint to which the call is addressed, e.g., main-app.apm-demo.svc.cluster.local:80). This is because Envoy proxies all requests within an Istio mesh. This architecture also explains why envoy.proxy spans are generated in pairs: the first span is created by the sidecar proxying the outgoing request, and the matching second span is from the sidecar that receives it.
You can get even deeper visibility into requests within your mesh by configuring your applications to report spans from functions and packages of your choice. In the example above, we have instrumented our applications to report spans for individual functions called by the render-svc service, using one of Datadog's custom tracing libraries. You can also auto-instrument your applications to visualize function calls within popular libraries in a number of languages.
Along with other APM features like Trace Search and Analytics and the Service Map, flame graphs can help you troubleshoot and investigate errors in your Istio mesh. In the next screenshot, we see that the reviews.default service has executed in 387 microseconds and returned the error code 500.
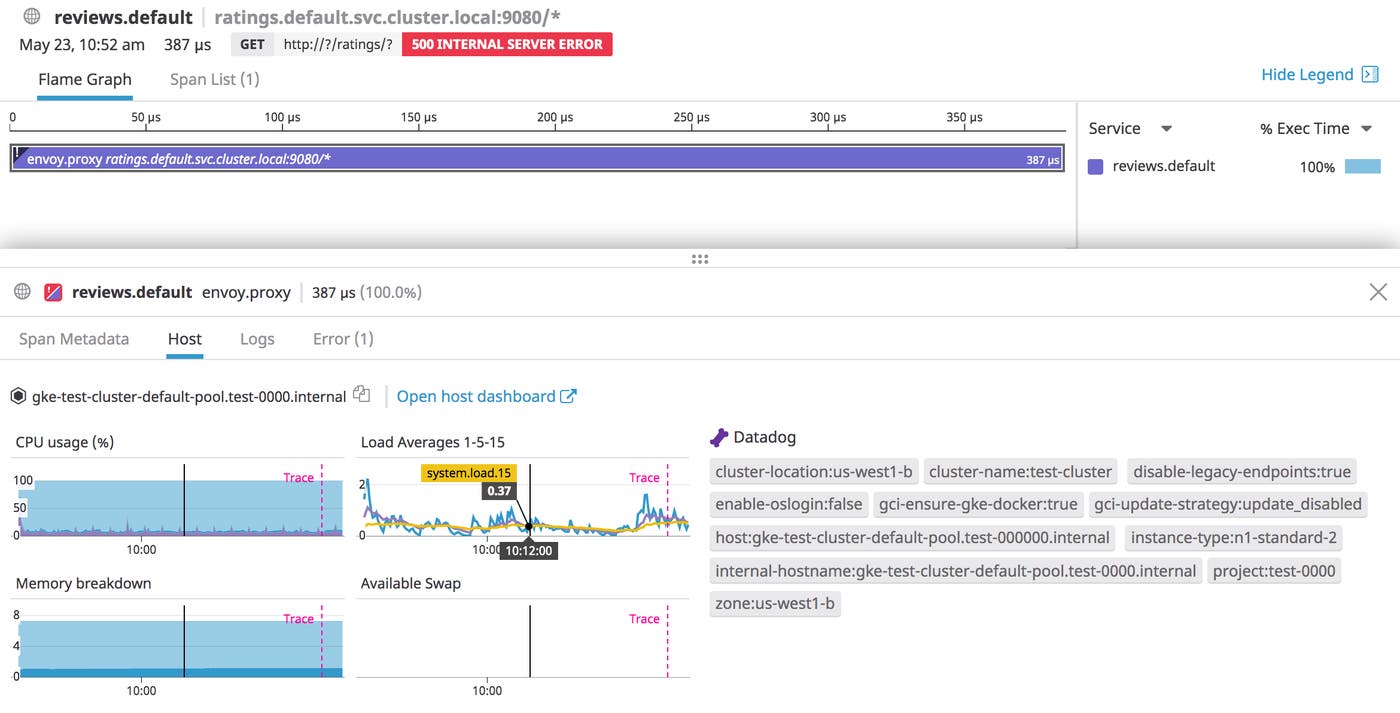
With Datadog APM you can see exactly where an error originates, and use the tabs below the flame graph—Span Metadata, Host, Logs, and Error—to see related information that can help you better understand the span you're inspecting.
For more information about monitoring your distributed services with APM, see our documentation.
Understand your Istio logs
If services within your mesh fail to communicate as expected, you'll want to consult logs to get more context. As traffic flows throughout your Istio mesh, Datadog can help you cut through the complexity by collecting all of your Istio logs in one platform for visualization and analysis.
Set up Istio log collection
To enable log collection, add the following options to your Helm values file:
datadog.logs.enabled: true: Switches on Datadog log collectiondatadog.logs.containerCollectAll: true: Tells each node-based Agent to collect logs from all containers running on that nodedatadog.acExclude: "name:datadog-agent name:datadog-cluster-agent": Filters out logs from certain containers before they reach Datadog, such as, in our case, those from Datadog Agent containers
When you deploy the node-based Agent pod as a DaemonSet, each Agent will read from the directory Kubernetes uses to store logs from local pods. Next, each Agent will enrich these logs with tags imported from Docker, Kubernetes, and your cloud provider, and send them to Datadog.
Discover trends with Log Patterns
Once you're collecting logs from your Istio mesh, you can start exploring them in Datadog. The Log Patterns view helps you extract trends by displaying common strings within your logs and generalizing the fields that vary into regular expressions. The result is a summary of common log types. This is especially useful for reducing noise within your Istio-managed environment, where you might be gathering logs from all of Istio's internal components in addition to Envoy proxies and the services in your mesh.
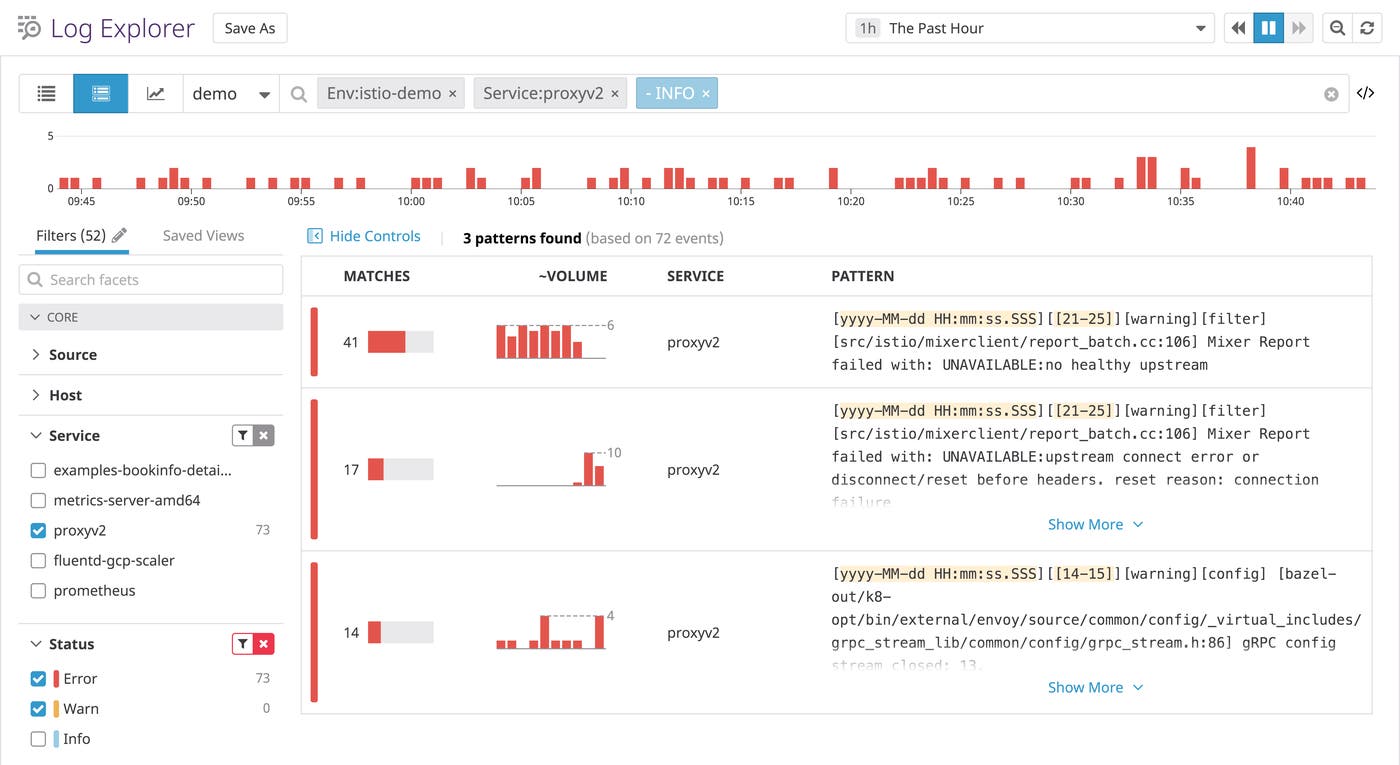
In this example, we used the sidebar to display only the patterns having to do with our Envoy proxies. We also filtered out INFO-level logs. Now that we know which error messages are especially common—Mixer is having trouble connecting to its upstream services—we can determine how urgent these errors are and how to go about resolving them.
Know what's flowing through your mesh
Datadog Network Performance Monitoring (NPM) automatically visualizes the topology of your Istio-managed network, giving you instant insights into dependencies between services, pods, and containers. You can use NPM to locate possible root causes of network issues, get real-time architecture visualizations, and spot inefficient designs. You can then track network data in the context of traces, logs, and process data from your infrastructure and applications.
Network Performance Monitoring receives data from the system probe, an eBPF program managed by the Datadog Agent that monitors traffic passing through each host's kernel network stack. Network Performance Monitoring automatically follows Istio's network address translation logic, giving you complete visibility into your Istio traffic with no configuration.
How to install Network Performance Monitoring in your Istio cluster
You can configure the Datadog Agent to enable NPM by adding the following options to your Helm values file:
datadog.processAgent.processCollection: true: Enable process data collection by the Process Agentdatadog.networkMonitoring.enabled: true: Enable the Datadog system probe, which collects low-level network data from the host OS
See your network traffic in context
Since Network Performance Monitoring tracks all of the traffic through the containers in your mesh, it gives you a good starting point for understanding your mesh topology and investigating misconfigurations and failed dependencies.
You can use the Network Map to get an instant view of your network architecture without having to deploy software beyond the Datadog Agent. This makes it easier to identify the scope of networking issues in your mesh, contain the blast radius, and prevent cascading failures. The color of each node in the Network Map indicates the status of any alerts associated with the service, pod, container, or other tag the node visualizes. You can inspect the upstream and downstream dependencies of a node—e.g., a service receiving an unusually low volume of network traffic—and check whether any of them are in an alerting state. You can then view these alerts to get context, such as related traces, helpful dashboards, and troubleshooting instructions.
If the Network Map is showing you an unexpected dependency, unwanted cross-regional traffic, an abnormal drop in throughput, or some other unintended characteristic of your network topology, you can navigate to the Network Page and adjust the filters to display only flows you want to investigate.
You can then export graphs from the Network Page to a dashboard, copy timeseries graphs from Istio's out-of-the-box dashboard using the Datadog Clipboard, and create a new dashboard that visualizes network-level traffic metrics in context with application-level metrics from Istio's components. In this case, we can see that a brief decline in bytes received over the network correlates with a wave of xDS pushes. With this knowledge in hand, we can better plan our configuration changes so we don't sacrifice service availability.

Set alerts for automatic monitoring
When running a complex distributed system, it's impossible to watch every host, pod, and container for possible issues. You'll want some way to automatically get notified when something goes wrong in your Istio mesh. Datadog allows you to set alerts on any kind of data it collects, including metrics, logs, and request traces.
In this example, we're creating an alert that will notify us whenever requests to the productpage service in Istio's "Bookinfo" sample application take place at an unusual frequency, using APM data and Datadog's anomaly detection algorithm.
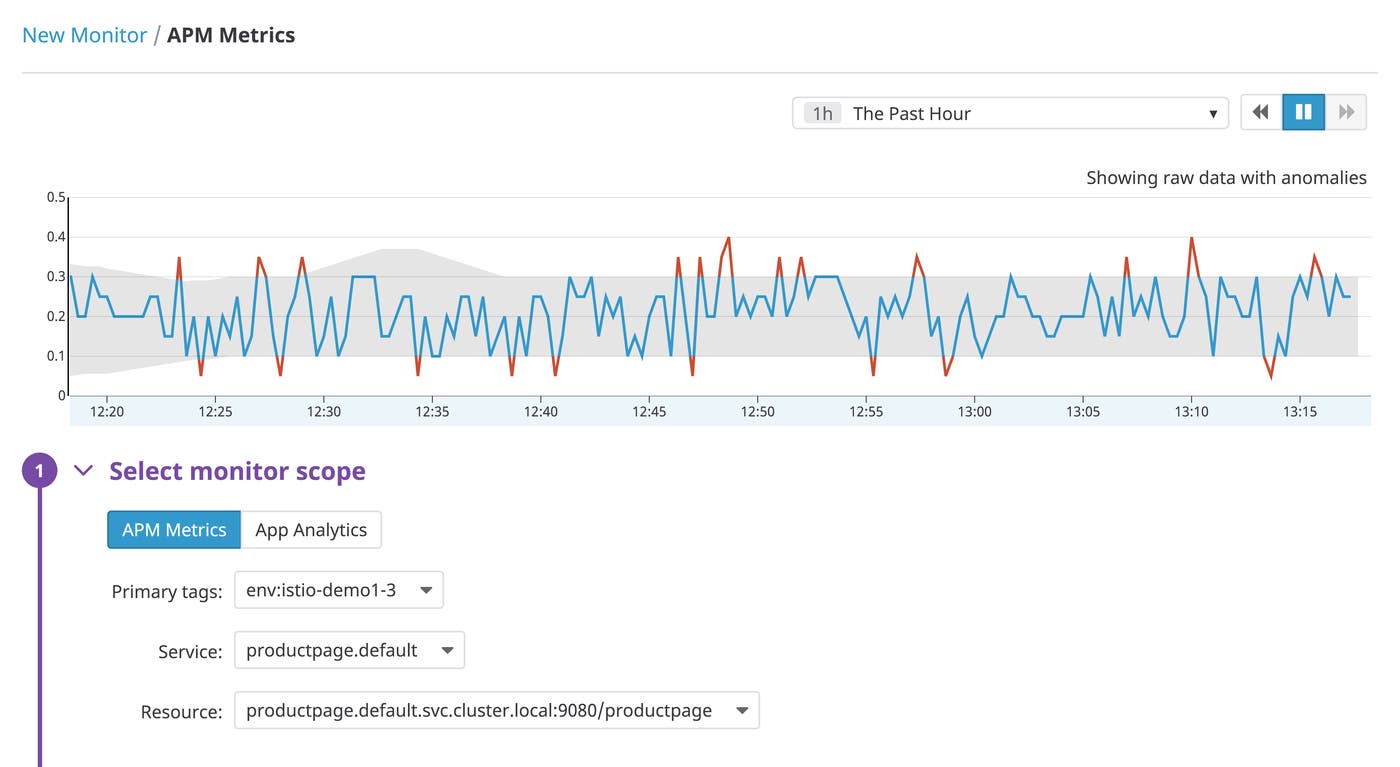
You can also get automated insights into aberrant trends with Datadog's Watchdog feature, which automatically flags performance anomalies in your dynamic service mesh. With Watchdog, you can easily detect issues like heavy request traffic, service outages, or spikes in demand, without setting up any alerts. Watchdog searches your APM-based metrics (request rates, request latencies, and error rates) for possible issues, and presents these to you as a feed when you first log in.
A view of your mesh at every scale
In this post, we’ve shown you how to use Datadog to get comprehensive visibility into metrics, traces, and logs from throughout your Istio mesh. Integrated views allow you to navigate easily between data sources, troubleshoot issues, and manage the complexity that comes with running a service mesh. If you’re not already using Datadog, you can sign up for a free trial.

