Stephanie Niu

Paul Gottschling
After you have stopped an incident from affecting your customers, you need a more thorough investigation in order to prevent similar incidents in the future. Postmortems record the root causes of an incident and provide insights for making your systems more resilient. At the same time, postmortems can be difficult to produce, since they require deeper analysis and coordination between teammates who are busy with the next development cycle.
But with the help of workflows that streamline your data collection, centralize your discussion, and generate interactive postmortem documents automatically, you can let your team spend less time on writing and more time on finding clues—and preventing future incidents.
In this post, we will explore best practices for writing postmortems as part of your organization’s incident management process, including:
- Gather data in a shared view
- Automate generation of postmortems from your shared view
- Use your postmortem as a thinking tool that helps you further your investigation
- Make your postmortems easy to find later by your team and others
We will also show you how Datadog builds these best practices into its comprehensive platform to make writing postmortems as seamless as possible.
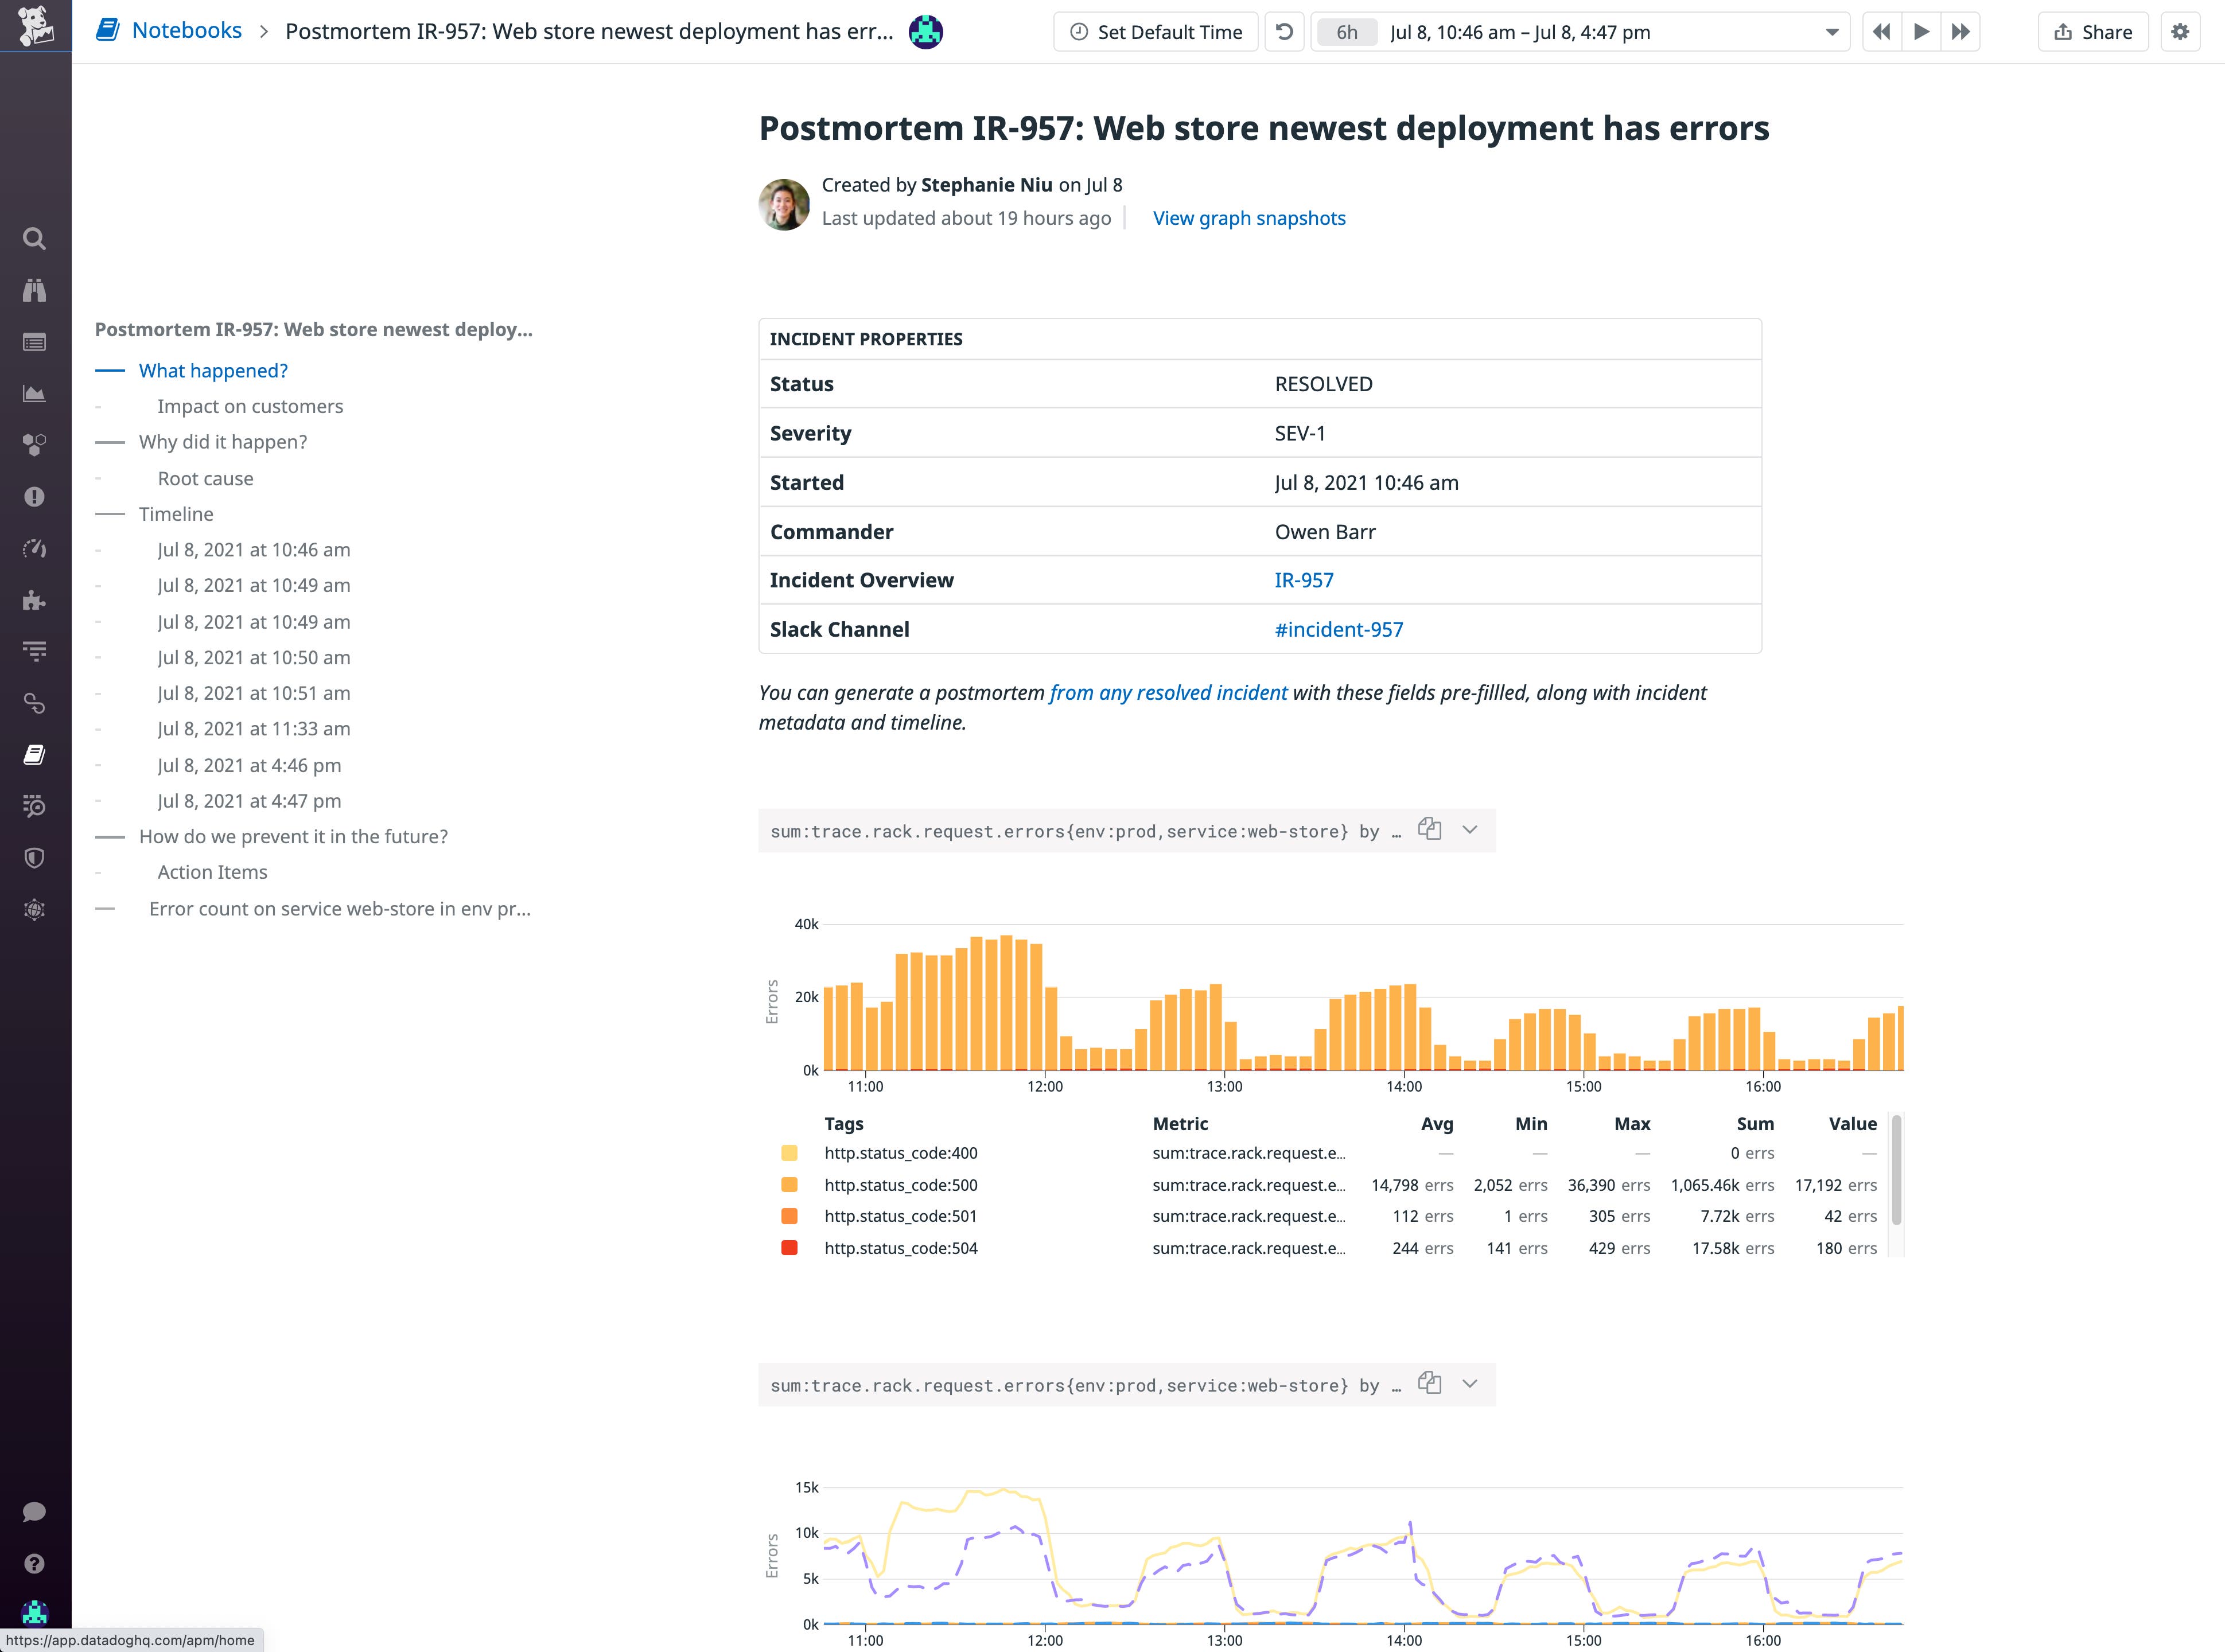
Throughout this post, we’ll use an example postmortem we wrote for a hypothetical incident where our web-store service returned an elevated rate of 500 (Internal Server Error) response codes to users for a six-hour period.
Centralize data as you go
To make coordination easier while writing a postmortem, all team members should gather data in a commonly accessible location—such as a document or message feed—as they investigate. Ideally, this shared view should be the same location they use when responding to the incident. By doing so, team members can then refer to that shared view rather than managing multiple lines of communication in order to stay up to date. It also becomes easier to convert the shared view into a postmortem document later on since you don’t have to collect information from multiple sources.
Investigators should be able to easily export graphs (and other visualizations) from their monitoring platform directly to the shared view with minimal clicks. It’s also useful to be able to export conversations from your organization’s core communication channels, such as Slack. This means that even if incident responders do coordinate outside the shared view, they can easily make their conversations available to other responders as well.
Finally, your shared view should include the ability for team members to leave comments. This way, the discussion about the incident can be visible alongside the data within the shared view. All incident responders can see everything the team has concluded so far about the incident as the discussion develops, making it easier to coordinate and come up with new analysis.
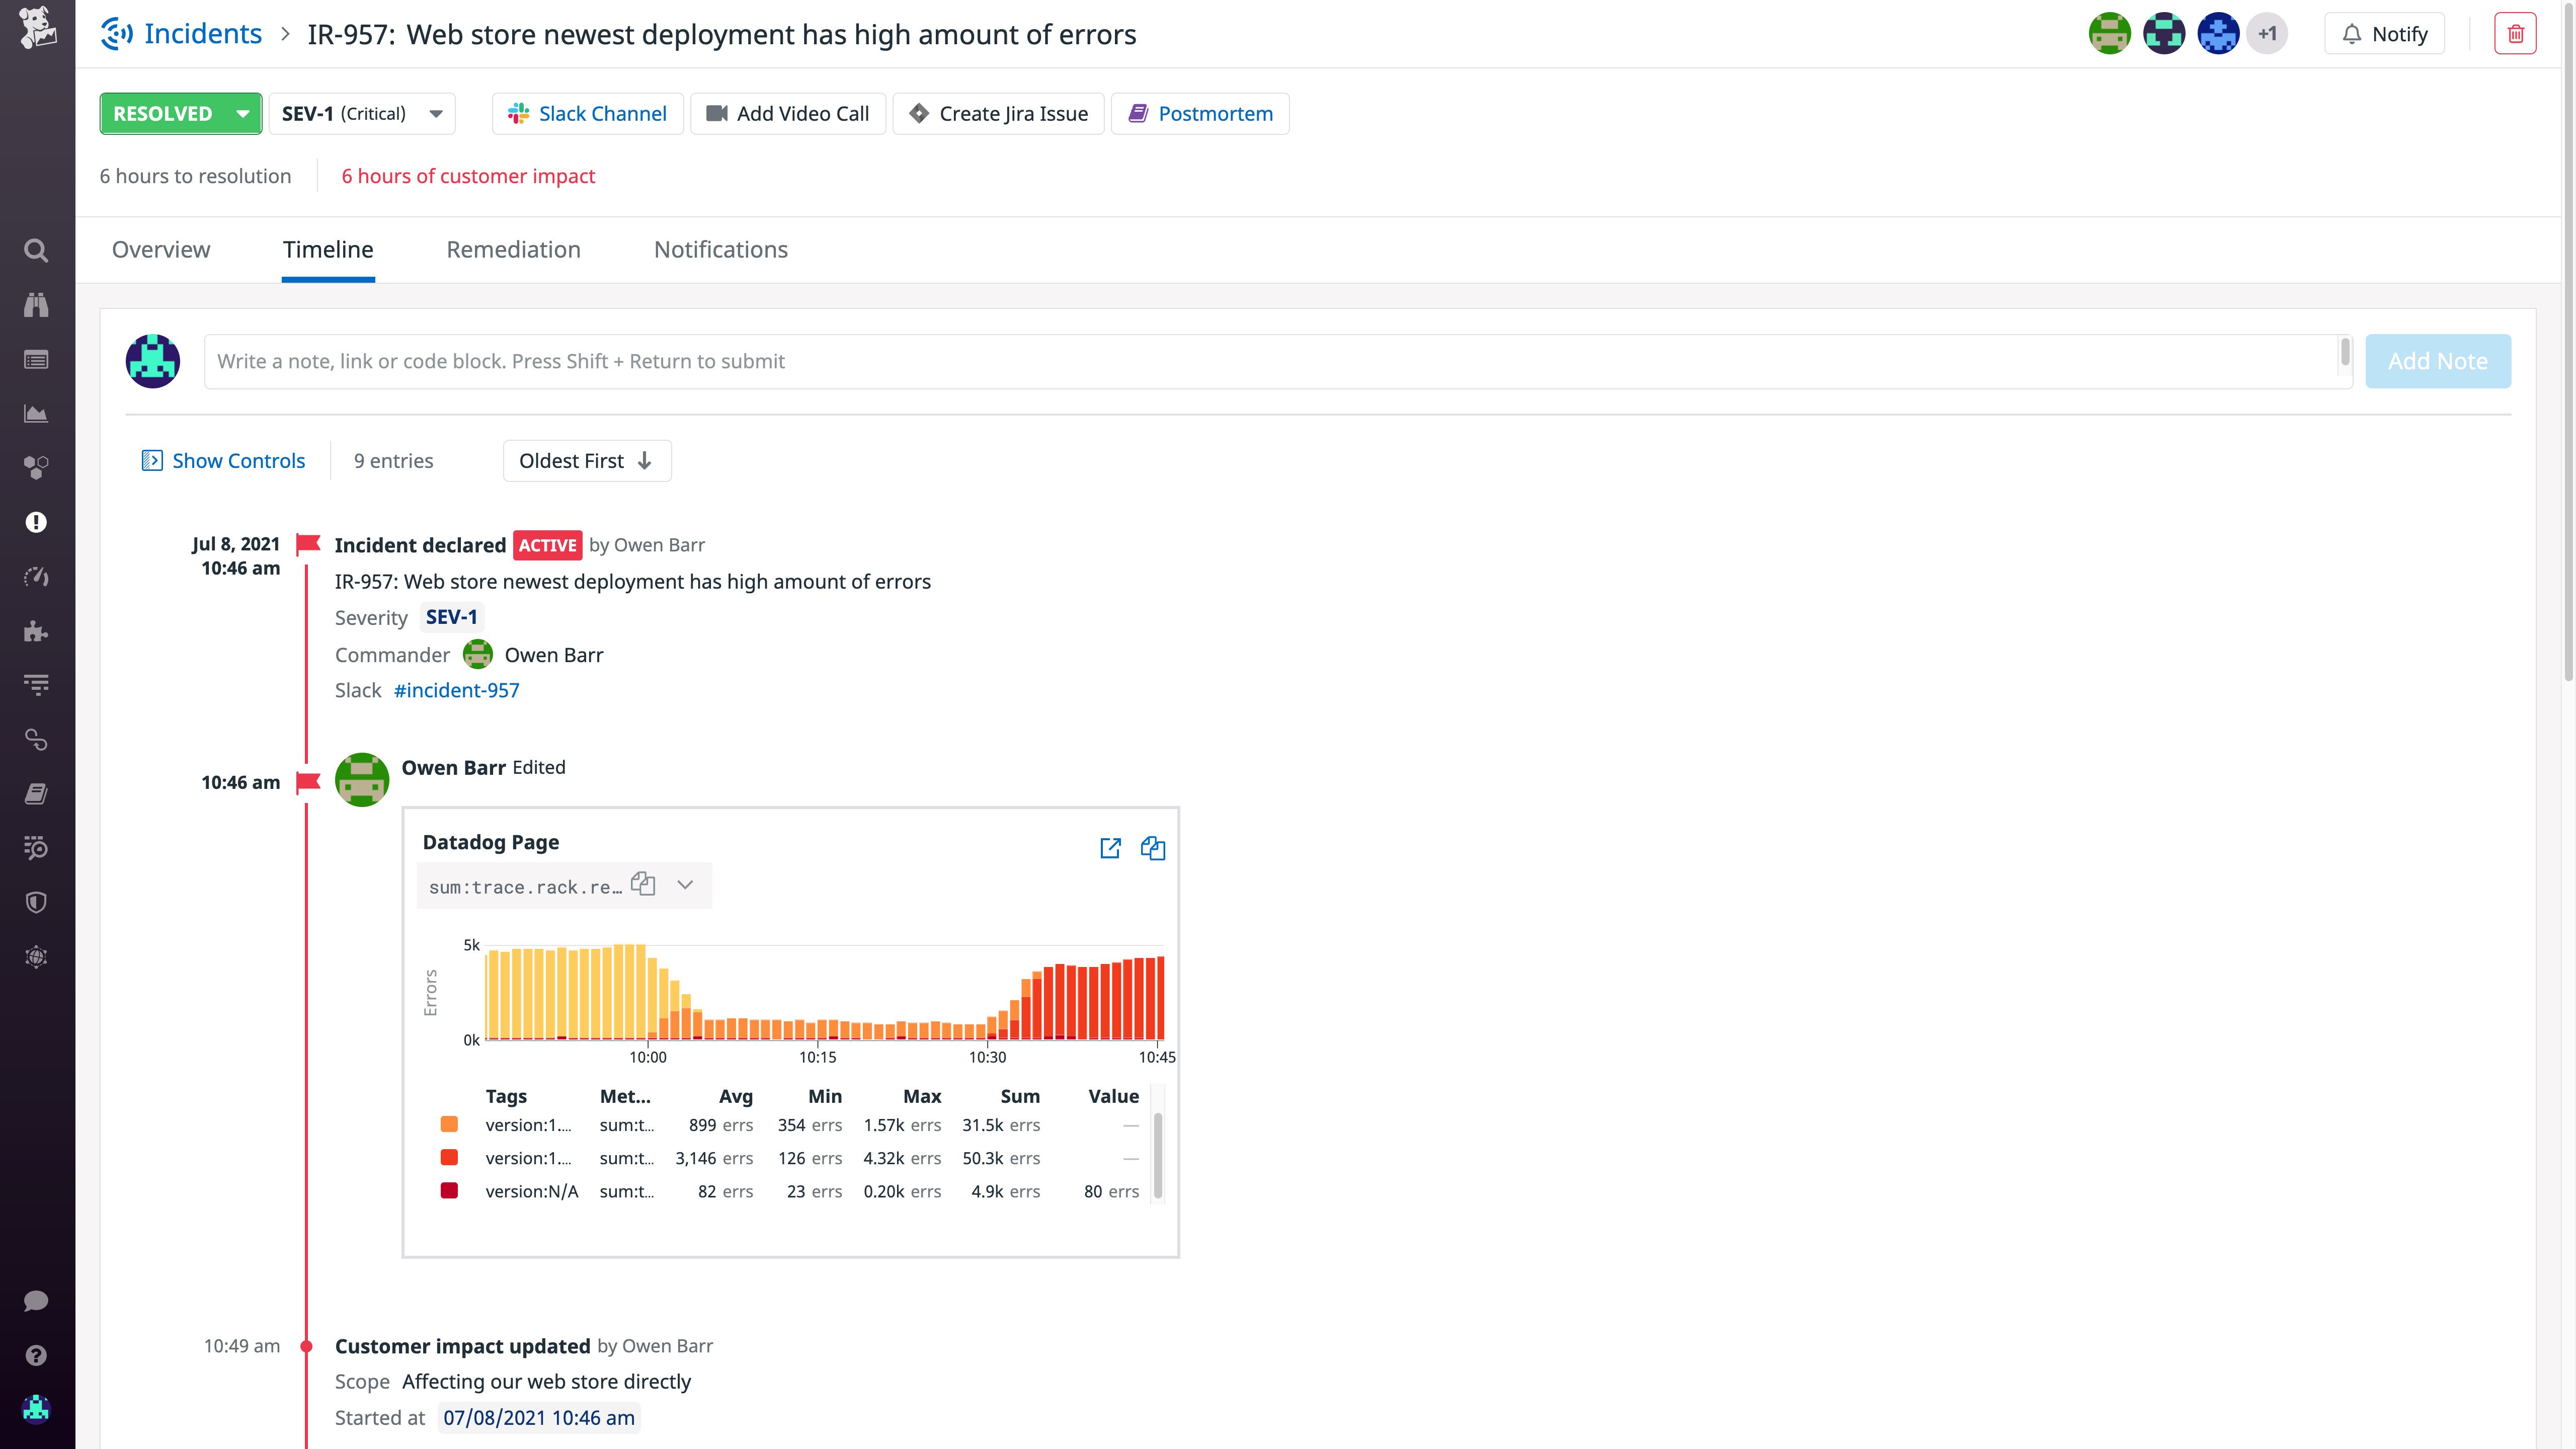
Once you declare an incident in Datadog, for example, you can export any data you gather to the incident timeline. And as you gather more information—such as graphs of additional relevant metrics or Slack messages that provide context—you can easily add it, making the timeline a shared view that anyone responding to the incident can review for the full status of the investigation. In the incident shown below, all responders can see the timeseries graph added at 10:46 a.m. to illustrate the issue, as well as the note marking when the customer impact was updated.
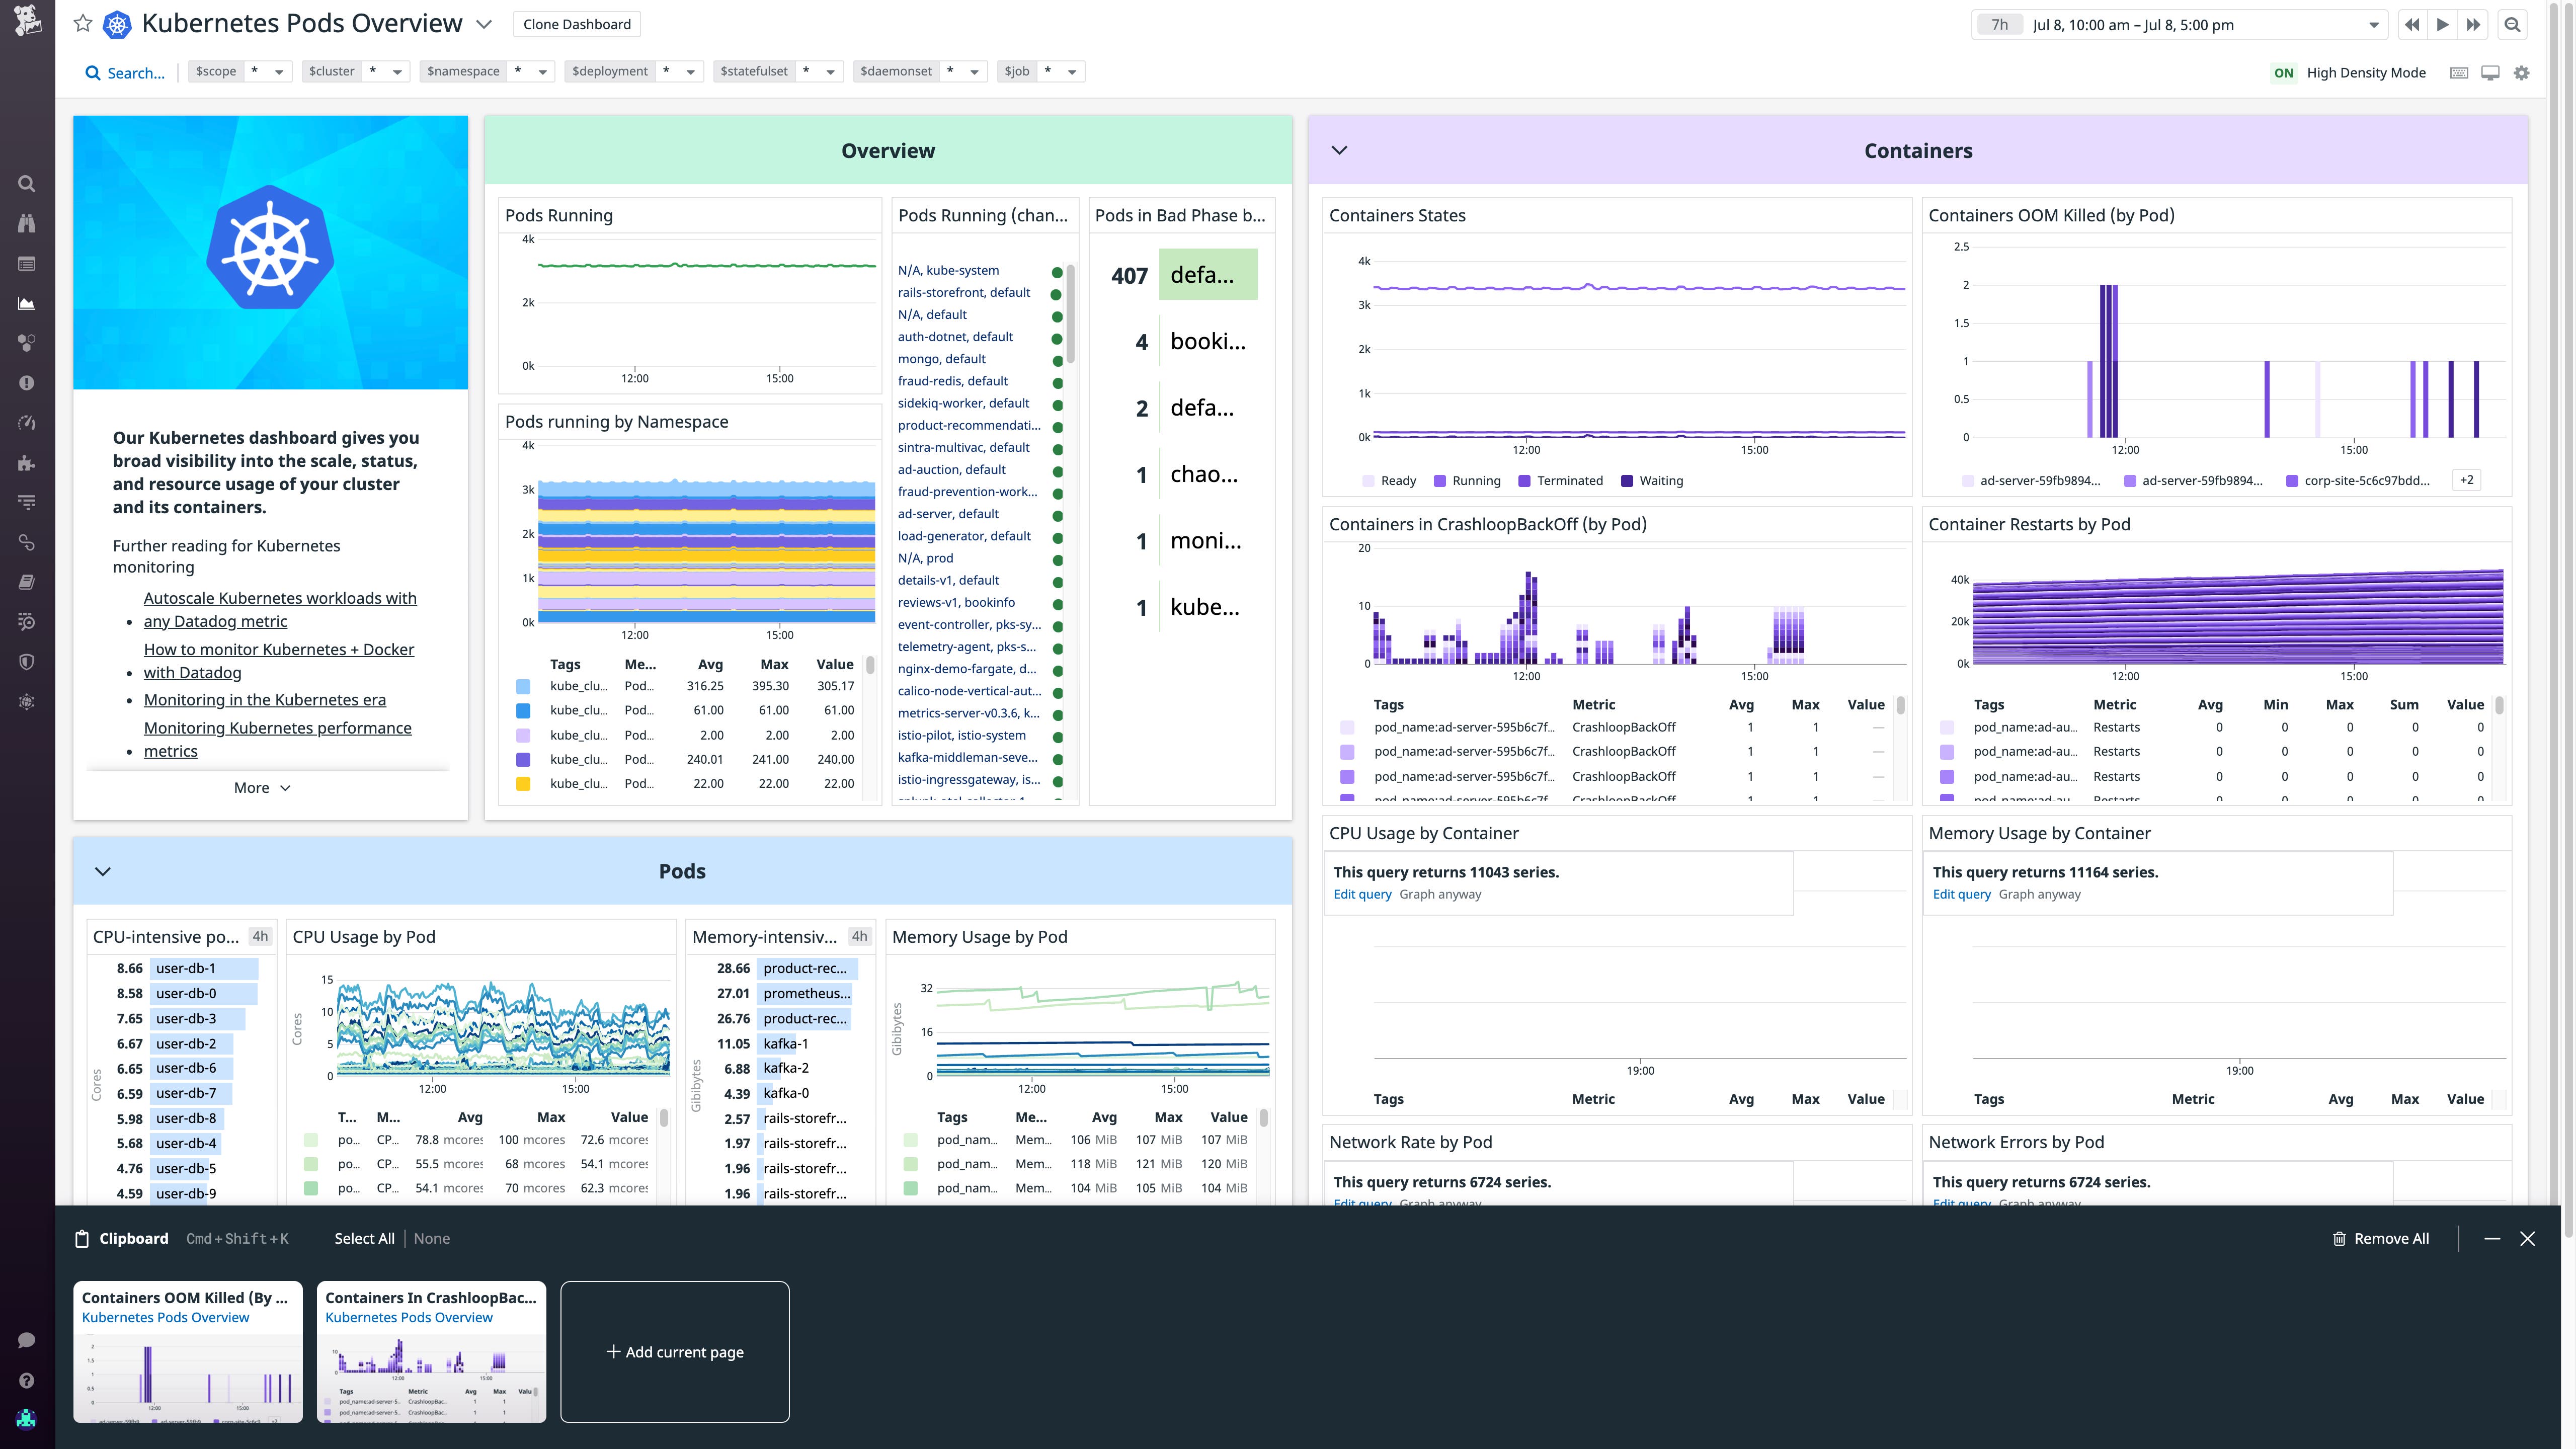
If you want to assess the data you collect before you add it to an incident timeline (i.e., to ensure that teammates only see useful information) you can store it temporarily in the Datadog Clipboard, then review the Clipboard later on to determine what to export. For example, let’s say we’ve noticed in the out-of-the-box Kubernetes Pods Overview dashboard that pods for the ad-server and product-recommendation services, which web-store depends on, displayed an elevated rate of CrashLoopBackOff statuses and OOM kills during the incident, particularly during the first two hours. We copied these graphs to the Clipboard so we can export the most revealing one to the incident timeline after a bit more investigation.
Generate your postmortem automatically
When it comes time to publish the information in your shared view as a polished document, you should automate the process as much as possible so investigators can focus on analysis and insights. You can accomplish this by creating templates, checklists, or guidelines that make it easy to start a postmortem. Automating postmortem generation lets your team focus on analysis and understanding rather than copying and pasting incident data, and ensures that no key details are left out. It’s also important to be able to edit your generated postmortems when investigators encounter new information.
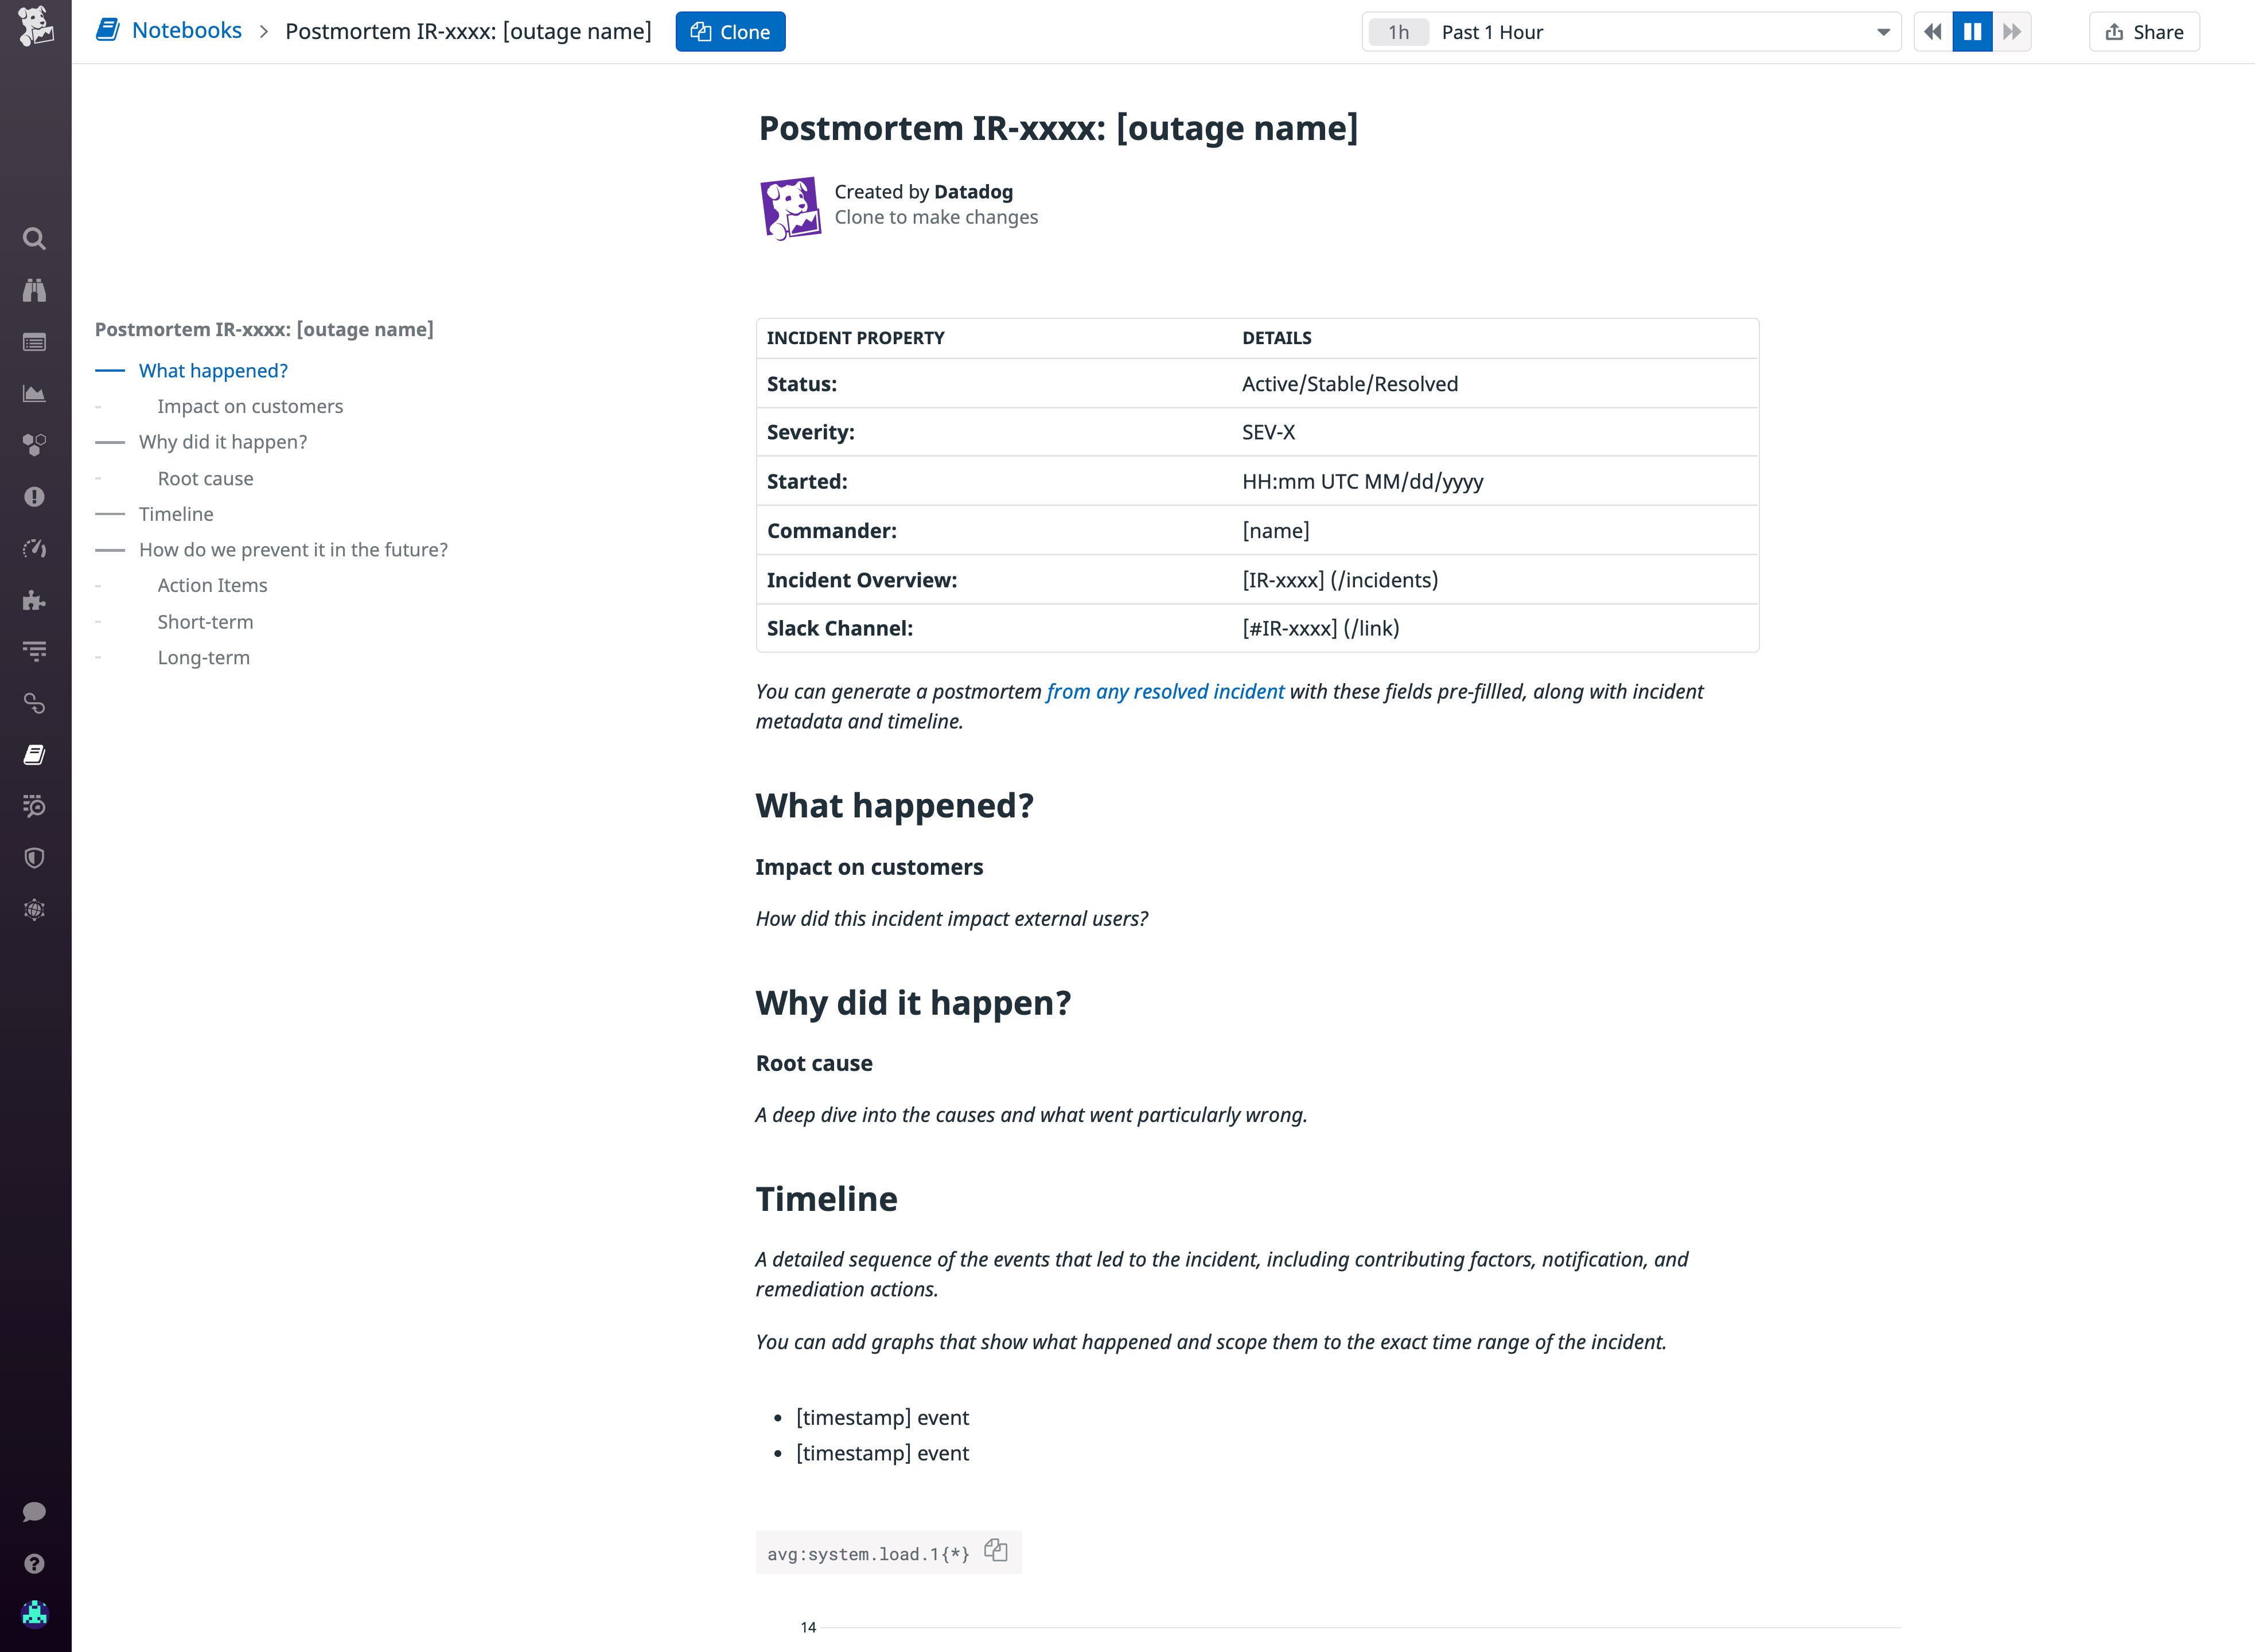
Datadog enables you to automatically generate a nearly-complete postmortem from incident metadata with just a few clicks. Your organization can create custom templates that match your current postmortem structure, ensuring that any postmortem you generate contains the right data before you need to start investigating an incident. Templates automatically populate with events from the incident timeline, including live graphs and key details like the causes and customer impact.
Use your postmortem as a thinking tool
After you generate your postmortem, the document should enable responders to get even more insight about the incident. In other words, postmortems need to be living documents that enable readers to have conversations, get additional context, and refine their root-cause analysis. You can achieve this by allowing team members to comment on the postmortem, making it easier to add data and analysis. You can also enable incident responders to access real-time data in the postmortem so they can reach even deeper insights.
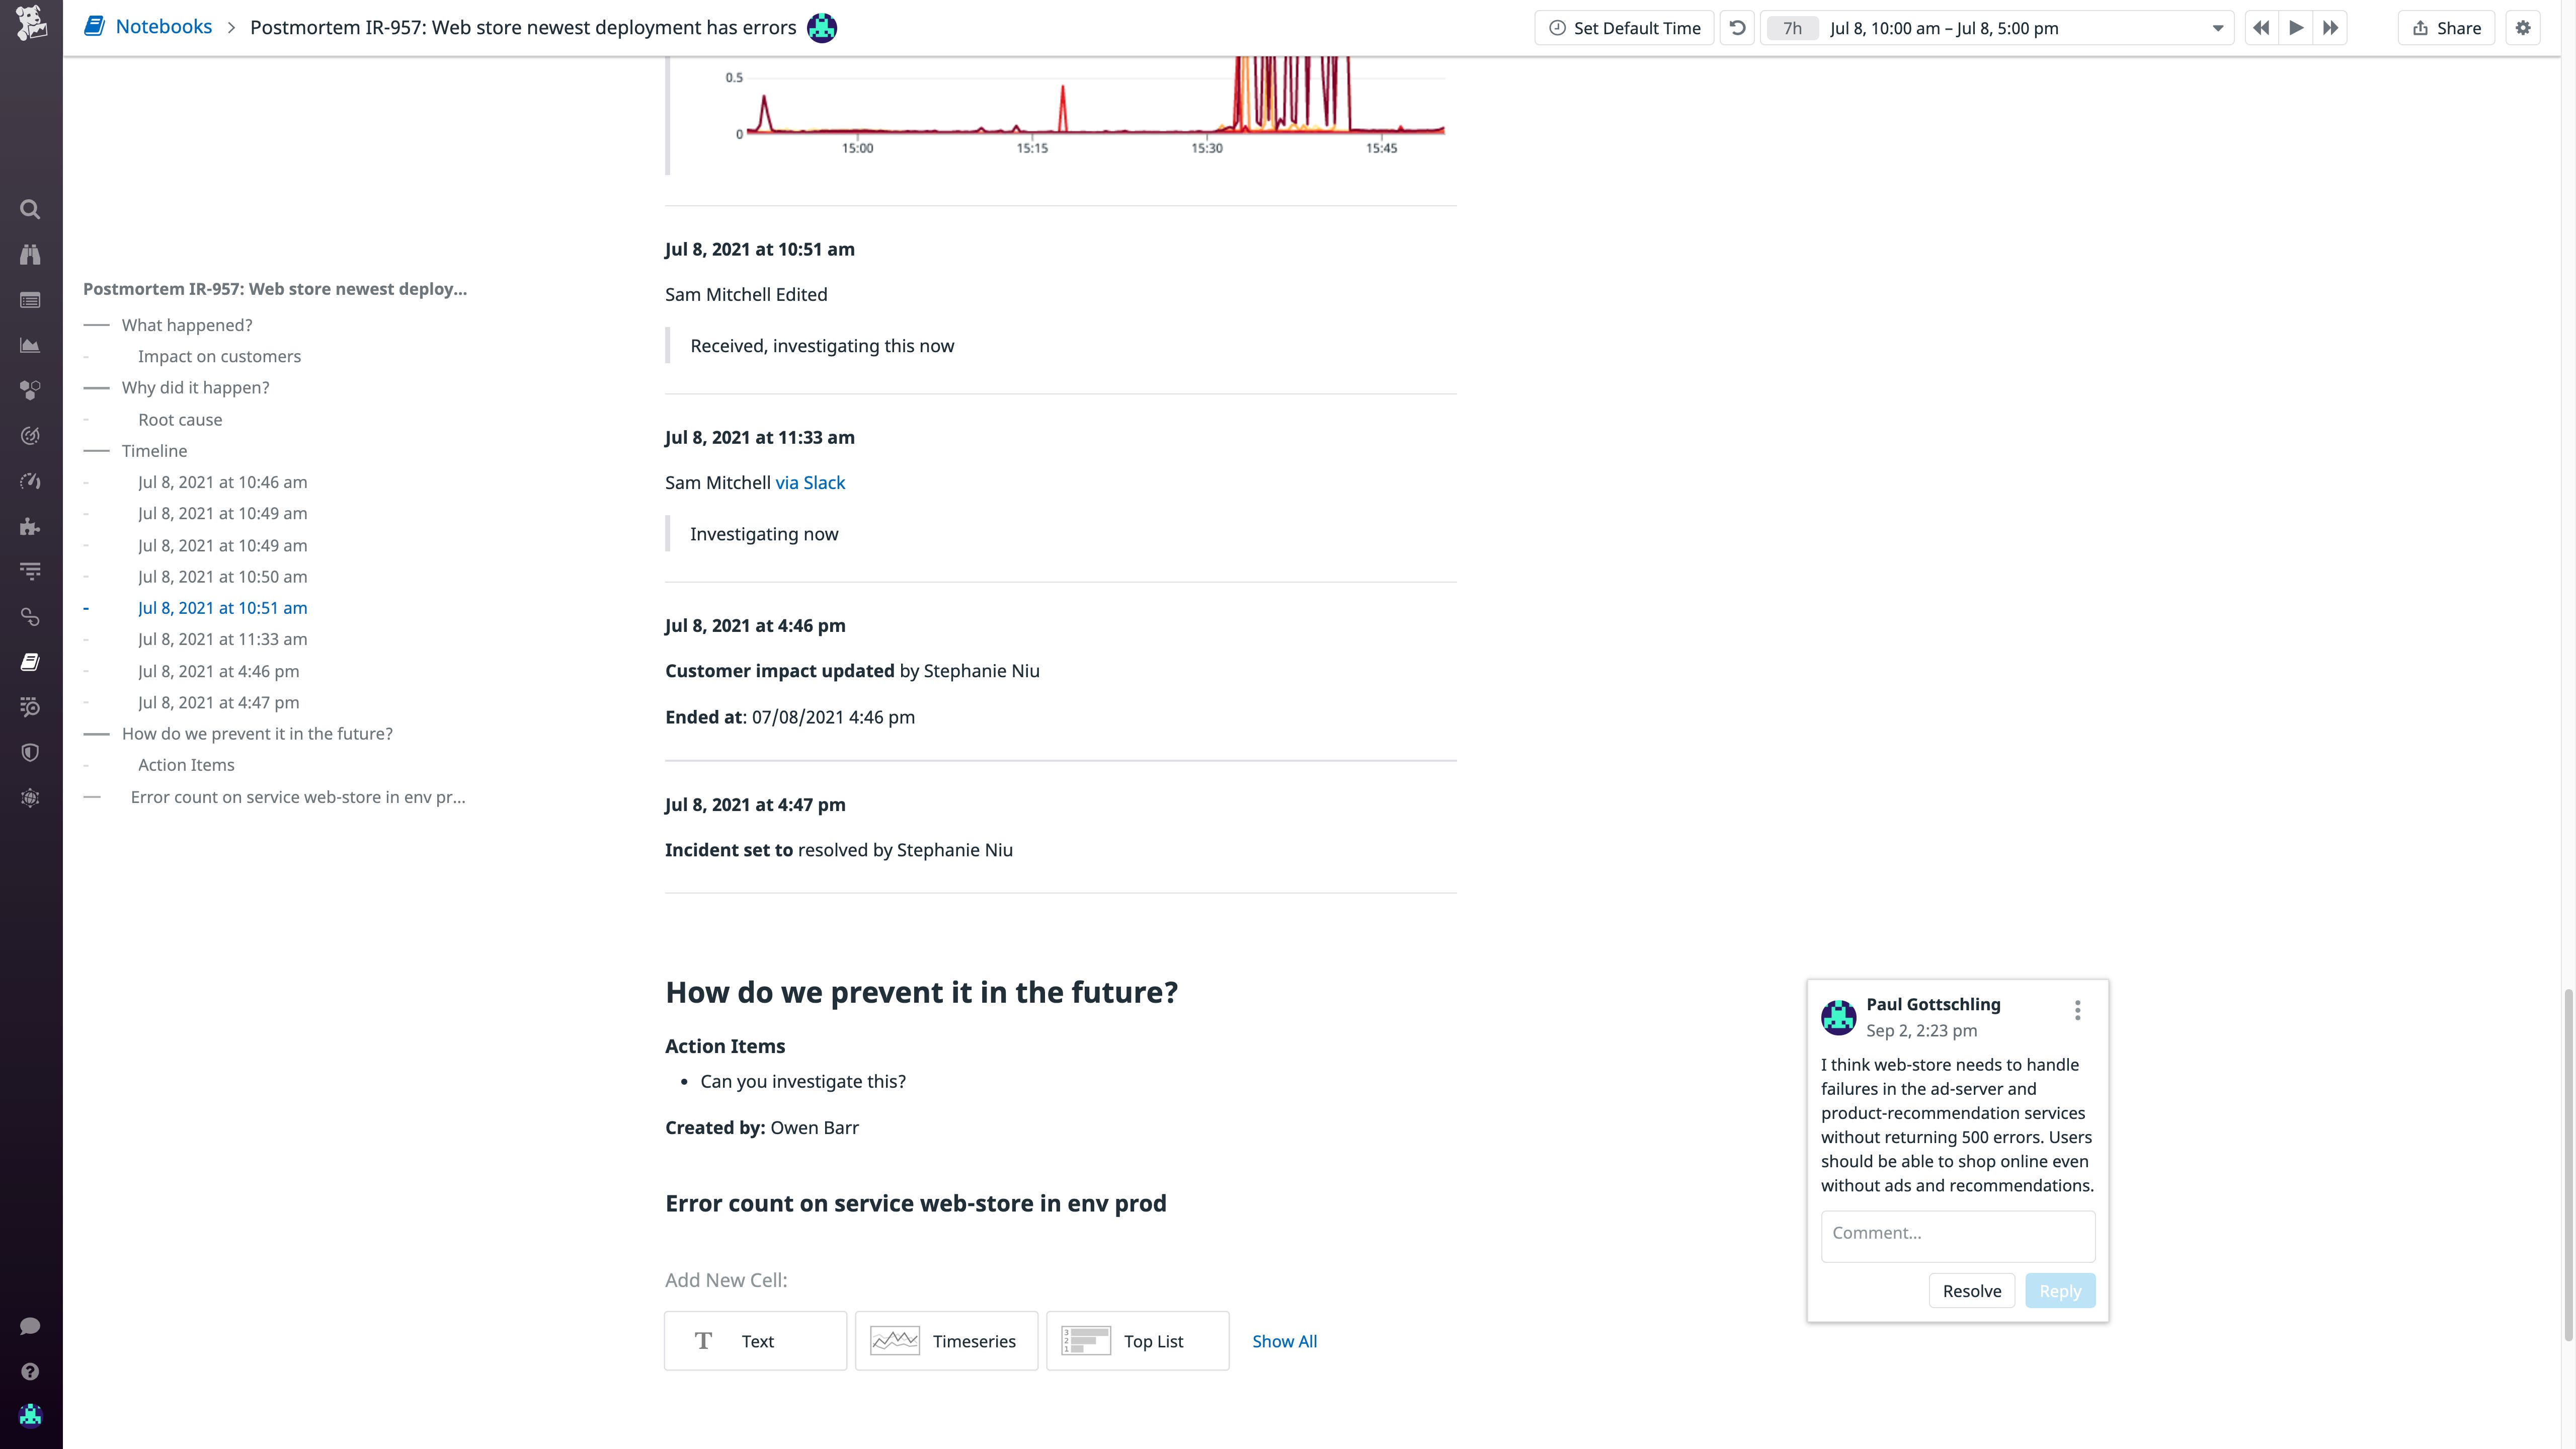
For example, Datadog’s collaborative Notebooks are fully editable and enable you to leave comments so your team can continue to assess the data and gather information even after you have generated your postmortem. In the example below, one investigator uses the earlier insights that product-recommendation and ad-server pods were crashing during the incident to suggest a way to prevent similar incidents in the future.
Your postmortem should also include (or at least link to) live graphs. Static graphs tie the parameters of a graph—the timeframe, metrics, filters, and aggregation groups—to a specific point in the investigation. With live graphs, on the other hand, responders can modify these parameters so they can draw more information out of a single graph, helping them challenge their assumptions, get more context, and investigate further.
In Datadog, graphs within Notebooks (including postmortems) are live, meaning that you can expand them to view the graphing editor and adjust the timeframe, tags, and other parameters within your metric query. This makes it easier to reveal new dimensions of the graph, such as a previously unforeseen outlier or a broader timeframe that casts new light on a trend.
For example, by zooming out within one graph in our postmortem, we noticed that error rates had been elevated for at least a week prior to the incident’s recorded start time, even though we had not received support tickets from users. We can then add the zoomed-out graph to our postmortem so readers can have a full view of the data, revise our postmortem to be more accurate, and change the scope of our investigation.
Make it easy to find later
It’s important to ensure that the findings included in your postmortems are easy to locate to help team members who may be investigating future incidents or writing a runbook down the road. If readers are searching for postmortems related to a specific service, they should be able to discover yours even if they do not know the ID of the incident you responded to.
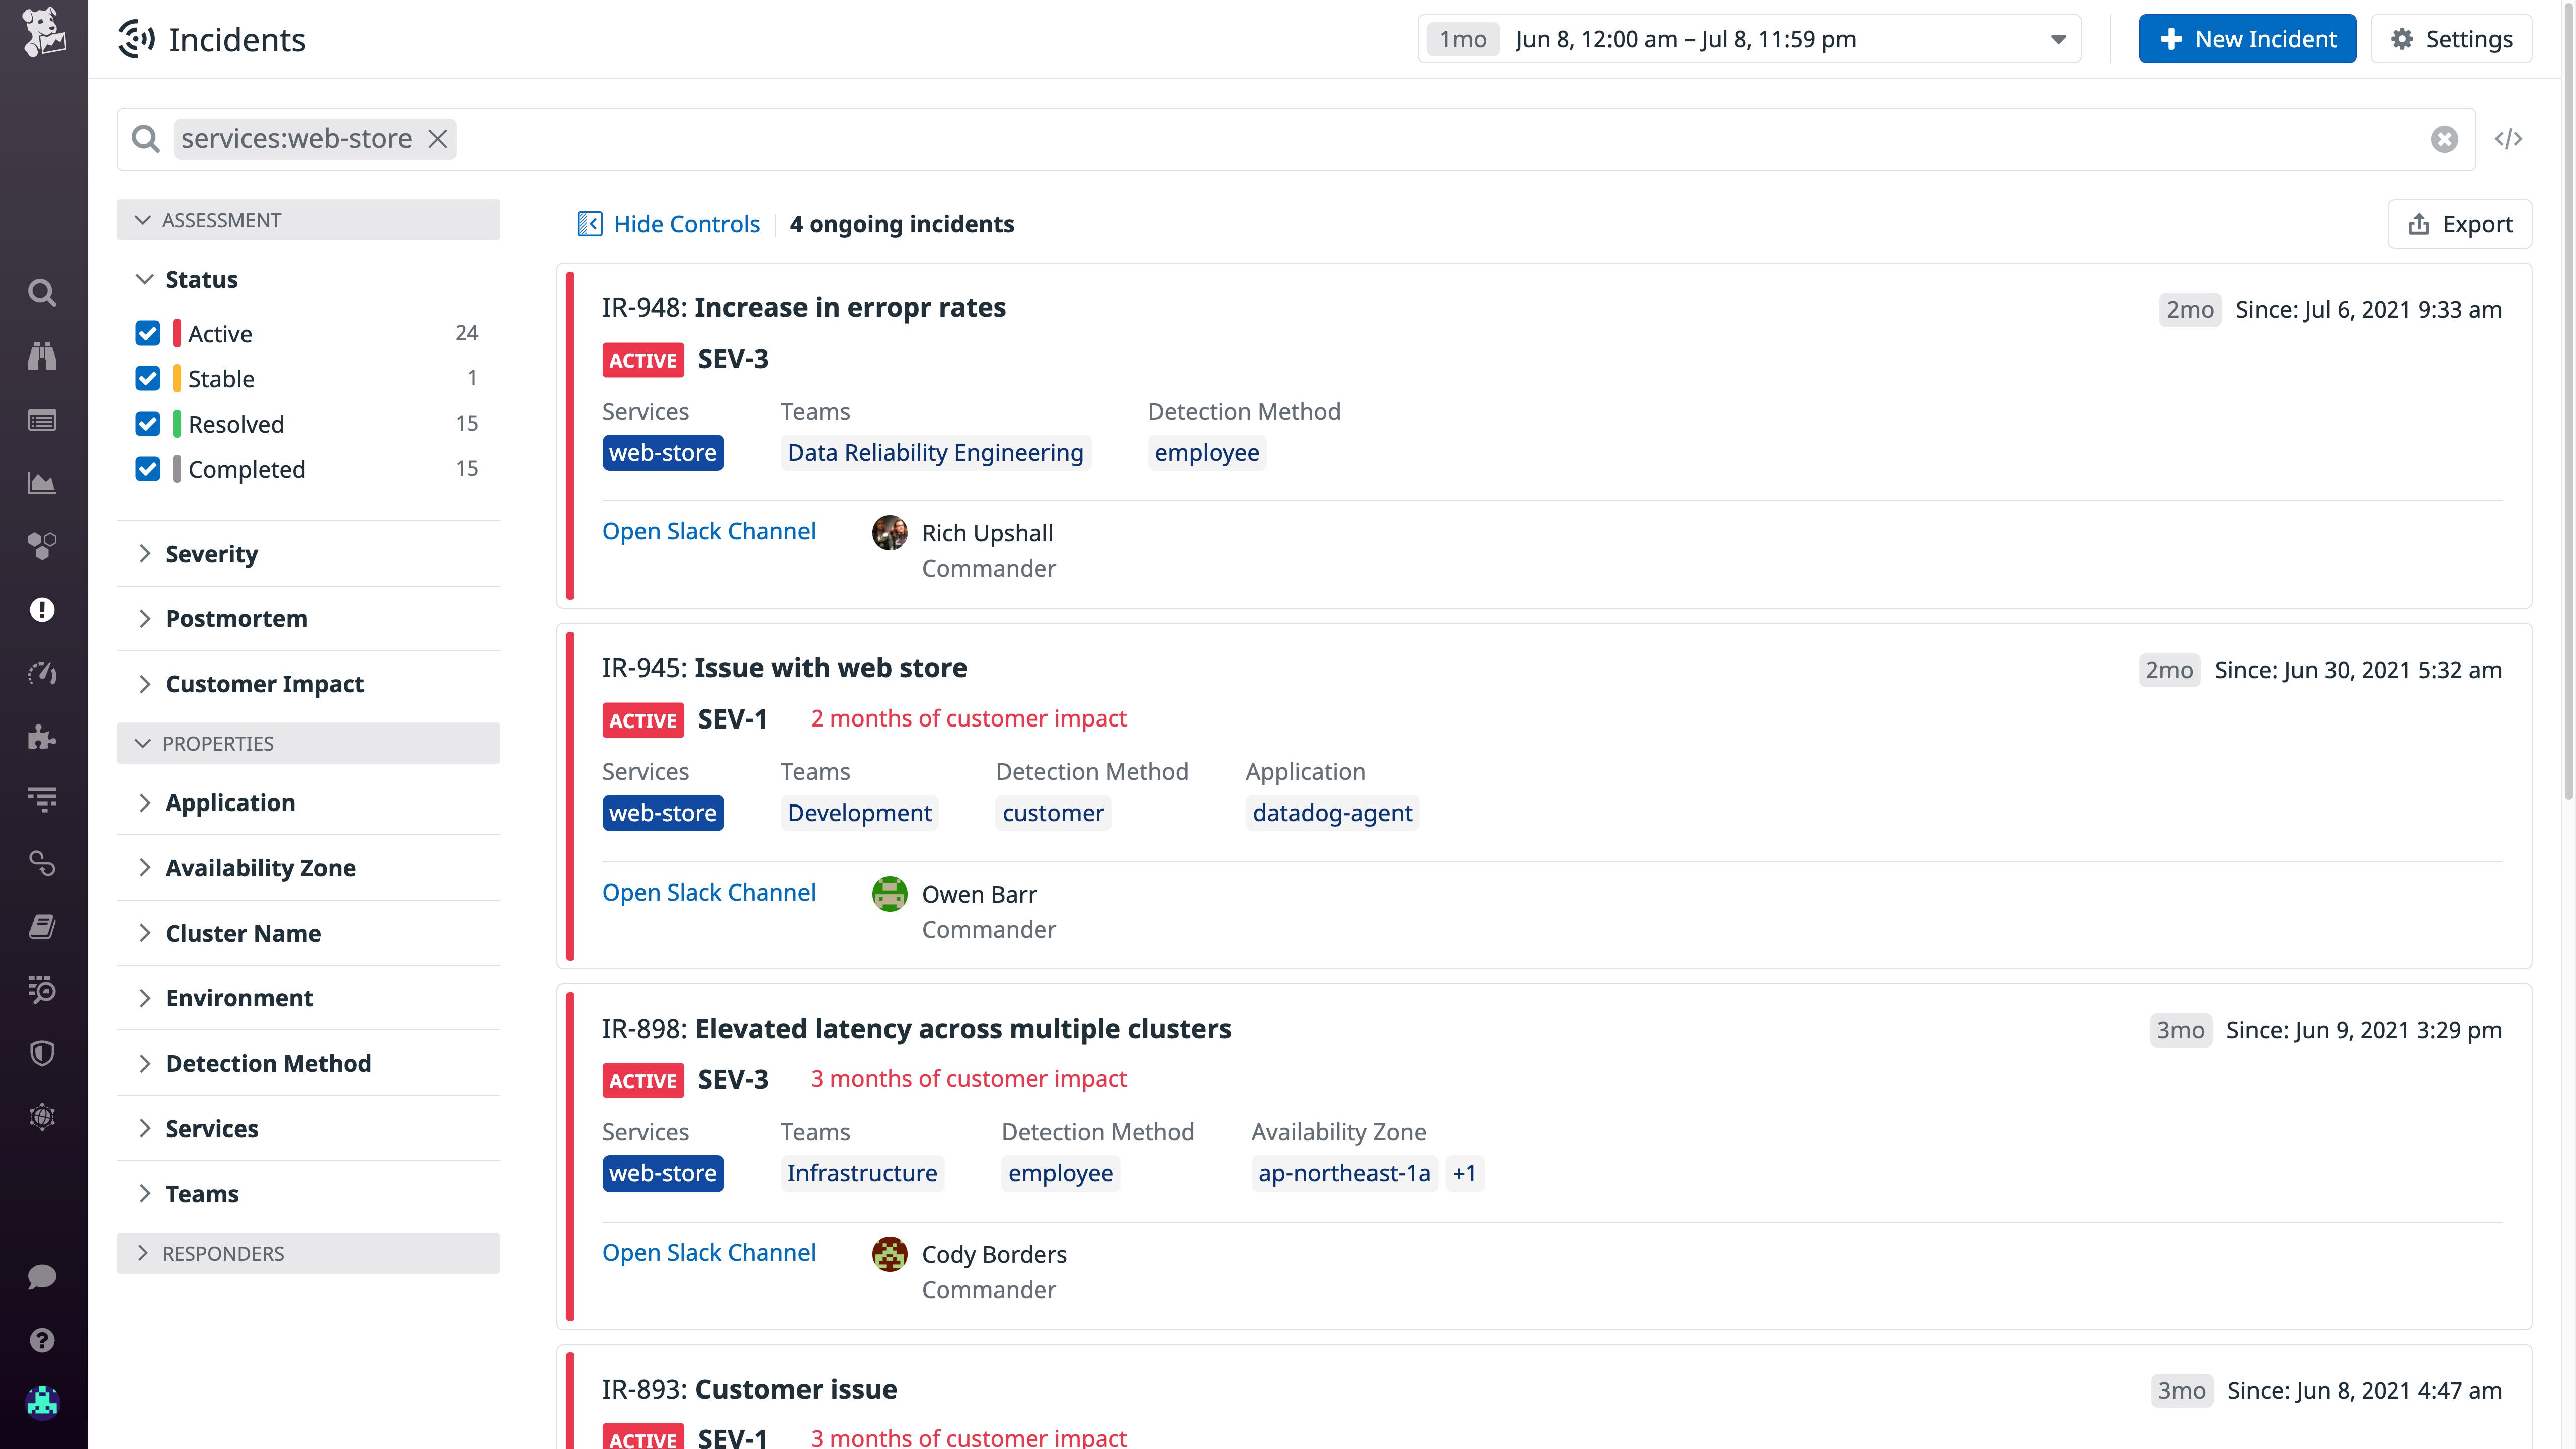
You should include descriptive tags and titles with your incidents and postmortems to make searching easier. Organizing by incident ID or date isn’t enough, for example, if you’re interested in the possible failure modes of a single service. But if you tag your postmortems with their relevant service name as well, it becomes easier to find the ones you need. Datadog enables you to find incidents in the Incidents page by service, availability zone, and other Datadog tags. In this case, for example, we are searching for all incidents related to the web-store service during the month prior to the one we’re investigating, so we can find a related investigation that we can use as a guide to which data we should explore first.
If your organization stores postmortems as static files, Datadog enables you to easily export a postmortem as a PDF, Markdown document, or formatted text so you can store it with your organization’s preferred method (e.g., adding it to a directory). And if you need to edit a postmortem you have already exported, Datadog Notebooks retain a snapshot of incident-related graphs so you can export your postmortem again even after the data retention period has passed.
Faster postmortems with Datadog
In this post, we have seen how Datadog speeds up the process of writing postmortems so you can focus on building more resilient systems, rather than compiling data and coordinating with teammates.
Aside from writing postmortems, Datadog Incident Management gives you the visibility you need for every stage of the incident response process, from investigation to mitigation and prevention. Alerts let you get notified about possible incidents through integrations with technologies like PagerDuty—then declare an incident with data from the alert. You can then speed up your troubleshooting with Watchdog Insights and Watchdog RCA, and contribute to the investigation on mobile.
If you haven’t tried Datadog yet and want to start streamlining your postmortems today, you can get started with a free trial.


