Paul Gottschling
Datadog Technical Content Writer

Pierre Cariou
If you're investigating an incident, every minute means degraded performance or even downtime for customers. The causes of an issue often come from parts of your systems and applications that you would not think to check, and the sooner you can bring these to light, the better.
Watchdog Insights is a recommendation engine that augments your investigations by drawing attention to parts of your systems and applications that display an outsize proportion of warning signs. While Watchdog stories uncover anomalies and provide root cause analysis on the front page of Datadog, Watchdog Insights fits into your existing workflows to make your investigations faster. For example, Watchdog Insights surfaces error and latency outliers within request traces to help you diagnose code-level issues more quickly.
Watchdog Insights can now give you more clarity with less effort by automatically analyzing your logs to uncover noteworthy trends that you may otherwise have missed. This allows you to conduct your investigations more efficiently, even if they involve unfamiliar parts of your system such as those managed by other teams. As a result, Watchdog Insights helps small teams feel like they have the resources of a big team, and big teams communicate with the efficiency of a small team.
In the Log Explorer, you can see which log fields are associated with a particularly high percentage of errors relative to all the logs in your search query. For example, if logs tagged with service:my-service represent 53 percent of errors in your search results, but only 3 percent of the logs, it is likely that this service isn't performing as intended and should be investigated further.
A nudge in the right direction
Whether you're a seasoned incident commander or have just joined an on-call rotation, Watchdog Insights can help you easily get to the heart of complex issues involving logs from your applications, web servers, and infrastructure—along with any other logs you collect.
Find suspect dependencies
Your applications often need to interact with a bramble of dependencies—such as databases, caches, internal DNS servers, and upstream web services—often while handling a single HTTP request. It can be difficult to make sense of these interactions while sorting through thousands of application logs.
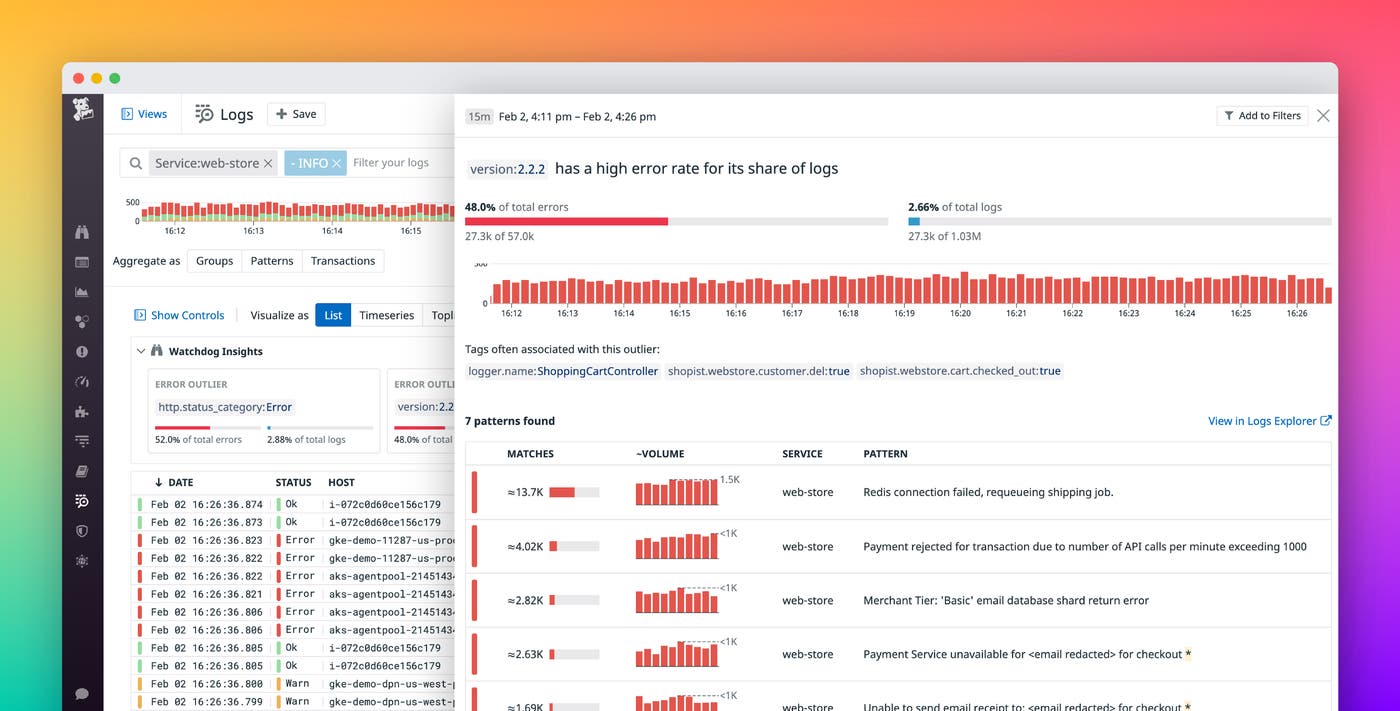
Datadog automatically highlights outliers in your application logs so you can spot dependencies that deserve a closer look. In the example below, we are investigating our web-store service after receiving a series of alert notifications. After we enter our search query (service:web-store) in the Log Explorer, the Watchdog Insights summary panel shows us a list of fields that include an especially large share of error logs.
We see that Watchdog Insights has flagged the shopist.webstore.merchant.tier:enterprise field, which immediately leads us toward an answer. We recently added a caching layer to accommodate our expanding enterprise-tier user base, and we suspect that this has a role in the incident. Using the Watchdog Insights side panel, we refine our search query to focus on logs for enterprise-tier customers. From there, we only need to visualize the resulting logs as transactions to realize that the web-store service was facing errors while connecting to both the caching layer (Redis) and the storage layer (MongoDB). Despite a complex set of dependencies, Watchdog Insights indicated exactly where to look.
Get clarity from your access logs
Access logs are critical to understanding issues with your web services. But access log fields can have an intimidatingly high cardinality, leaving you to sort through countless permutations of source IP address, user agent, URL path, and so on. Watchdog Insights helps you determine which users are encountering problems so you can focus your investigations.
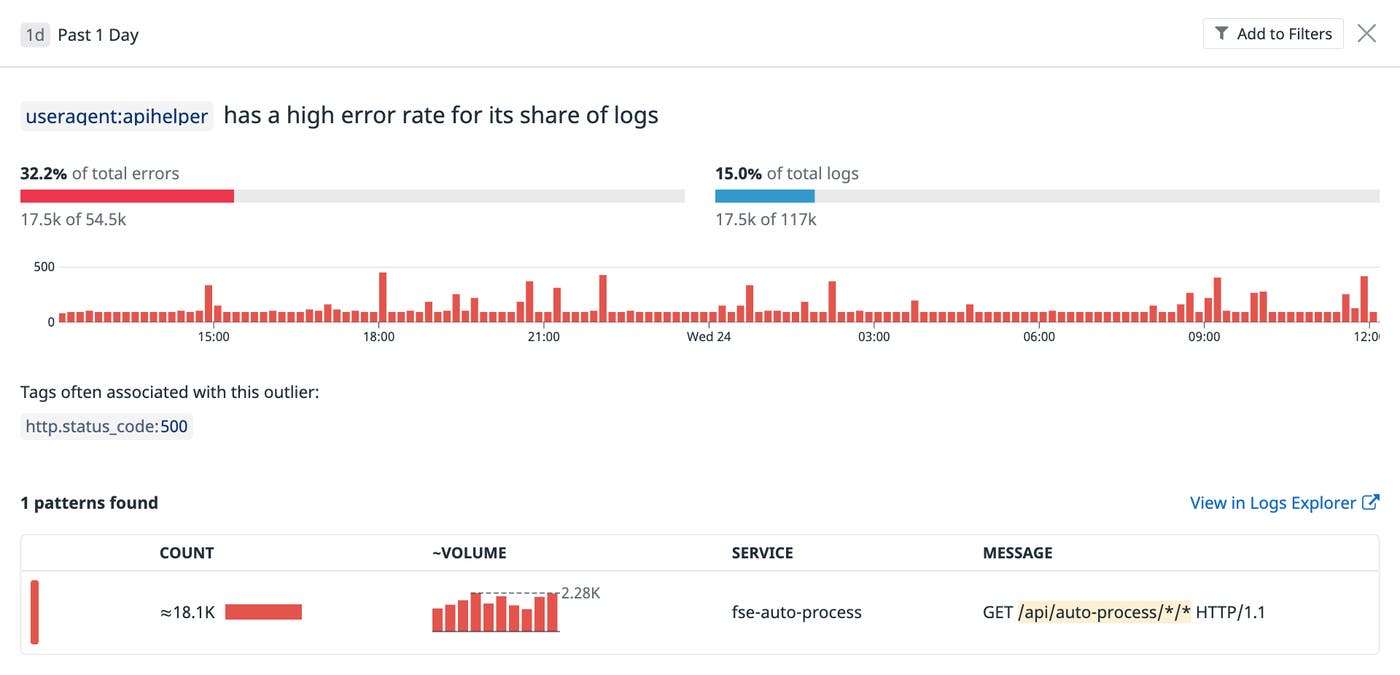
In this example, we are responding to APM monitor notifications of high error rates for requests to our web application. When we investigate the NGINX logs in the Log Explorer, Watchdog Insights highlights an unusual number of error logs from a particular user agent: a popular client library for our API. Watchdog Insights also indicates that these errors take place for a particular URL path pattern, /api/auto-process/*/*, an API endpoint that we had recently deprecated. We now know that the client library's API calls are behind the issue, and that we should submit a patch to the client library while better handling requests to the deprecated endpoint.

Get context around infrastructure errors
Since your infrastructure often handles many client connections at once, it can be hard to work backwards from an error message to the interactions that caused it. Watchdog Insights gives you the context you need to investigate infrastructure issues by identifying log fields that are commonly associated with error messages.
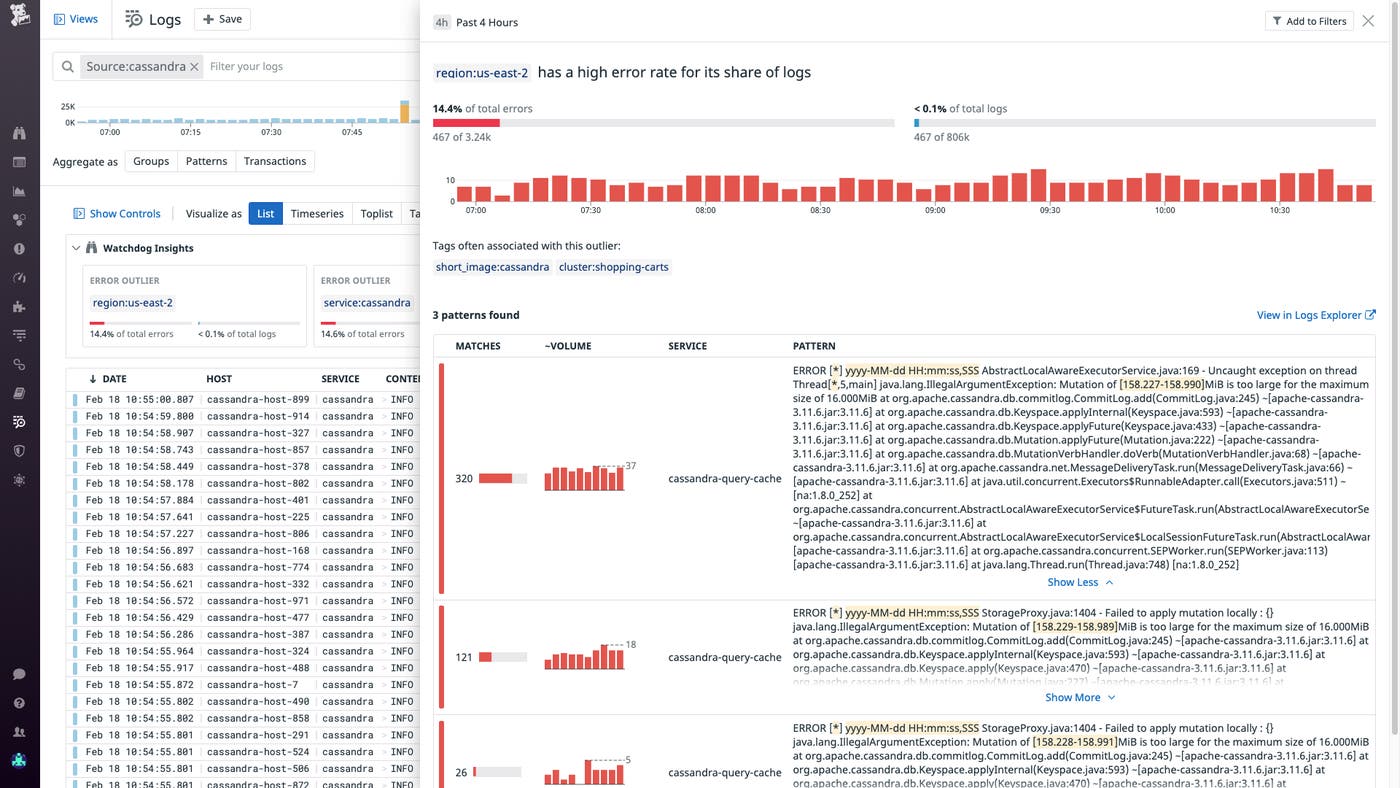
In the example below, we are investigating anomaly monitor notifications for abnormally low write throughput in our Cassandra deployment. When we search for Cassandra logs (source:cassandra), the Watchdog Insights summary box shows us that a high proportion of errors took place in the us-east-2 region. After we click on the outlier, we see that Cassandra instances in this region are throwing exceptions based on the sizes of commit log mutations, pointing to a misconfiguration.
Since the error was primarily detected in the us-east-2 region, we have a much clearer idea of what caused the issue. Our Cassandra instances fetch a region-specific configuration from a data store on launch. We now know that we should check the configuration used by the affected instances before we consider other possible causes.

Try Datadog Watchdog Insights now
Watchdog Insights speeds up your investigation workflows by surfacing parts of your systems and applications that you may not think to consider while exploring data such as traces and logs—with support for additional kinds of data in the works. Watchdog Insights and Watchdog Stories complement a suite of features that automatically provide clues to help speed up your investigations, such as anomaly detection and Metric Correlations. If you're not already a Datadog customer, you can sign up for a free trial.

