


Paul Gottschling
When your applications raise errors, you need a way to make sense of them so you can set priorities, start troubleshooting, and gauge the success of your efforts. Errors can appear within the thousands of browser sessions and backend hosts running your software, making it difficult to find meaning within the noise. We are pleased to announce that Datadog Error Tracking is now generally available for frontend JavaScript as well as Android applications and all of the languages that Datadog supports with distributed tracing and APM.
Error Tracking enables you to reason about errors at a higher level—and investigate more effectively—by automatically grouping application errors into issues. By tracking issues alongside individual error events, you can get the context you need for root cause analysis—and reduce your mean time to resolution. Error Tracking builds on the data you’re already monitoring with Datadog, so you can start using it with no additional setup.
From errors to issues
When Datadog first receives an error event from Real User Monitoring (RUM) or APM, it creates a new issue. It then uses the issue to group subsequent errors that have similar messages and stack traces. Condensing errors into a single issue helps you triage tasks, summarize problems for colleagues, and otherwise maintain a clearer understanding of the work ahead of you. Error Tracking can also apply metadata to an issue, such as when its errors occurred, giving you more context than if you were to investigate the errors separately. Datadog can also notify your team whenever it identifies a new issue, giving you confidence that your triage plans are up to date.
Error Tracking extracts error messages from RUM and APM data, so there’s no need to configure an SDK or modify your application code.
Know what to fix first—and how to fix it
Error Tracking enables you to get more context around any issue for smarter triaging and faster investigations. The Error Tracking Explorer view shows a list of issues that Datadog has detected, along with important aggregates like each issue’s total error count and frequency over time.
When you suspect that application errors are impacting downstream services or end users—for instance, you see a decline in certain user actions in the RUM Explorer—you can filter the Error Tracking Explorer by time range or facets such as service, environment, and application version to quickly identify a specific issue to investigate first. Each issue is labeled with a workflow state (open or ignored) to help your team members keep track of the status of issues. To help triage the most frequent errors with the broadest impact on your customers, you can also sort issues by the number of occurrences or the number of affected user sessions. In the following example, we can observe that while the transition error in our Android app is occurring most often, the error in our iOS app’s payment service is affecting the most customers.
If you click on an issue within the Error Tracking Explorer, you’ll see helpful metadata within an Issue Panel. A timeseries graph shows the frequency of errors within the issue, and the issue summary tells you which code version first threw the error. This data both indicates how serious the issue is and helps you correlate the issue’s occurrence with other events (such as a recent deployment).
For example, if you’re investigating an issue with a JavaScript feature that is unsupported in certain browser versions (e.g., lookbehinds), you can consult the Issue Panel to inspect the “first seen” time of the issue. You can then examine the error frequency graph to determine whether you should troubleshoot immediately—e.g., if errors have increased since the first occurrence—or plan to do so later. The Issue Panel also has its own query tool, so you can filter errors by facets such as view name, device, or browser. The Outliers tab automatically surfaces patterns in these facets to help you quickly identify the scope of the issue.
When it comes time to investigate, you can quickly characterize the error by looking at the summary at the top of the panel—Datadog automatically parses all of the issue’s error messages for patterns in order to provide a consolidated description. The panel also surfaces the source code that caused the error, making it straightforward to find and revert the relevant git commit. Afterward, you can keep tabs on the Error Tracking Explorer to see if the original issue is still occurring—or if other issues have cropped up instead.
Backend errors in the foreground
As with frontend JavaScript errors, Error Tracking helps you triage and investigate errors in your backend applications. Error Tracking uses APM traces to group errors with similar messages and error types into issues, so you can see when a backend error first appeared, when it last appeared, and how frequently it took place in between. Error Tracking also shows you an error’s stack trace—so you know where in your code to start investigating—and gives you crucial context by letting you navigate directly to view a trace that includes the error. You can start using Error Tracking for backend applications as soon as you have enabled tracing.
By grouping errors into issues and showing where they arise in your application source code, Error Tracking can help you identify trends that may otherwise go unnoticed. In the example below, Error Tracking shows us that our Ruby on Rails application, web-store, displayed a spike in PaymentServiceUnavailableError messages earlier this week. Using the stack trace, we can see that the ShoppingCartController#checkout method rendered the view that threw the exception.
We can then navigate from Error Tracking to view related errorful traces. The flame graph below makes it clear that the error in our payment service is being caused downstream by an exceeded rate limit in the service’s API.
Since our application should not be disrupting our users’ shopping experiences with error messages, we decide to investigate further, using Trace Search and Analytics to see if the spike in exceptions correlates with particular kinds of user requests.
More revealing stack traces
Production applications and CDNs often return minified JavaScript to browsers in order to reduce load times. But since minified code exists on a single line, it can make stack traces unhelpful. Even if you do manage to locate the cause of the error from the stack trace, you’ll need to find the corresponding lines within your JavaScript source files. Datadog Error Tracking automatically reverses the minification process for frontend JavaScript stack traces, making it easier to understand the changes you should make to your source code to resolve an issue.
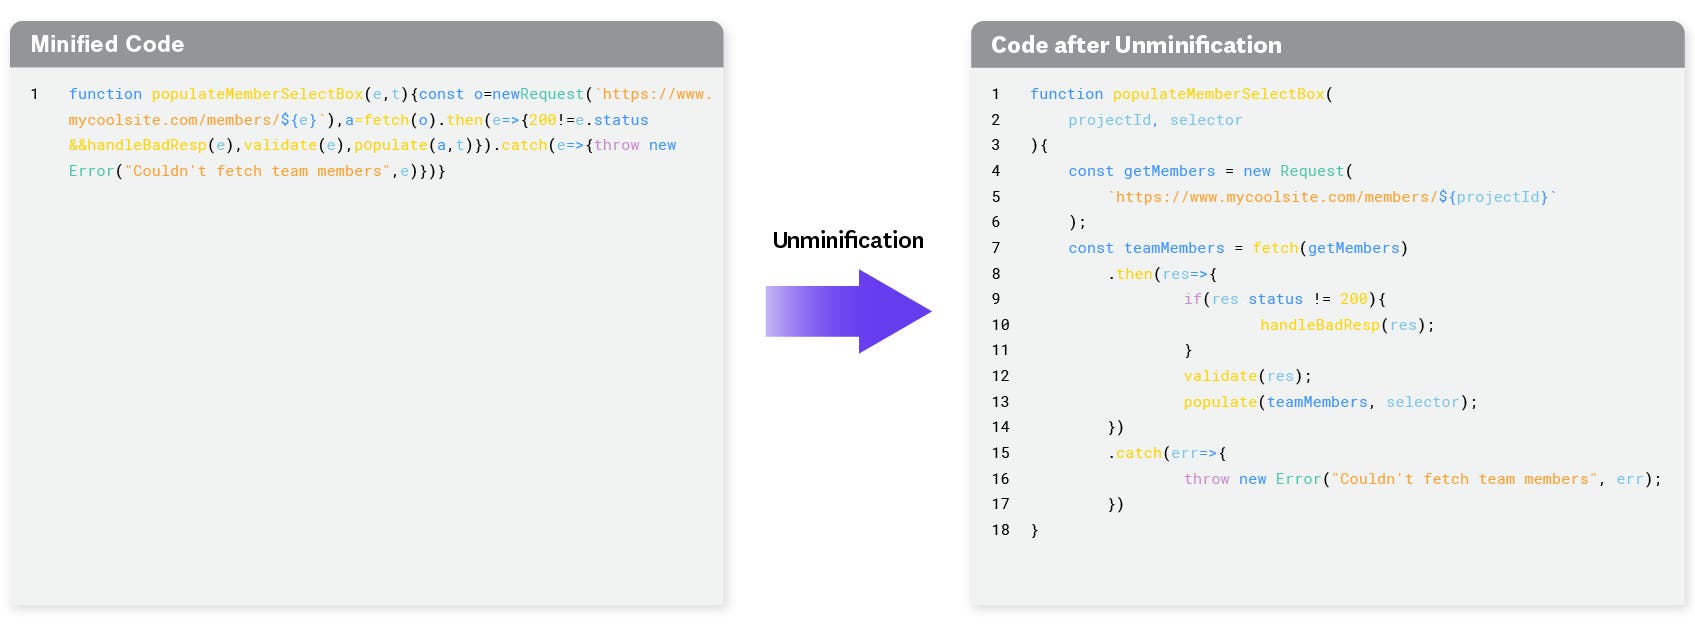
Error Tracking unminifies your code by using source maps, which indicate where segments of the minified code appear in the original source. Datadog makes it easy to upload source maps using the datadog-ci binary, which we designed to run inside continuous integration environments. Run the datadog-ci sourcemaps upload command to send the contents of your source map directory to Datadog automatically at build time. You’ll then be able to see unminified source code within the Issue Panel. Error Tracking also supports .dSYM parsing, so you can easily view human-readable stack traces for your mobile application code as well.
To err is human; to track is canine
Datadog Error Tracking gives you actionable insights into your application errors, making it easier to troubleshoot the issues that affect your users most. If you’re using RUM or APM, Error Tracking will start working right away. Error Tracking is just one way of getting comprehensive, code-level visibility into your applications. You can also set up Log Management, Synthetic Monitoring, and Continuous Profiler. And to get deep visibility into the resource utilization of your code, you can set up Datadog Profiling, which can run continuously—even in production. If you’re thinking about getting started with Datadog, sign up for a free trial.


