Jordan Obey
CockroachDB is a highly resilient distributed SQL database developed by Cockroach Labs. CockroachDB assures ACID semantics and aims to make it easy to scale horizontally by adding nodes instead of manually sharding the database. Built to be resilient (much like its namesake insect) and highly available as it scales, CockroachDB readily recovers from node failures by repairing and rebalancing automatically. In addition to its traditional self-hosted service, Cockroach Labs offers CockroachDB Dedicated, a fully-managed and cloud-hosted version of CockroachDB. CockroachDB Dedicated enables you to worry less about database provisioning and cluster management so you can focus more on developing and optimizing your application.
The success of your business depends on the health and performance of your database, regardless of whether it is self-hosted or fully-managed. In this post, we’ll look at how our integrations with both self-hosted CockroachDB and CockroachDB Dedicated help you spot and troubleshoot issues, such as sudden drops in throughput or storage capacity, anywhere in your Cockroach DB clusters.
Visualize and alert on hundreds of CockroachDB metrics
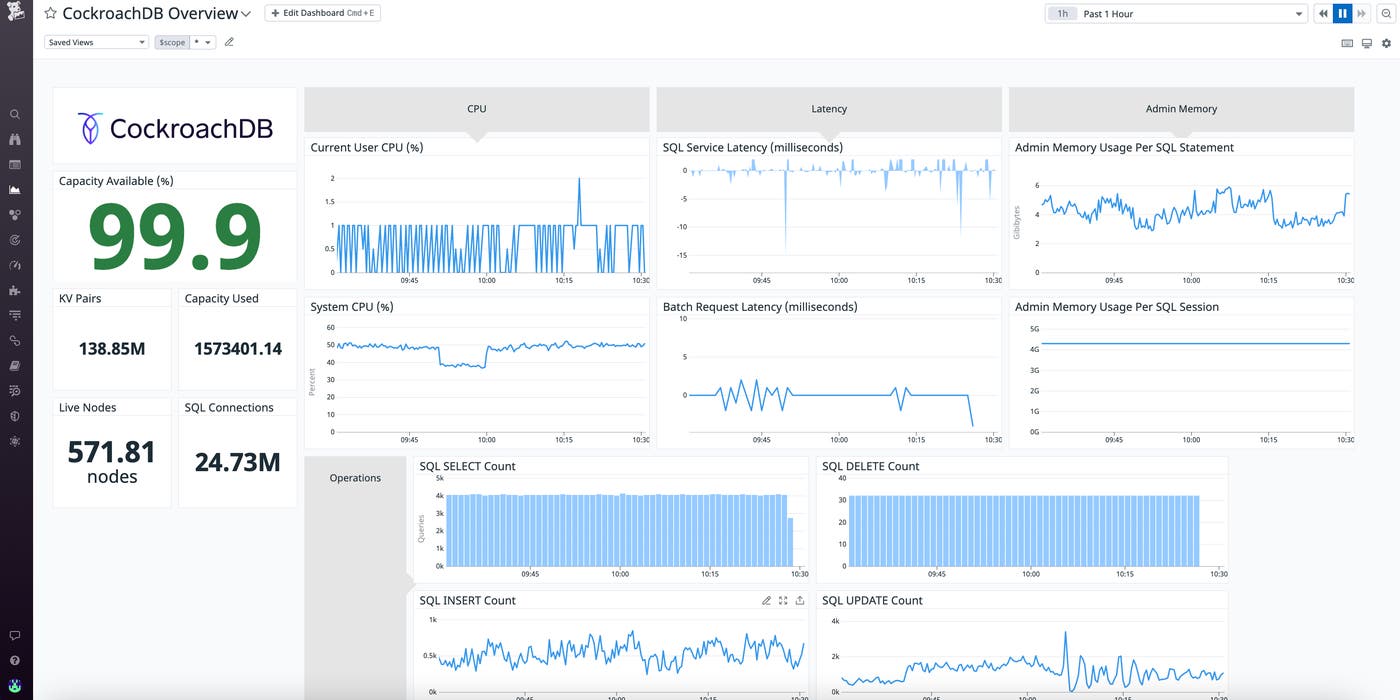
Once you’ve enabled either integration, Datadog will automatically collect and visualize hundreds of metrics to help you track the overall performance of your CockroachDB cluster. By monitoring your database with Datadog, you can ensure that it is always available and serving queries, and that it has sufficient resources to maintain high levels of performance. All the metrics collected from your CockroachDB database will be available for alerting, correlation, and graphing on a customizable, out-of-the-box dashboard.

Monitor data store workloads
For virtually any data store use case, you will want to closely monitor its workload. By monitoring your CockroachDB query throughput, you can track high-level database utilization and watch out for sudden changes (especially drops) that might be symptomatic of a problem like a connectivity issue. You can avoid missing unexpected behavior by setting up an automated alert with Datadog to detect changes in query throughput that deviate out of a forecasted range.

Track high-level cluster health
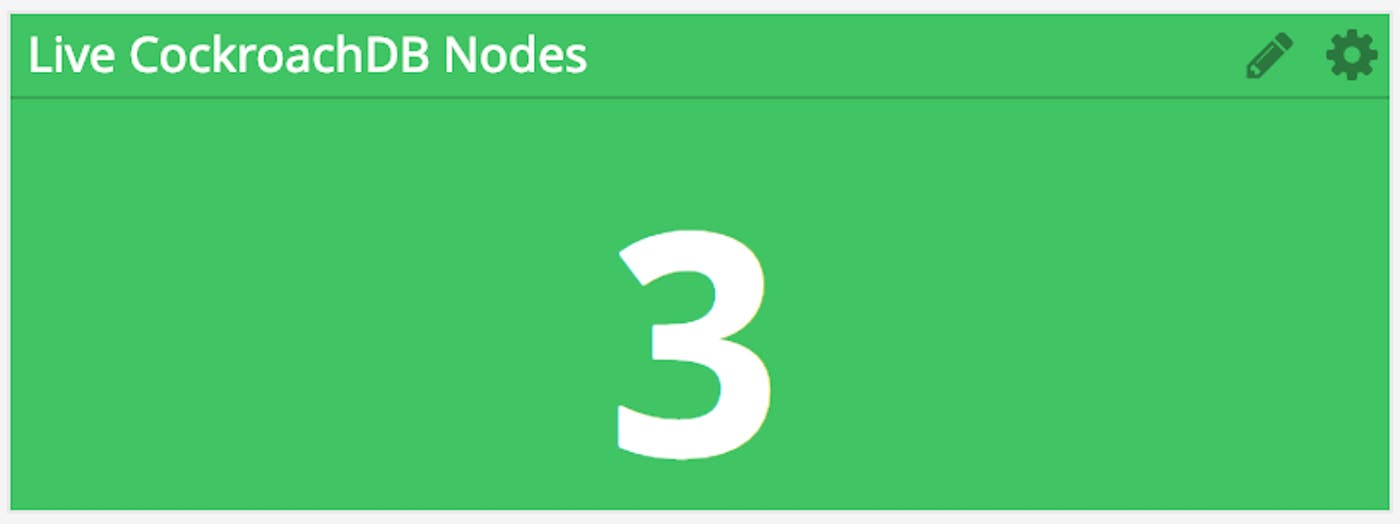
Our CockroachDB integrations also provide higher-level metrics describing the state of your database infrastructure, such as the count of live nodes in your CockroachDB cluster. These distributed nodes store data as a map of key-value pairs and divide them into ranges. To maintain consistency, CockroachDB implements a Raft consensus protocol that requires at least three nodes to be live in order to confirm data store changes. You can ensure that there are enough live nodes to support consistency by setting up an alert to automatically notify you if the count drops unexpectedly. If it does, it may be a sign of a large discrepancy between your node clocks, which will need to be resynced.

Add thresholds to your dashboards
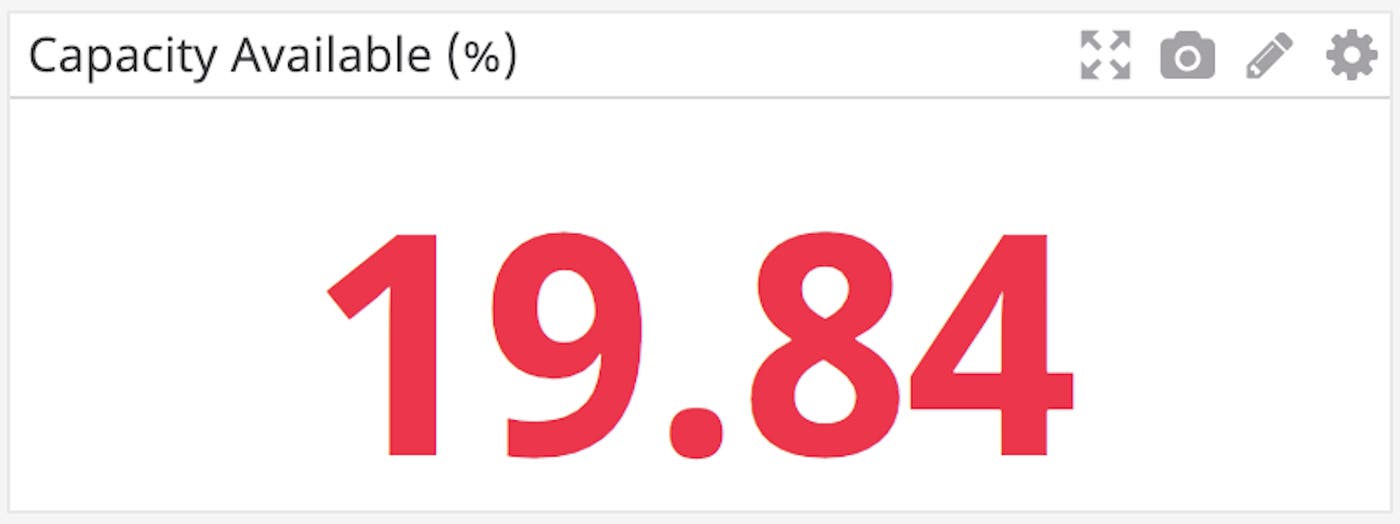
You can set up dashboard graphs and counters with thresholds to mark when a metric is above or below a specified value to know when your database needs attention. For example, you can take the metric tracking available storage capacity and divide it by the database’s total capacity to quickly calculate the percentage of disk space you have left. You can then use conditional formatting to display the resulting percentage in red if it falls below an acceptable threshold.

Monitor database resource utilization
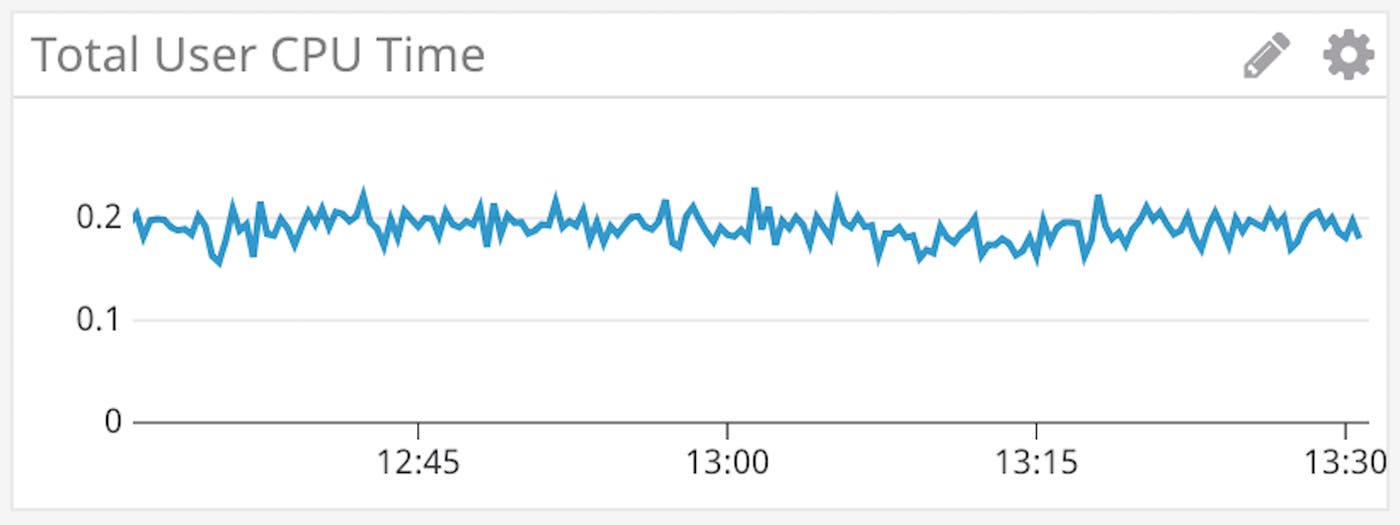
Datadog monitors user CPU time and percentage to measure how busy your database server is. By tracking CPU utilization alongside network throughput and other resource metrics, you can ensure that CockroachDB has sufficient capacity to serve queries quickly, and that you can efficiently troubleshoot any issues that arise.

Monitor CockroachDB performance in context
We are pleased to offer integrations with both CockroachDB and CockroachDB Dedicated, so that you can monitor hundreds of performance and usage metrics from CockroachDB alongside monitoring data from over 1,000 other technologies, including Amazon Web Services (AWS) and Google Cloud Platform (GCP). Datadog brings together metrics, logs, and distributed tracing to give you a comprehensive view of all the technologies in your stack, enabling you to monitor CockroachDB and all the applications that depend on it.
If you aren’t already using Datadog, get started today with a 14-day free trial.


