Kai Xin Tai
The MapR Data Platform enables organizations to manage, analyze, and store all their data at scale. MapR handles a wide range of data types across infrastructures and locations by leveraging dataware, an abstraction layer in the enterprise software stack that separates data from any dependencies. The platform supports open source engines and tools including Apache Hadoop, Hive, and HBase. We’re excited to announce that our new integration provides comprehensive visibility across all the moving parts of your MapR deployment.
Explore MapR performance metrics and health status
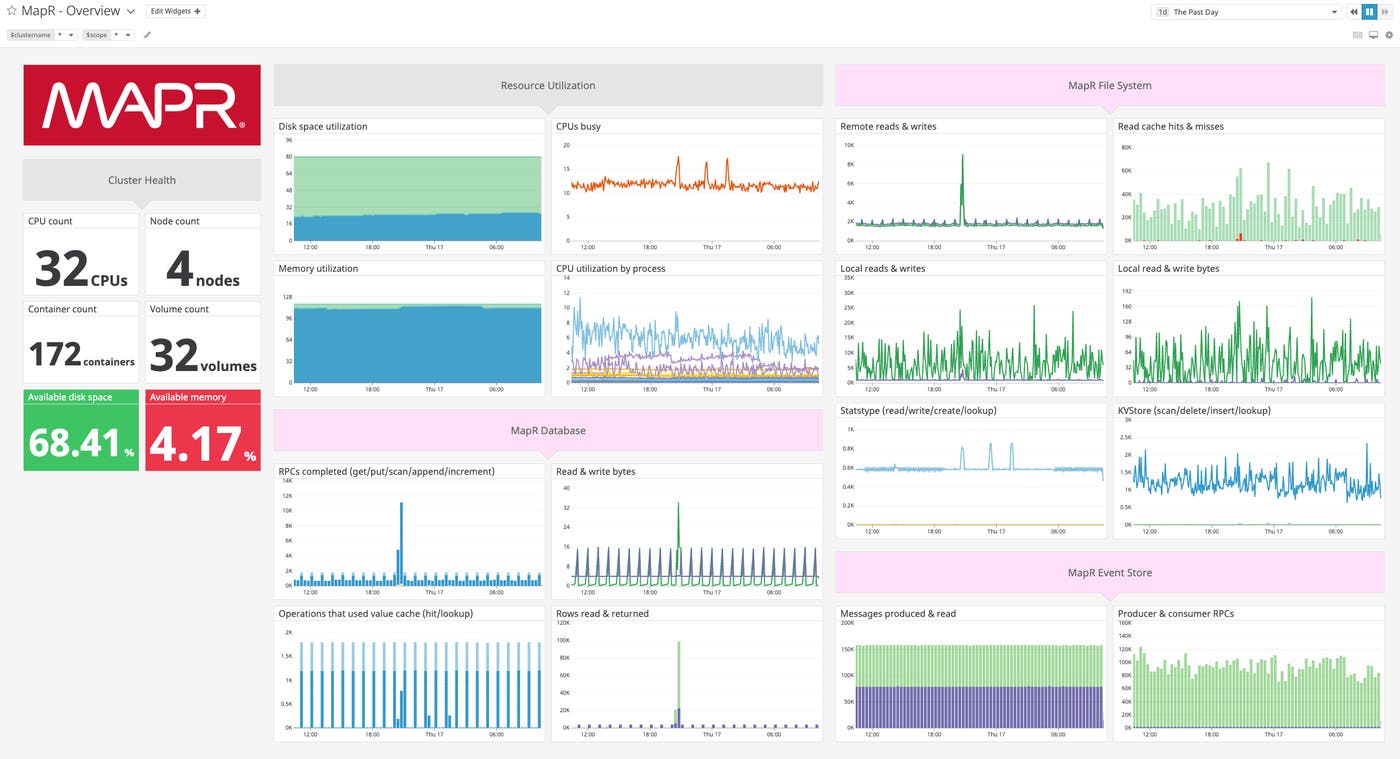
Within minutes of setting up our integration, you can start visualizing and alerting on key metrics from your MapR environment. The customizable out-of-the-box dashboard provides an overview of MapR’s three core services: a distributed file system, a NoSQL database management system, and a global event streaming system. And if you set up our Fluentd plugin to send MapR logs to Datadog, you can correlate them with metrics to troubleshoot issues with more context.

Track file system activity levels
While the MapR File System (MapR-FS) and Hadoop Distributed File System (HDFS) are both distributed file systems, MapR-FS has key architectural differences that provide improved performance and efficiency. For instance, MapR-FS is fully POSIX-compliant and allows parallel reads and writes directly to disk, whereas HDFS is built on top of the Linux file system and follows the write-once, read-many access model. If you’re looking to modify a file, you can simply overwrite it in place with MapR-FS. HDFS, in contrast, requires you to append any additional data to the end of the file or rewrite it entirely with the desired changes.
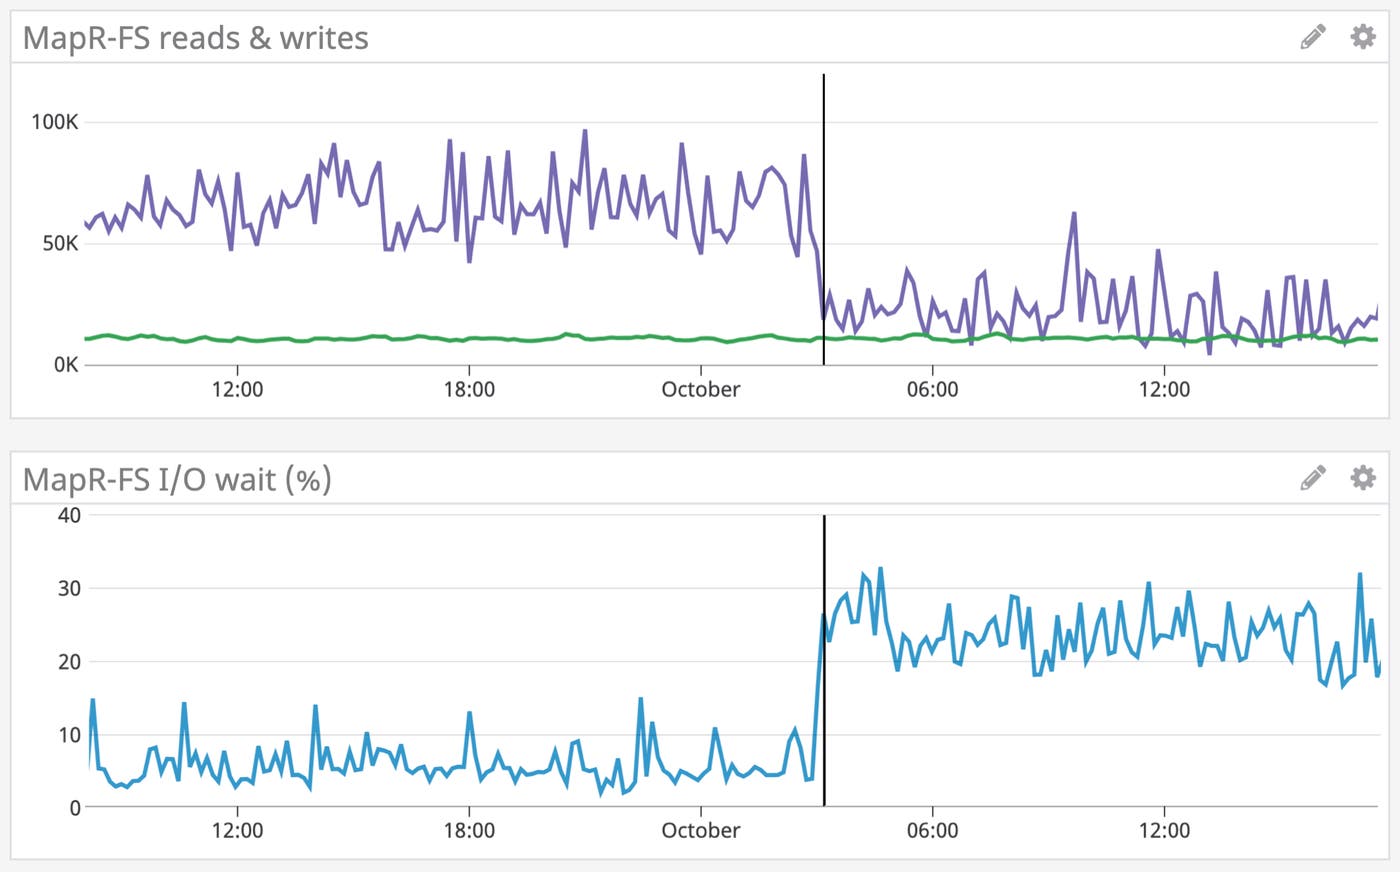
Although MapR-FS is built to handle heavy workloads, you will want to watch for any unexpected changes in throughput that would warrant further investigation. If you observe a sustained dip in reads or writes, you can correlate it with system-level metrics, like I/O wait time, to determine if there is a resource bottleneck. High I/O wait time could indicate a failed disk, which would be brought offline along with other disks in the same storage pool. MapR provides useful instructions on how to recover from a disk failure, such as by removing and replacing disks in the case of a hardware failure.

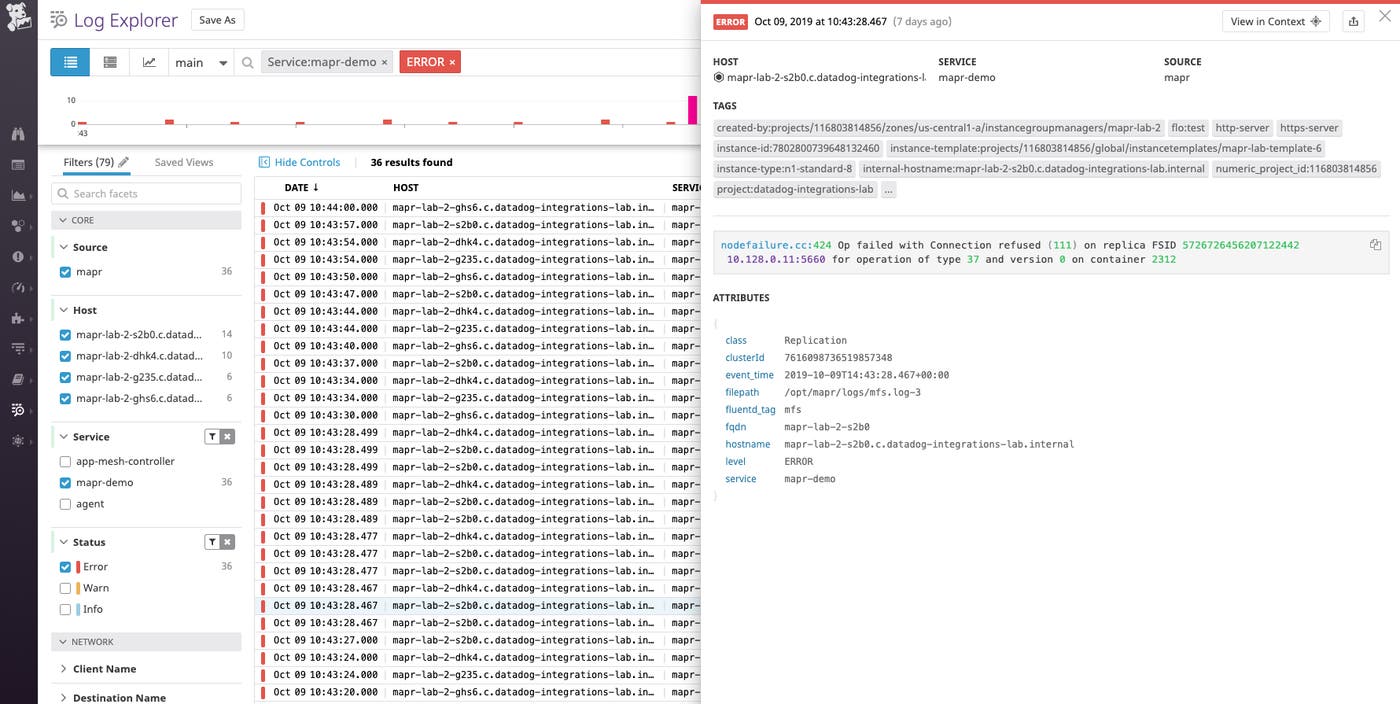
In addition, logs can provide useful context when troubleshooting issues with the file system. After you’ve configured the Fluentd plugin to forward logs to Datadog, you can click on a section of any timeseries graph to navigate directly to relevant logs collected during the specified period. Within the Log Explorer, you can search and filter by a range of facets to take a closer look at a specific component of your MapR stack.
The log highlighted here shows a node failure, which could affect cluster availability if the volume replication factor falls below the minimum factor needed to prevent data loss. If you have the enforceminreplicationforio parameter set to true, the file system will not accept any writes to its containers as long as the minimum replication factor is not met.

Detect database query performance issues
As you scale your cluster, monitoring query throughput can help you determine if your MapR NoSQL database (MapR-DB) is processing queries efficiently. MapR-DB sorts JSON documents by their unique document ID, otherwise known as the primary key of each table. While primary key-based data retrieval is quick, querying with other fields is a slow process as every row of the table needs to be scanned sequentially to find the right match(es).
As your database grows, performing full table scans quickly exhausts CPU and disk resources, causing query performance to suffer. Ideally, the number of rows read and returned should be close to equal since efficient queries avoid examining more rows than necessary to return the data you need.

In the graph above, you can see that far more rows are read from MapR-DB tables (mapr.db.table.read_rows, in green) than returned (mapr.db.table.resp_rows, in purple). To boost query performance, you can create secondary indexes on the most frequently queried fields. Secondary indexes order documents by fields other than the primary key to help optimize certain types of queries. To learn more, see the MapR documentation.
Navigate changes in the flow of messages
If you rely on MapR Event Store for Apache Kafka (MapR-ES) to deliver real-time data for mission-critical applications, it is crucial that you keep an eye on its performance. While MapR-ES is similar to Kafka in a number of ways, it has been specifically designed to transport large streams of data on the MapR platform, and includes built-in support for automatic load balancing, global data replication, and other features.

The out-of-the-box dashboard includes a graph that compares the number of messages produced (mapr.streams.produce_msgs, in purple) and read (mapr.streams.listen_msgs, in green), so you can detect and investigate any bottlenecks along the pipeline. For example, if you see that significantly more messages are routed from producers than received by consumers, it could indicate that downstream consumers are overloaded and cannot keep up with the incoming flow of messages. You can troubleshoot by using the command line to check for consumer lag, along with I/O bottlenecks on the nodes that host partitions with high lag. If you’ve determined that consumer lag is not associated with an I/O bottleneck, you can consider scaling out consumers to improve the performance of your message flow.
Keep your MapR components on course
Datadog’s new integration with MapR 6.1+ provides comprehensive visibility into your distributed big data architecture, allowing you to quickly diagnose resource and performance-related issues.
We now support over 1,000 technologies—including Apache Spark, Hive, and Yarn—so you can get a view of your entire stack in one place and ensure high availability for the Hadoop applications that are running on your MapR cluster. If you’re not already using Datadog, you can get started today with a 14-day free trial.


