
Dom Nguyen
Senior Product Marketing Manager

Doug Gunter
Software Engineer II
AI coding tools such as Cursor are becoming a significant source of engineering spend. But Cursor costs can be difficult for FinOps teams to manage. Cursor’s usage data alone doesn’t tell you how costs break down across users and models, and fixed-threshold alerts may not catch an unusual cost spike if spend remains below the threshold.
Datadog Cloud Cost Management (CCM) brings Cursor costs into the same place where you monitor cloud, SaaS, and other AI spend. You can see who and what is driving Cursor costs, detect unexpected cost changes, correlate spend with usage, and use monitors and budgets to keep costs in control.
In this post, we’ll show you how to:
Understand Cursor costs and usage by user and model
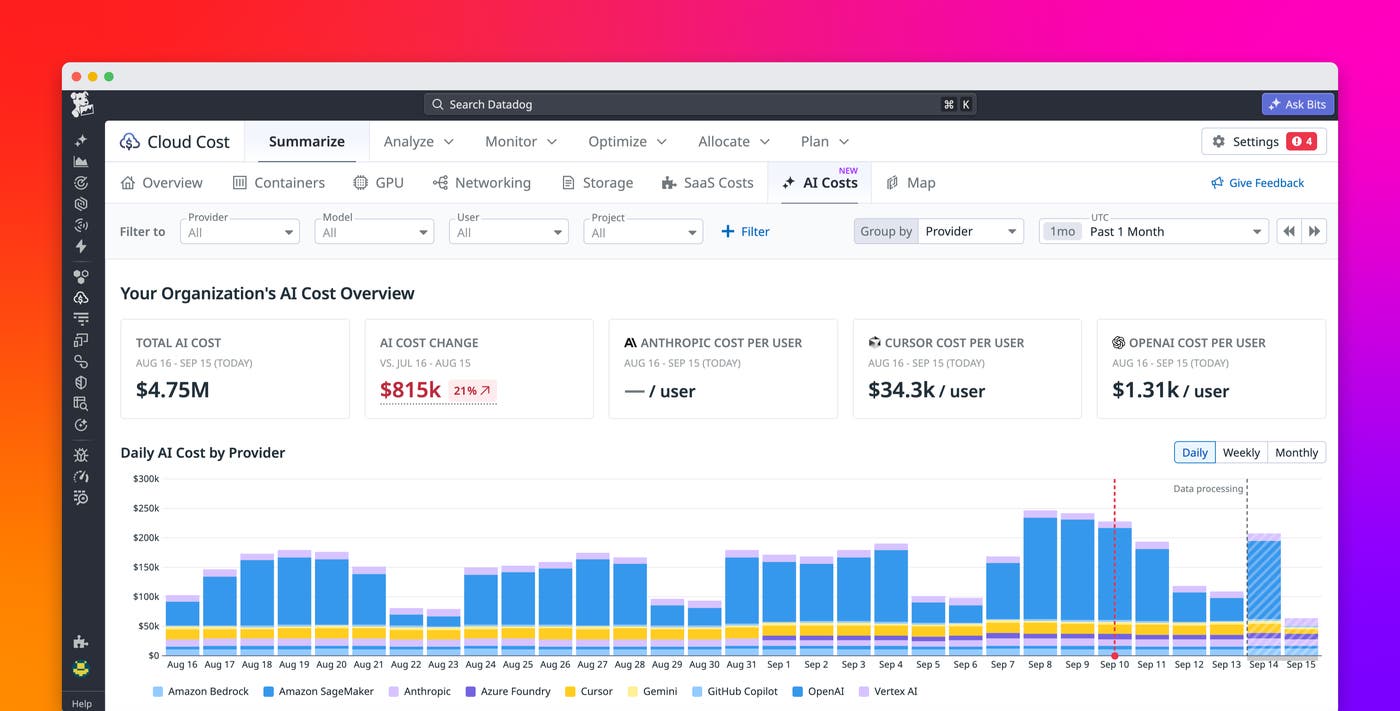
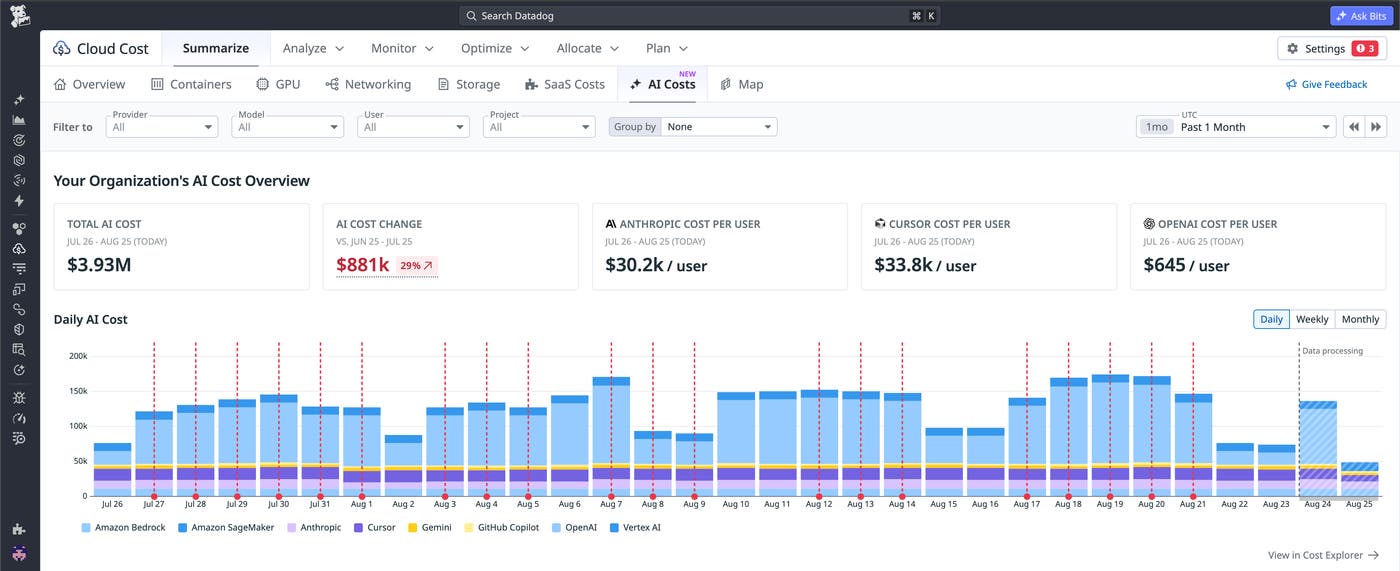
Cursor spend appears on the AI Costs tab within CCM, where you can see total Cursor cost, period-over-period cost changes, and cost per user. You can view costs by day, week, or month and filter the data by model, user, Max Mode, headless mode, and billing group.
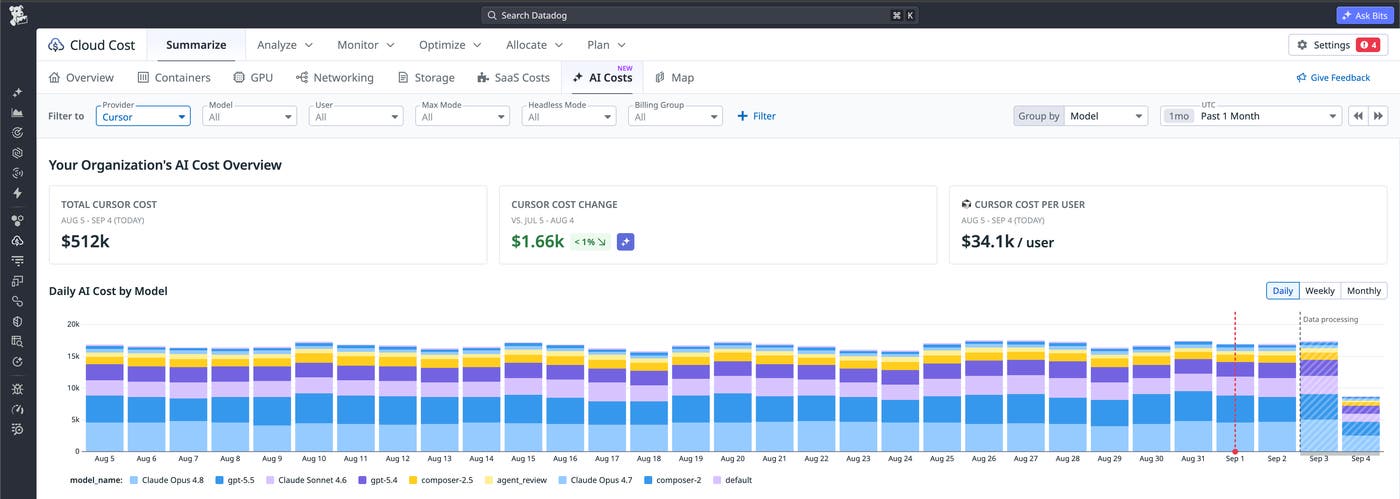
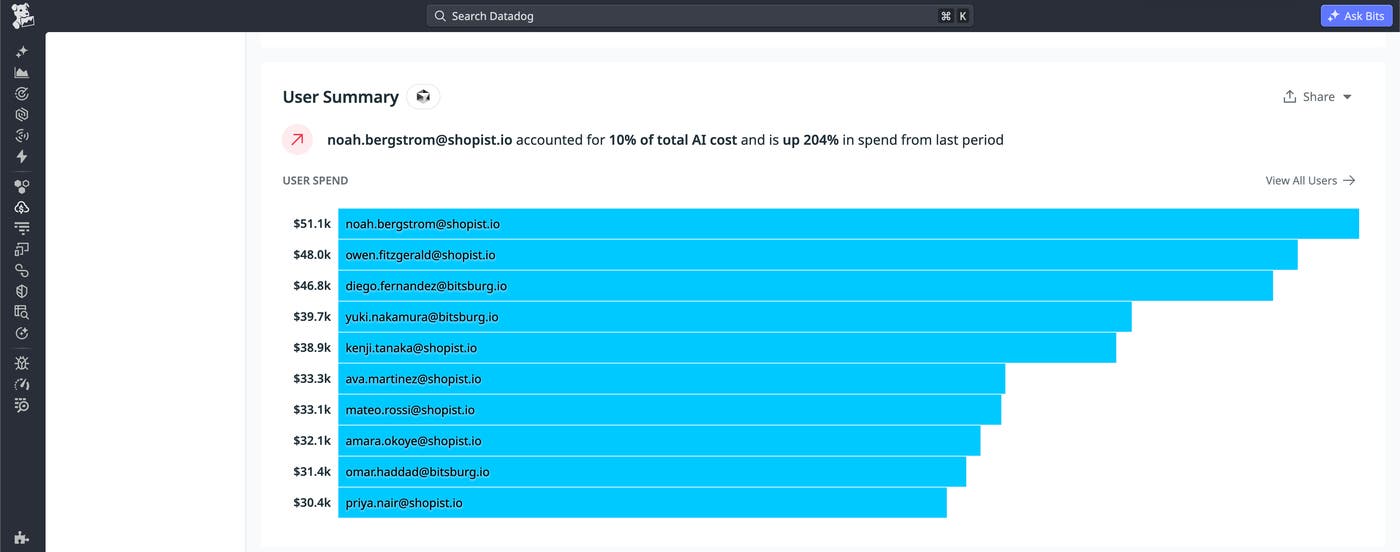
Provider, model, and user summaries add more context by showing how costs are distributed across different AI providers, models, and users. These views make it easier to connect a change in your Cursor bill to the usage behind it. For example, you can quickly identify when more spend is shifting toward an expensive model or find users whose costs increased substantially from the previous period.
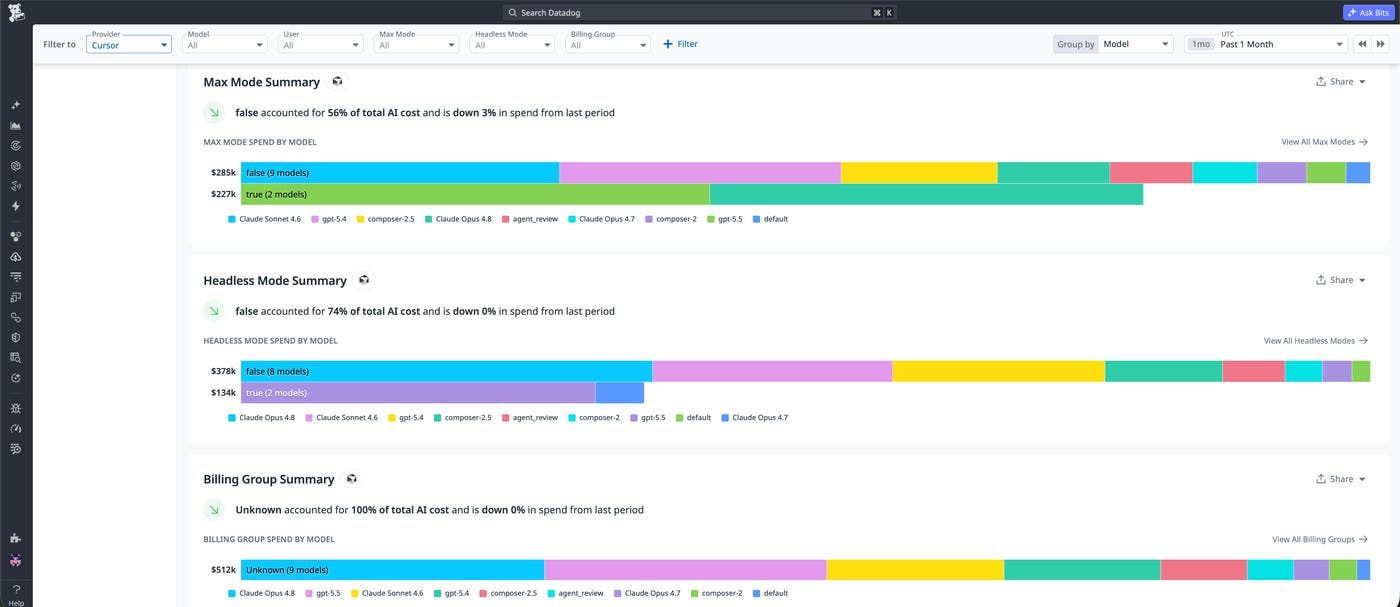
Max Mode, headless mode, and billing group summaries give you the same period-over-period breakdown across those three additional dimensions. Together, they make it easy to answer questions such as:
Is Max Mode usage growing faster than standard usage?
How much are our background agents actually costing us?
See Cursor costs in the out-of-the-box dashboard
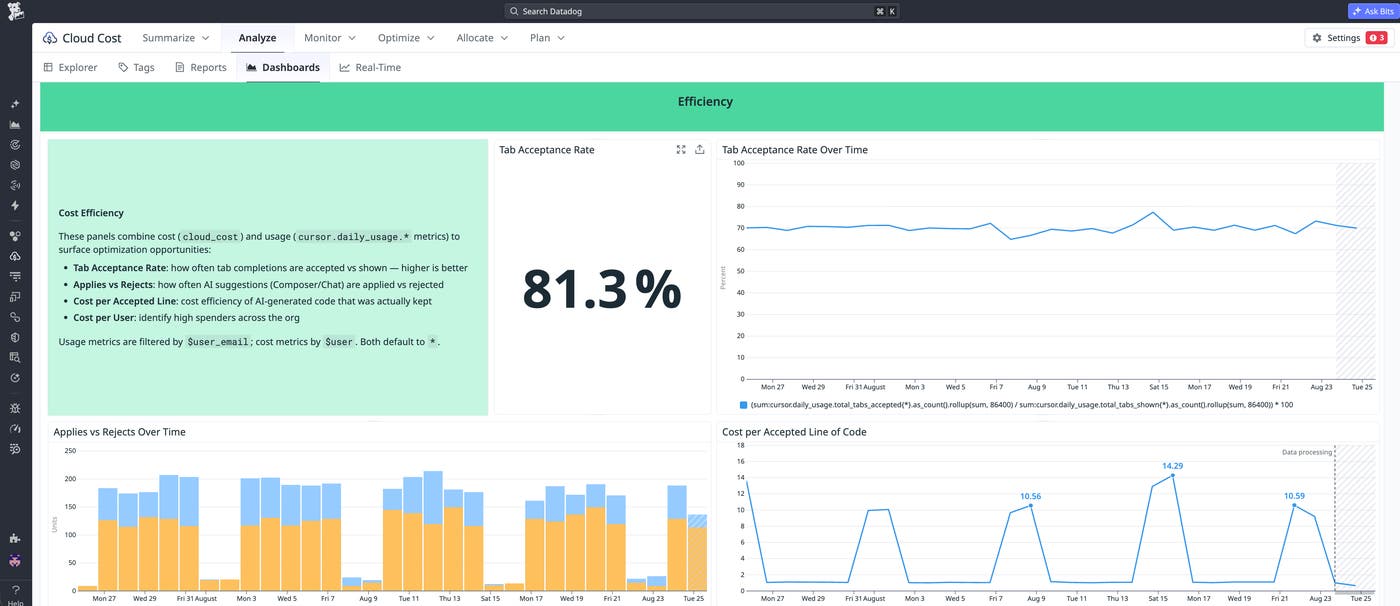
The Cursor integration also includes an out-of-the-box dashboard that provides more detailed cost and usage analysis without requiring any additional configuration. Here are some of the main features and capabilities of the dashboard:
The Usage Changes table compares costs for the past 30 days with the previous 30 days broken down by billing group and model, including the dollar and percentage change. This breakdown lets teams quickly identify where spend is accelerating and have informed, data-driven conversations about usage and budgets.
The Budget & Usage Mode widgets help you understand how your Cursor budget is being consumed, with costs broken down by overage spend, Max Mode surcharges, and cloud agent spend.
The dashboard lets you compare model costs over time and view a ranked list of users by total spend. Together, these views let teams quickly identify their highest spenders and see how model preferences are shifting to make better cost optimization decisions.
The Efficiency section brings together cost and observability data to show whether your Cursor spend is delivering value. It surfaces four key measures: tab completion acceptance rate, AI suggestion apply vs. reject rate, cost per accepted line of code, and cost per user. Together, these measures allow teams to understand how efficient their spend is.
See Cursor costs in Cloud Cost Explorer
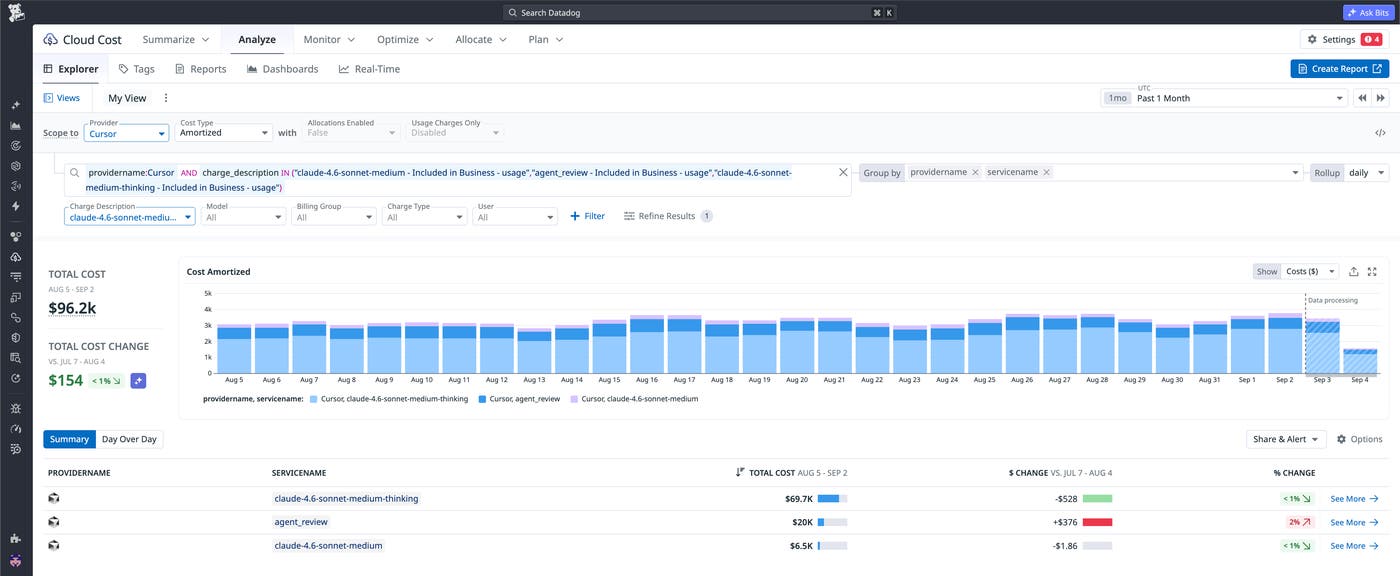
Beyond the AI Costs tab, Cursor costs are also available in the Cloud Cost Explorer. Here you can further filter and group your costs by tags, such as charge_description. You can also clone and customize dashboards to surface the breakdown most relevant to your team, so every stakeholder, from engineering managers to FinOps, has the view they need to make decisions.
Catch cost spikes and avoid budget overruns
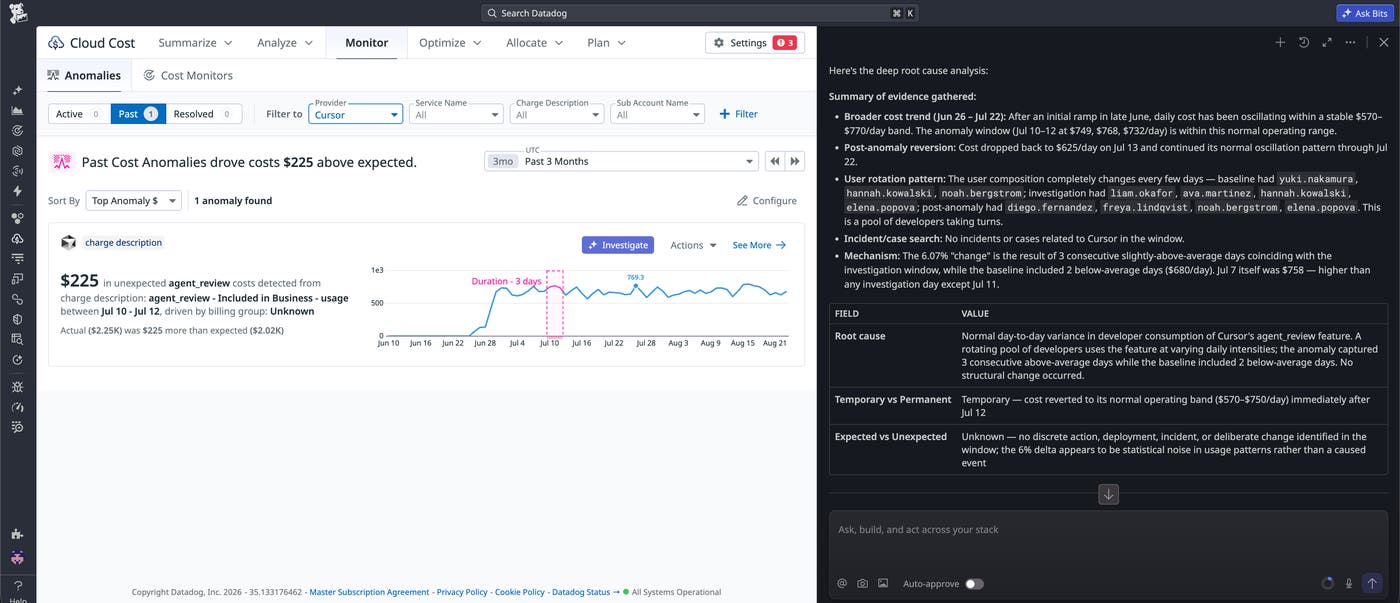
Even with full visibility into your Cursor costs, spikes can occur unexpectedly. CCM automatically surfaces cost anomalies for Cursor, helping you find spending that differs from historical patterns. Cost anomalies let you detect and address any cost increases early, before the spending accumulates.
Each anomaly includes the duration, affected cost dimension, and actual spend versus expected spend. A trend line shows where costs depart from the expected range.
From the page indicating the anomaly, you can use the Cloud Cost skill in Bits Chat to automatically analyze what caused the spike, such as a particular model, user, or usage mode. This root cause analysis shortens investigations and reduces mean time to resolve (MTTR). In the example below, Bits determined a particular spike was caused by 3 consecutive above-average days of usage for Cursor’s agent_review feature.
AI Costs also surfaces recommendations for reducing Cursor spend. For example, Datadog may recommend enabling Cursor Auto mode for particular users and models. When offering recommendations, Datadog shows the current monthly spend alongside estimated monthly savings.
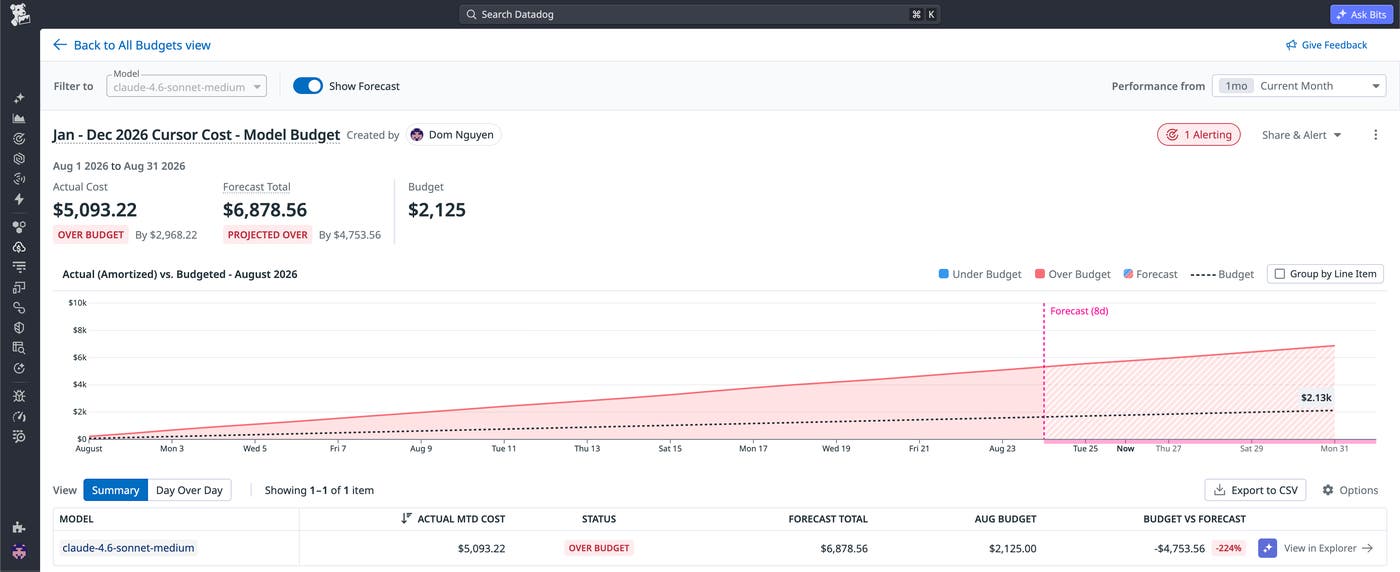
To help stay within budget, you can set up cost monitors for your Cursor spend. For example, you can create alerts when total Cursor spend, spend from a specific billing group, or Max Mode surcharge costs cross a defined threshold so that your team stays ahead of budget overruns.
You can also create budgets for Cursor costs to track spending limits across billing groups and users:
View cloud, SaaS, and other AI spend alongside Cursor costs
Cursor costs don’t appear in isolation. Your teams may also be accumulating expenses across AWS, Snowflake, Databricks, OpenAI, Anthropic, and other providers while building and running software. And if Cursor costs are managed separately, engineering and FinOps teams have to piece these expenses together to understand their broader technology spend.
CCM brings together your Cursor costs alongside your other AI costs, your cloud costs, your SaaS costs, and other costs so that all your spend can be analyzed in one unified view. You can use the Cloud Cost Explorer and dashboards to compare providers and break down costs by the dimensions that matter to your organization. Comparing providers this way puts Cursor spend in context with the infrastructure and software costs that teams already manage.
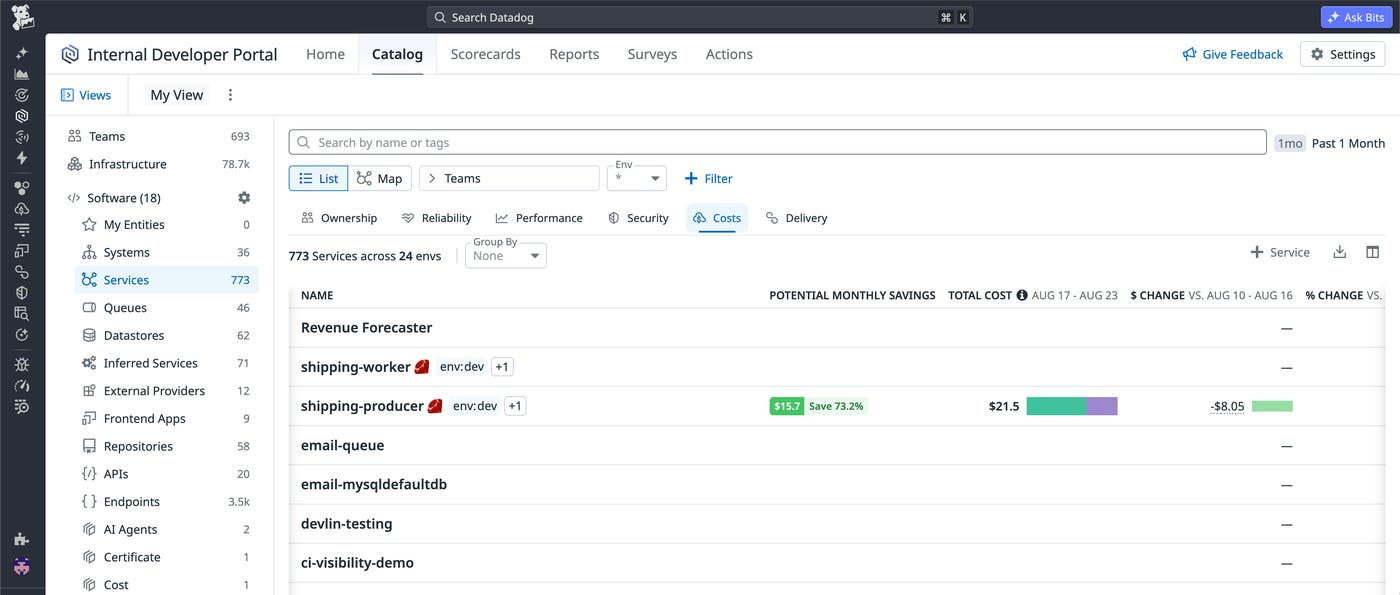
CCM can also surface total service costs in the Catalog, giving teams a quick way to identify expensive services and investigate their underlying costs.
Get started with Cursor cost management
The Cursor integration with Cloud Cost Management helps engineering and FinOps teams identify who and what is driving AI coding costs, catch unexpected spending changes, and manage Cursor costs alongside their other technology spend.
To get started, follow the documentation for configuring Cursor SaaS costs. For more information about managing AI costs across multiple providers, see the AI Costs in Cloud Cost Management documentation.
If you don’t have a Datadog account, sign up for a 14-day free trial to start managing Cursor costs alongside your cloud and SaaS spend.
