
Milene Darnis
Senior Product Manager

Adam Virani
Product Marketing Manager
Launches are high-stakes moments for product managers (PMs), but understanding how a new product or feature is performing can be difficult. Teams may lack the instrumentation they need to track performance, or they may miss defects that affect specific user segments during QA. When a launch underperforms, PMs can spend days determining whether the problem is the feature itself or how it’s being measured, leaving analysts, engineers, and designers needing to rebuild what should have existed on day one.
Launches in Datadog Product Analytics connects launch planning, instrumentation, experimentation, user experience analysis, and reporting together in a single, connected workflow. Starting with a product brief and the Datadog Feature Flag, teams can define what they need to measure before release and monitor the most important user signals throughout the rollout.
In this post, we’ll show you how you can use Launches to:
Plan and instrument a launch before it ships
Most PMs already know what questions their launch has to answer, but they may not be sure those questions will be answerable on launch day. This happens when the necessary instrumentation to track how users are interacting with the new feature is not in place at rollout.
When you create a launch in Product Analytics, the planning workflow moves through four steps: context, questions, tracking plan, and experiment. Bits AI drafts each step for you to edit, rather than handing you a blank form.
For example, say you’re launching an exclusive cart offer that adds an upsell to an ecommerce cart. In the context step, you paste the brief and connect the feature flag the offer will ship behind. In the questions step, you can draft measurement questions, such as how many eligible users see the offer, how many interact with it, and whether it changes the average order value, or use Bits AI to automatically generate questions based on your launch’s brief. You can then edit, add, or remove these questions to match the decisions your team expects to make.
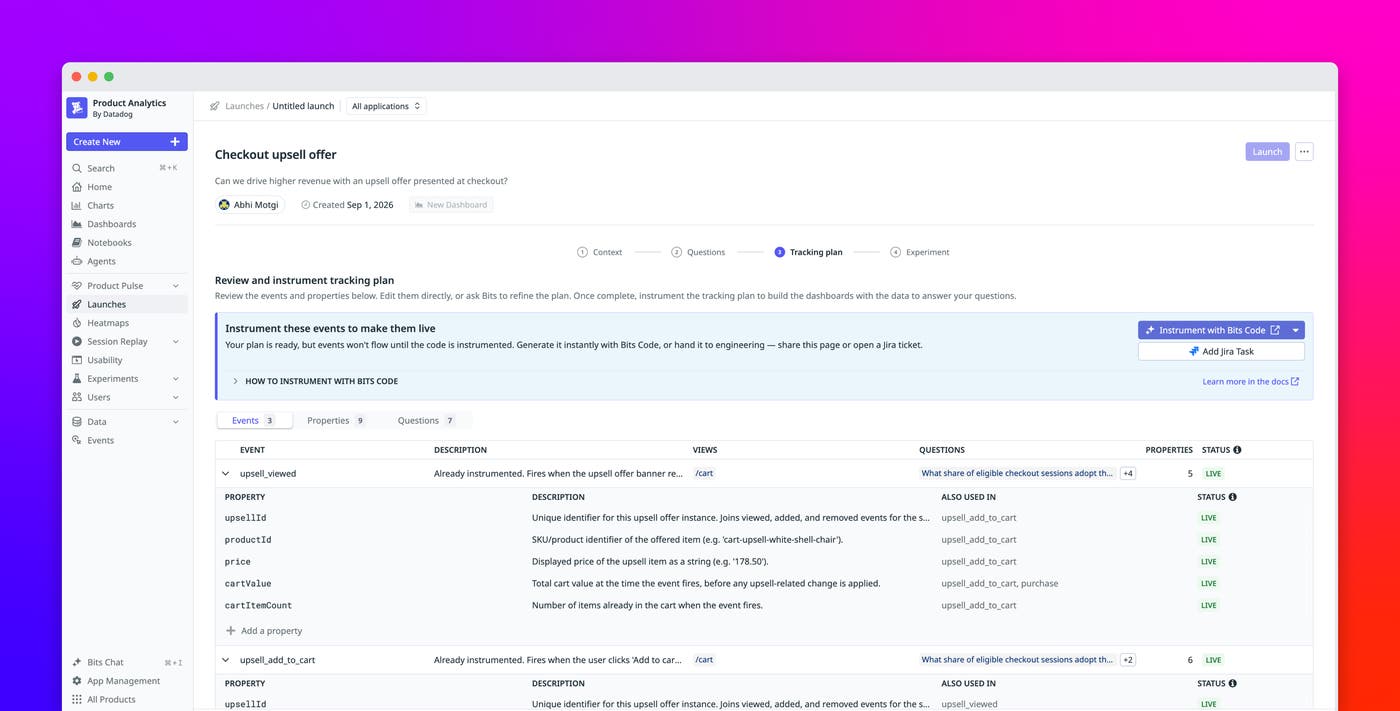
The tracking plan step derives the events and properties needed to answer each of those questions. This keeps instrumentation tied to the launch’s measurement goals, instead of defining events only around available UI interactions.
Datadog compares that plan against the events you already send and shows you which events and properties are missing to answer your questions. Where a relevant event already exists, Datadog reuses it instead of instrumenting the same thing twice. Once you confirm the tracking plan, Datadog can open a pull request with the required instrumentation. Your team can review the measurement logic and implementation before the rollout starts, rather than discovering gaps after data starts to arrive.
This workflow can also apply to product changes that don’t modify the web UI, such as ranking or recommendation algorithms. Because the tracking plan starts with outcomes rather than clicks, teams can define measurement around the behavior that matters for the launch.
Catch broken experiences across real user segments
Pre-release QA cannot cover every device, screen size, geography, network condition, and user behavior that a feature will encounter in production. This gap makes it difficult to catch defects that leave a feature technically available but difficult or impossible to use.
In our exclusive cart offer, for example, a quantity selector might render correctly and accept clicks without triggering the expected action. On a mobile screen, the component might also extend past the viewport, putting the Add to Cart button outside the usable page. A test on a developer’s laptop may not expose either problem.
As traffic increases, Launches shows you Session Replay and RUM data from users exposed to the feature flag. Comparing the treatment and control sessions helps you focus an investigation on friction associated with the product change.
Datadog also enables you to break down sessions by dimensions such as device type, screen size, or country. If an issue only affects one segment, you can move from that segment to the relevant issues and example Session Replays to understand what those users experienced.
This context complements experiment metrics, helping you better interpret product data. A conversion decrease can tell you that a treatment is underperforming, while a Session Replay that captures repeated clicks on a nonfunctional quantity selector helps explain why.
Validate experiments as you roll out
With instrumentation in place before launch day, the Datadog Feature Flag you connected to your launch becomes the link between the change and the users who saw it. Launches in Product Analytics runs your rollout through Datadog Experiments, so you can compare product, performance, and business outcomes between treatment and control using statistics your data science team has already approved.
In the experiment step of the launch workflow, experiment metrics will be prefilled based on the launch definition and remain editable before the experiment begins. This lets data science teams establish reusable experiment designs instead of redefining the methodology for every launch.
From here, Datadog Feature Flags controls targeting and progressive exposure. A rollout can begin with employees or a small percentage of traffic, giving teams an opportunity to find experience and configuration problems before increasing exposure. After validating the initial cohort, the team can increase traffic for the experiment.
Datadog Experiments also evaluates diagnostics while an experiment runs. These checks can surface issues such as sample ratio mismatch, over-assignment, dilution, and missing metric coverage while they are happening, rather than as a final outcome. Finding an uneven treatment split early, for example, can help the team correct the configuration instead of discovering the problem after the full experiment has run.
Bring launch signals into one place
Launch investigations become harder when product, engineering, and support teams each work from different signals. Metrics might indicate that adoption declined, while RUM data captures frontend errors, and support tickets describe the same problem from the user’s perspective.
The launch command center in Datadog Product Analytics organizes these signals around the feature flag that identifies who was exposed. As rollout data becomes available, the command center brings together the key signals about the launch, including rollout stage and exposure count, KPIs, experiment diagnostics and results, technical health, the segment coverage table with its friction and visual findings, the launch funnel, and support tickets.
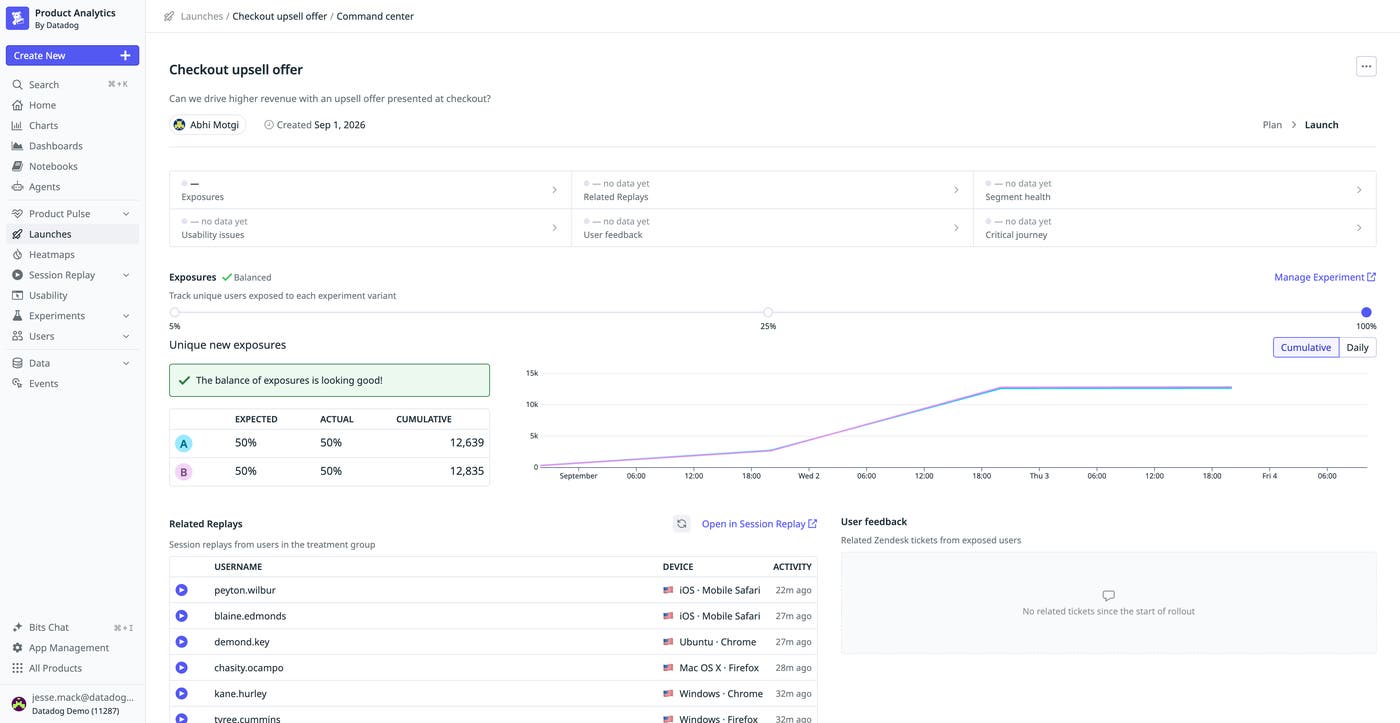
Connecting these signals makes individual findings easier to interpret. If conversion drops, for example, you can investigate whether affected sessions also contain user frustration signals and frontend errors. Likewise, you can evaluate an experiment result alongside the performance and behavior of the treatment population.
Datadog can connect all of this context because the underlying signals already exist elsewhere across the platform. Product Analytics captures behavioral data, Session Replay provides session context, RUM captures frontend performance and errors, Feature Flags identifies exposure, and Experiments measures treatment effects. Launches in Product Analytics organizes those existing signals around the specific product change your team is evaluating.
Keep measuring after the rollout
The questions that define a successful launch remain useful after a feature reaches full exposure. Instead of treating the measurement plan as a temporary launch artifact, teams can continue using its KPIs to evaluate the success of a product flow.
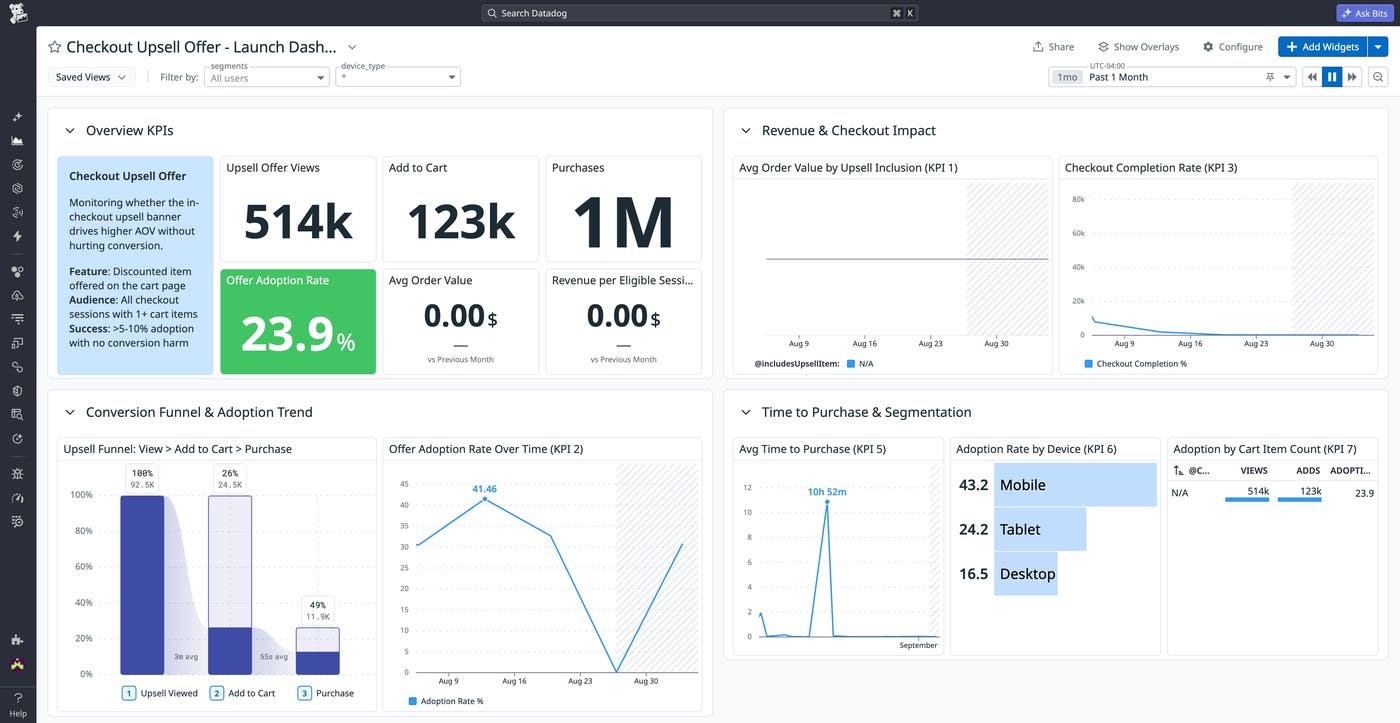
After you set up your launch, Bits AI automatically generates an editable KPI dashboard based on the tracking plan you defined. This gives teams a persistent view of the metrics that will help them answer key questions about the launch. They can also use this dashboard as a starting point for ad hoc analysis when new questions arise.
For changes to important flows, such as checkout or login, that measurement context can also inform ongoing journey monitoring. Datadog Journey Monitoring brings together Product Analytics, RUM, Synthetic Monitoring and Testing, and Session Replay data to track traffic, conversion, time to completion, errors, and uptime across critical user journeys.
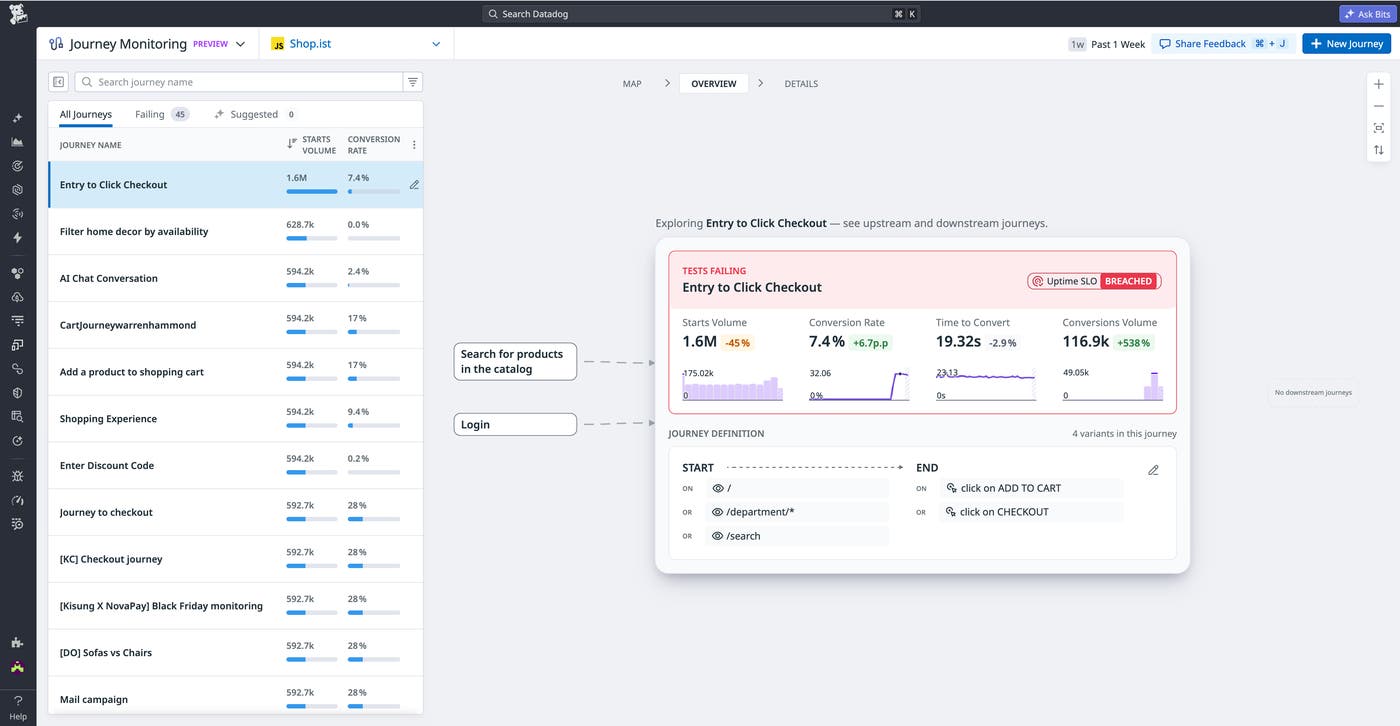
Launches in Product Analytics can suggest ongoing coverage for a flow that may have been affected by your release, while leaving the decision to create or modify the journey with the user. This lets teams carry useful measurement context beyond the rollout, so the questions that defined success before release can continue to inform how the team monitors the experience.
Measure launch success from planning through rollout
Launches in Datadog Product Analytics helps product teams define measurement before release and keep product, experiment, and user experience signals connected throughout a rollout. When results change, teams can investigate based on the context they established before launch, instead of reconstructing instrumentation and analysis afterward.
To understand the capabilities that support this workflow, read the documentation for Datadog Experiments, Feature Flags, Agentic Onboarding for Product Analytics, and Journey Monitoring.
If you don’t have a Datadog account, sign up for Product Analytics Launch Agent to get started, or start a 14-day free trial.
