

Bill Meyer

Eddie Cai
Technical Content Writer
OpenTelemetry (OTel) tail-based sampling helps teams control trace volume by retaining errors, slow requests, and other traces worth investigating while dropping lower-value traffic. In distributed systems, a single request can fan out across many services, each emitting spans. That volume adds up quickly. Some applications produce millions of traces per hour, while large clusters generate more than 10 billion spans per day. Because most of that volume comes from healthy requests that teams are unlikely to investigate, sending every span to an observability backend increases ingest costs, slows queries, and can shorten retention windows.
With tail-based sampling, the OTel Collector waits for a trace to complete before evaluating it against the configured policies. Because Span Metrics are computed before sampling, request, error, and latency data continue to reflect all traffic.
This guide uses a synthetic rideshare application that emits realistic traffic, including intentional errors used to build and validate sampling policies. In this example, the final configuration reduces exported trace volume by about 98% while Span Metrics continue to reflect all traffic.
We’ll cover how to:
Deploy collectors in a gateway pattern that makes accurate tail sampling possible
Solve the developer experience problem tail sampling creates
Choose between head-based and tail-based sampling
The most important concept in sampling is when the decision to keep or drop a trace is made.
Head-based sampling decides at the start of a trace. The SDK makes the decision on the root span and propagates it downstream through W3C Trace Context. Because the decision happens before the trace completes, the sample can miss errors deep in the call stack. Those traces can be silently dropped and latency spikes can become invisible.
Tail-based sampling decides after the trace completes. The collector buffers the trace’s spans and evaluates them against the configured policies. This requires more memory, but it lets the collector retain errors, slow requests, and other traces based on what actually happened during the request.
Deploy collectors in a gateway pattern for tail sampling
Tail sampling has one hard requirement that shapes the architecture. All spans for a given trace must reach the same collector instance, which groups them by trace ID before applying any policy. If spans from one trace are split across collector instances, no single collector has a complete view of the trace and its spans, so it cannot make a reliable sampling decision.
The gateway deployment pattern solves this with two tiers of collectors. Upstream collectors sit close to the application, receive traces over the OpenTelemetry Protocol (OTLP), and forward them with the Load Balancing exporter. The exporter routes spans that share a trace ID to the same gateway instance. Gateway collectors then compute Span Metrics, apply tail-sampling policies, and export sampled telemetry to Datadog.
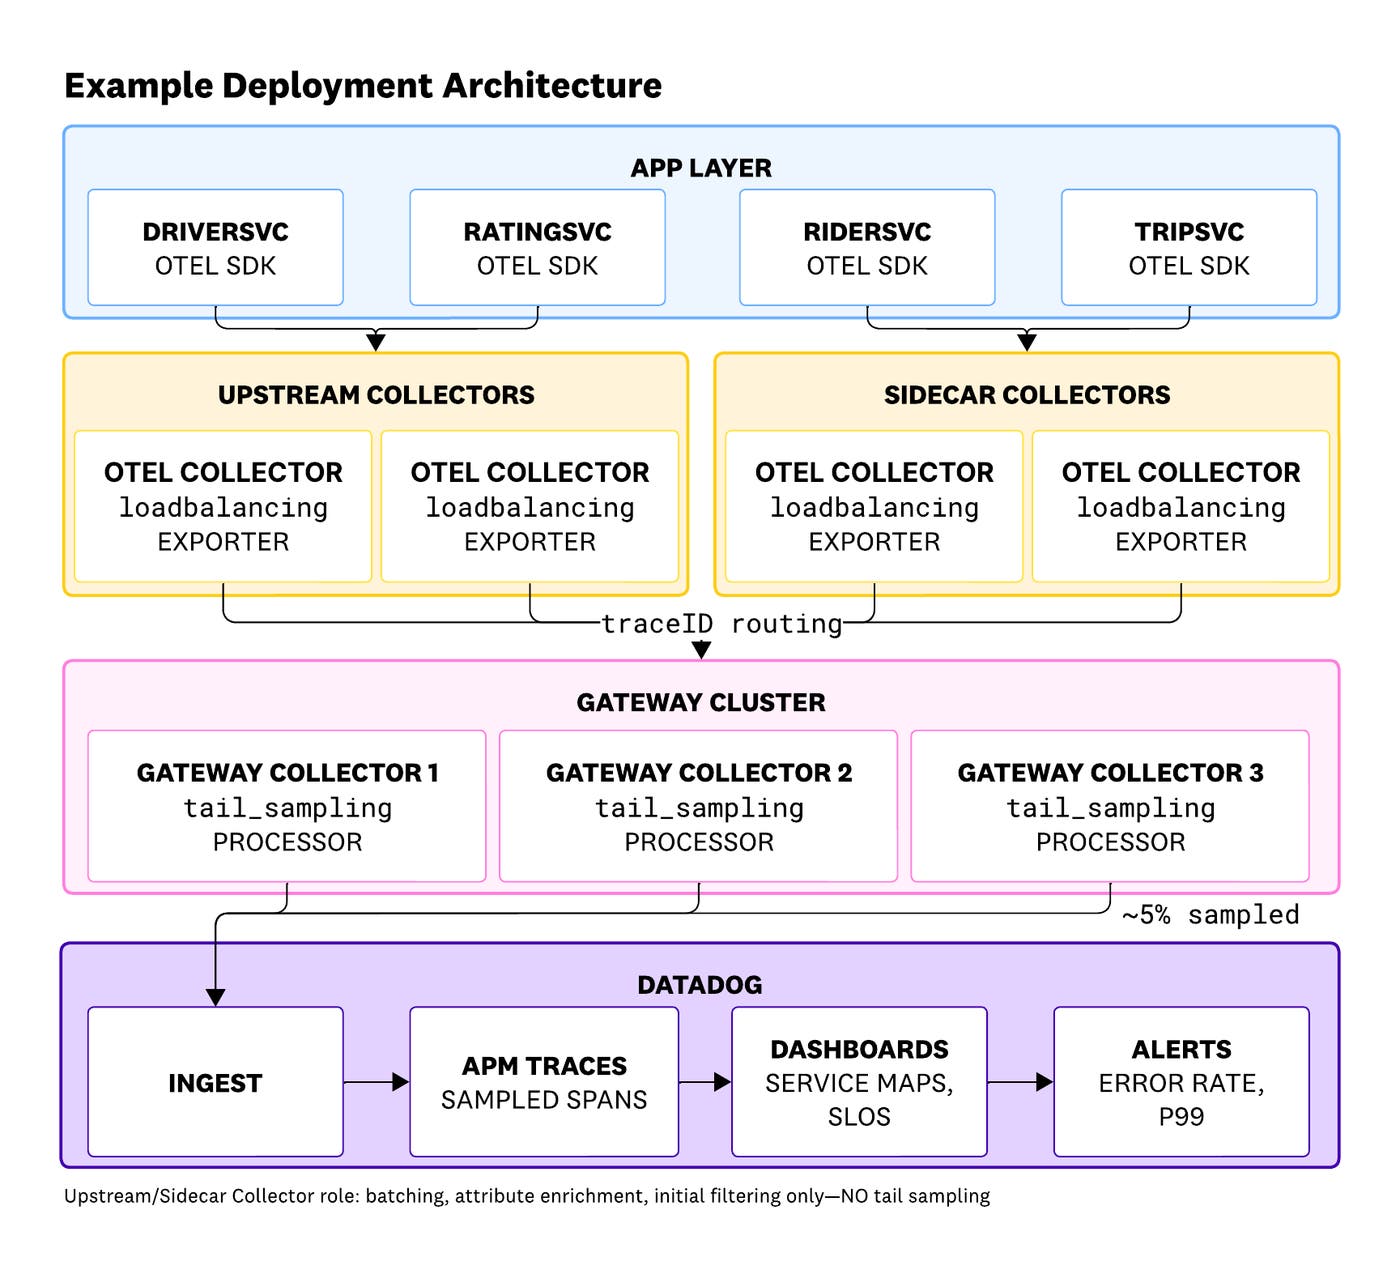
Understand the three stages of a collector pipeline
Every collector pipeline includes three types of components:
Receivers ingest telemetry over OTLP (gRPC and HTTP), Jaeger, Zipkin, Prometheus, Filelog, and more.
Processors modify and act on it. Common processors include
memory_limiter,attributes,filter,tail_sampling, andbatch.Exporters send it onward over OTLP, the Datadog exporter, or stdout for debugging.
A minimal traces pipeline that wires those together looks like this:
service: pipelines: traces: receivers: [otlp] processors: [memory_limiter, tail_sampling, batch] exporters: [otlp/datadog]Follow how the tail sampler makes a decision
The tail_sampling processor is stateful. For each trace, it:
Buffers all of the trace’s spans in memory until the trace appears complete. The
decision_waitperiod (default 30s) is the timeout before a decision is forced, even if more spans might still arrive.Evaluates policies against the assembled trace, inspecting status codes, request latency, service names, custom span attributes, and more.
Decides to keep or drop, and only then forwards the sampled spans downstream.
All spans for a trace must reach the same collector instance, or no instance ever holds the complete trace. With the collectors running and the rideshare app generating traffic, traces begin streaming into Datadog. Once sampling is enabled, dropped spans will never be sent to Datadog so the APM > Traces > Explorer view will no longer represent the full volume of traces hitting our services. Span Metrics provide a source of truth that remains constant with or without sampling.
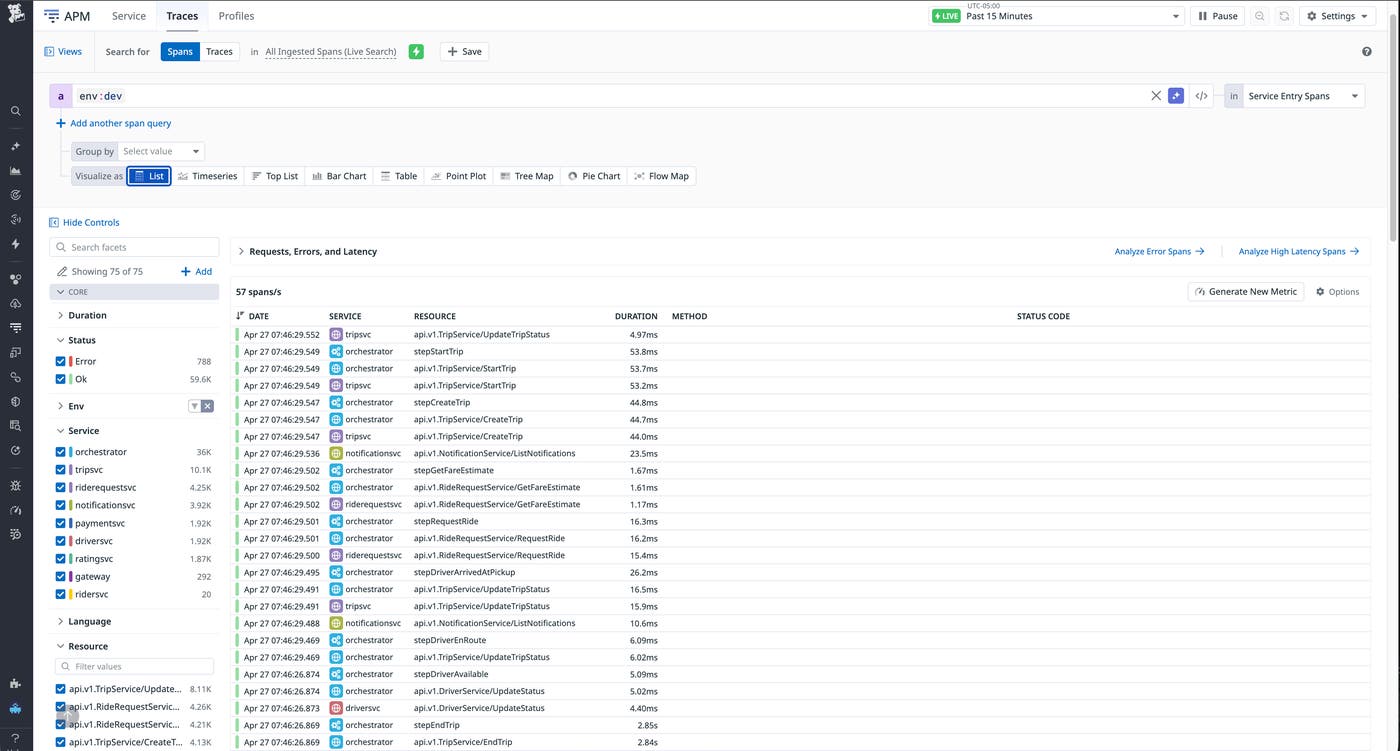
Keep service health accurate with Span Metrics computed before sampling
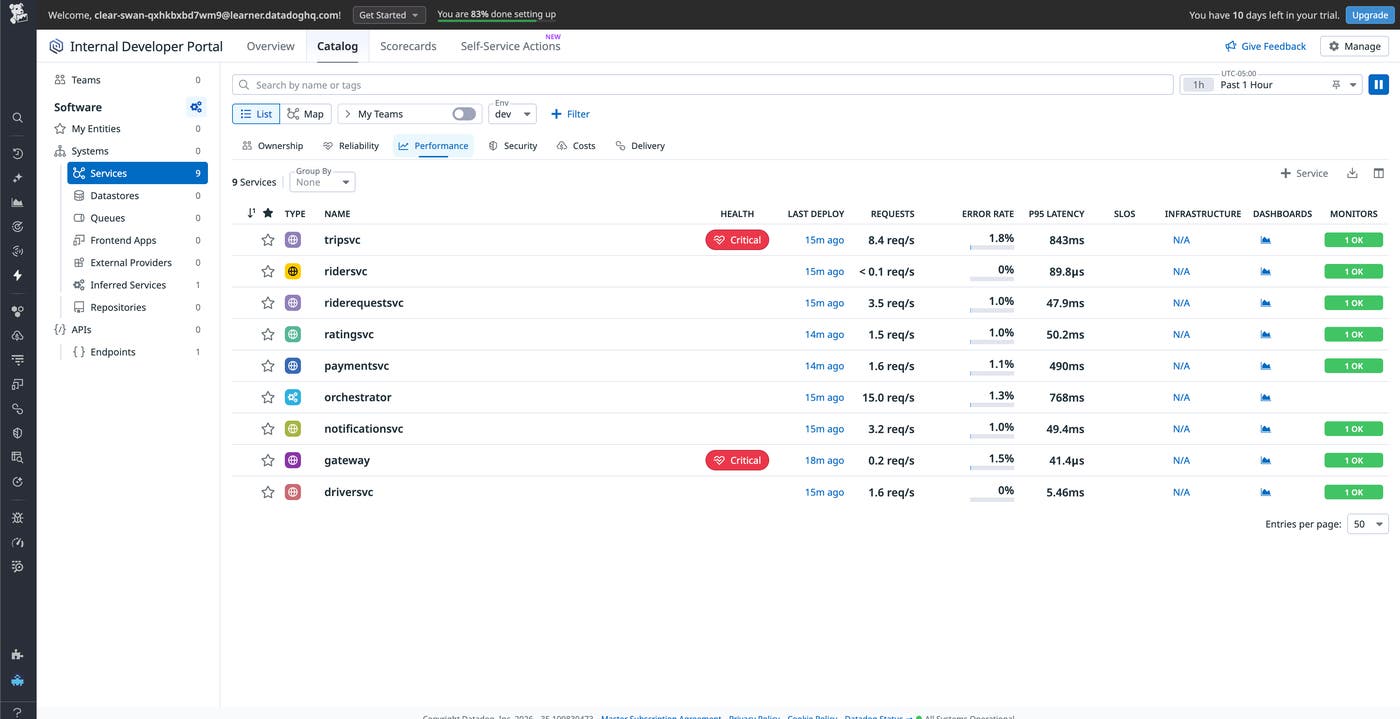
Span Metrics, also called RED metrics, capture requests, errors, and latency for each service. For those numbers to stay accurate, the collector must compute them on the full volume of spans before any sampling is applied.
Because Span Metrics are emitted to Datadog regardless of sampling, they power the Software Catalog and provide a complete view of service health across the incoming traffic.
Drill into a service such as tripsvc to see its full history of RED metrics, along with the Endpoints, Deployments, Traces, and Errors tabs. These views are populated from Span Metrics rather than sampled trace data.
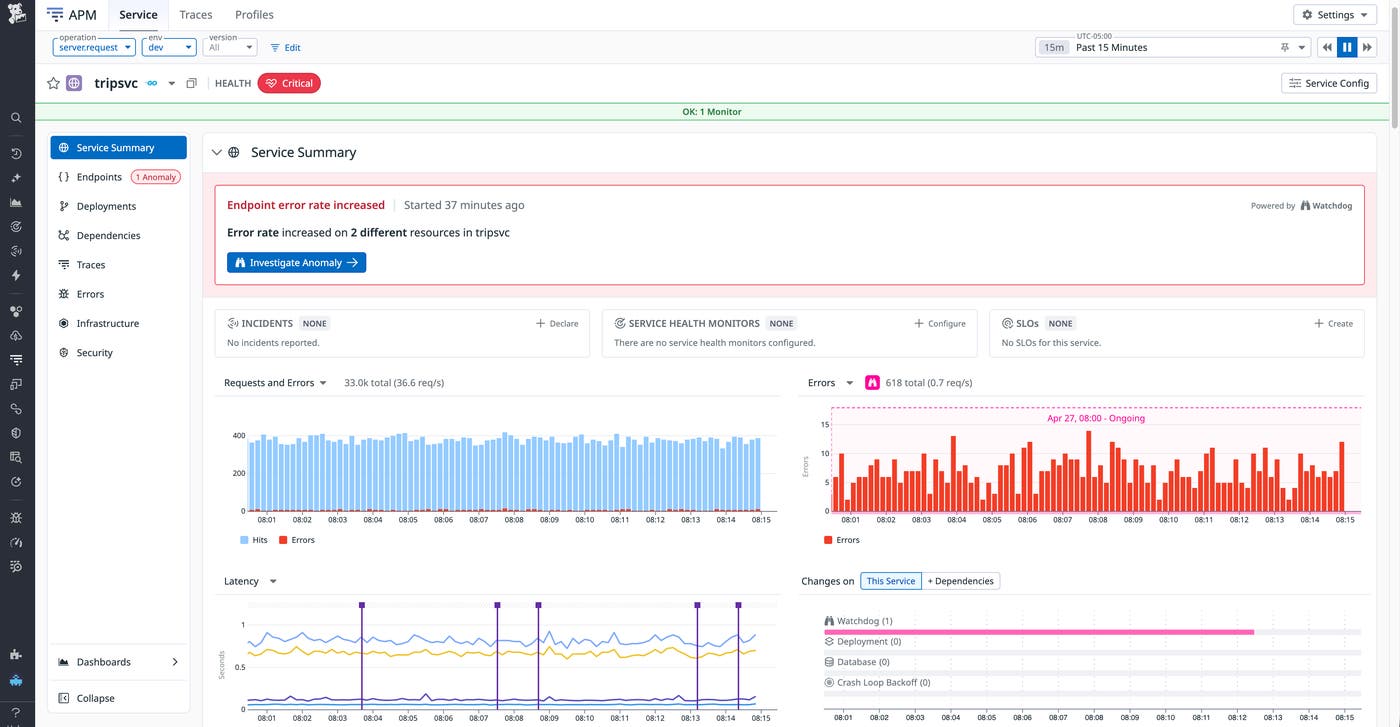
This separation of concerns is the foundation of the sampling strategy.
Use the Software Catalog and Service Page as the source of truth for service health, computed on 100% of traffic.
Use APM > Traces > Explorer to investigate specific traces that warrant attention.
To make this work, the gateway uses two trace pipelines instead of one.
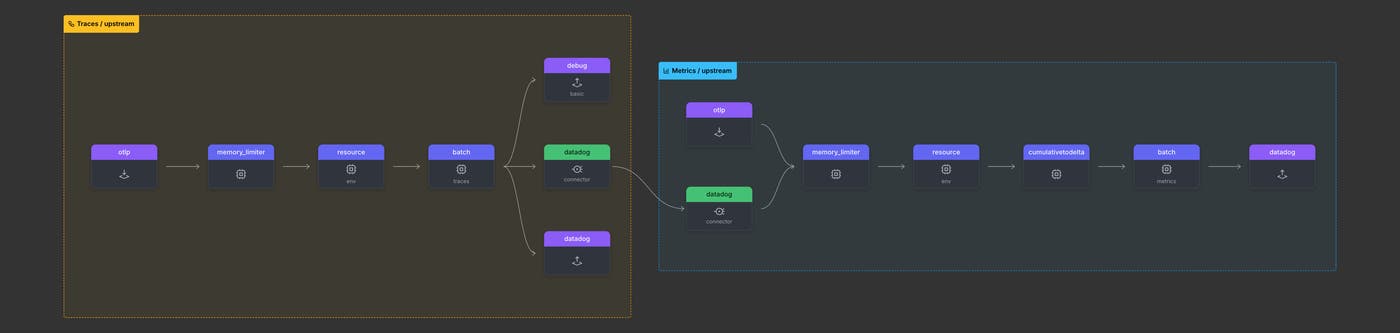
The traces/upstream pipeline receives all spans from upstream collectors and computes Span Metrics through the Datadog Connector. The traces/sampling pipeline receives spans from the Datadog Connector after metrics are computed, applies tail-sampling policies, and exports the sampled spans to Datadog:
traces/upstream: receivers: - otlp processors: - memory_limiter - resource/env - batch/traces exporters: - datadog/connector # compute span metrics on the FULL volume
traces/sampling: receivers: - datadog/connector # spans arrive here AFTER metrics are computed processors: - memory_limiter - tail_sampling - batch/traces exporters: - debug/basic - datadogSpan Metrics are computed on the full volume, and only the traces/sampling pipeline drops spans.
Add the tail-sampling processor with a baseline policy
With the pipelines in place, add the tail_sampling processor. Start deliberately simple, with a single catch-all probabilistic policy that keeps 5% of traces and drops the other 95%:
tail_sampling: decision_wait: 10s # how long to wait for additional spans before deciding num_traces: 50000 # number of traces held in memory policies: - name: policy_five_percent type: probabilistic probabilistic: {sampling_percentage: 5}Tune decision_wait to your average p99 latency: it sets how long the processor holds a trace before forcing a decision. Tune num_traces to expected peak traffic: It caps how many traces stay in memory at once.
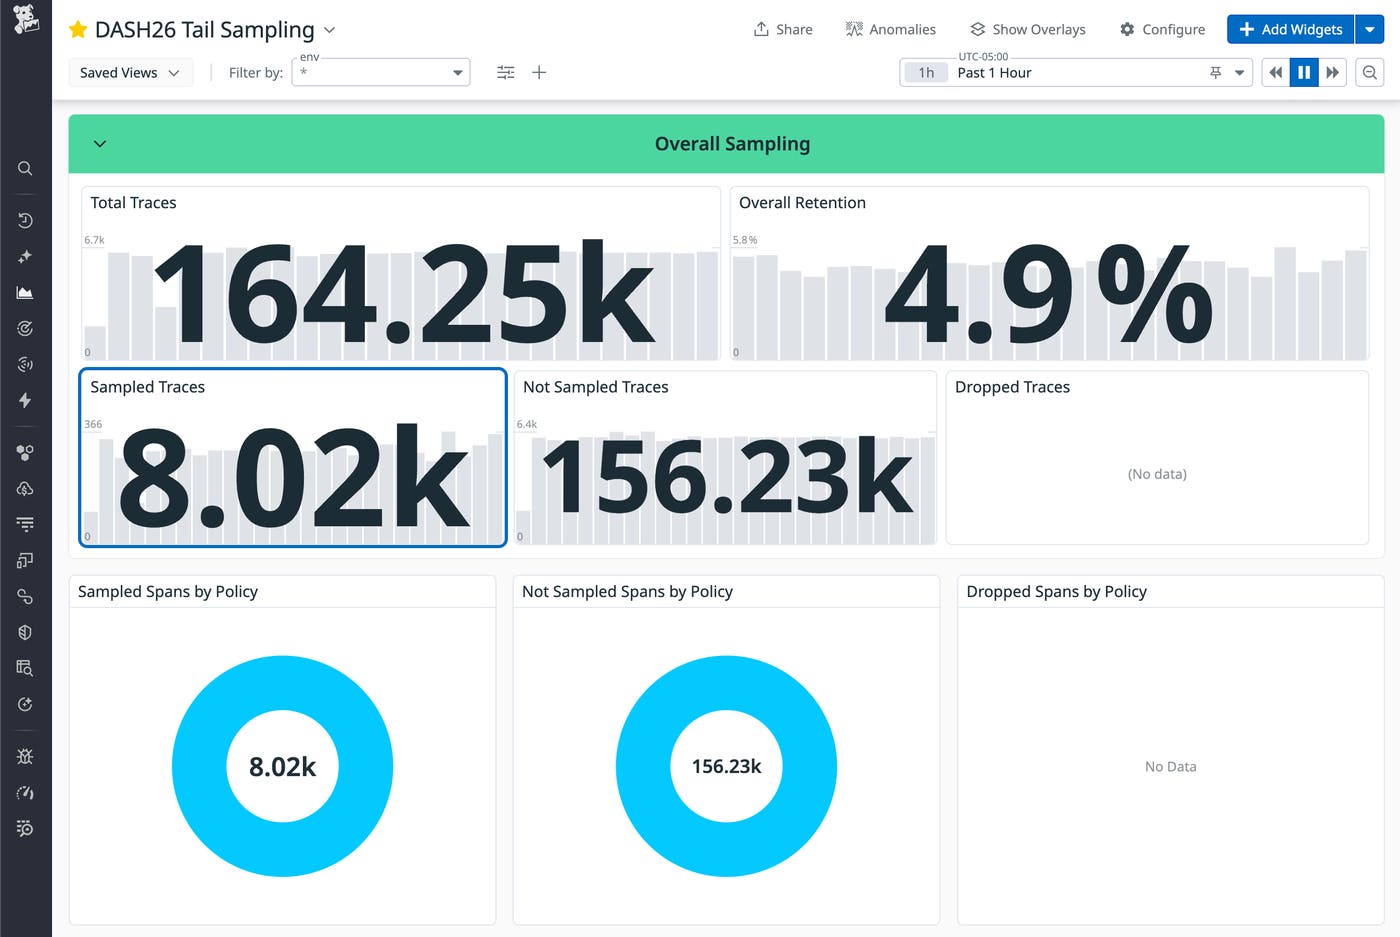
After restarting the gateway collectors, spans arrive in APM > Traces > Explorer at about 5% of the previous volume. A dedicated Tail Sampling dashboard, driven by the otelcol_processor_tail_sampling_count_traces_sampled metric, shows exactly what is retained per policy. Overall retention is about 5%.
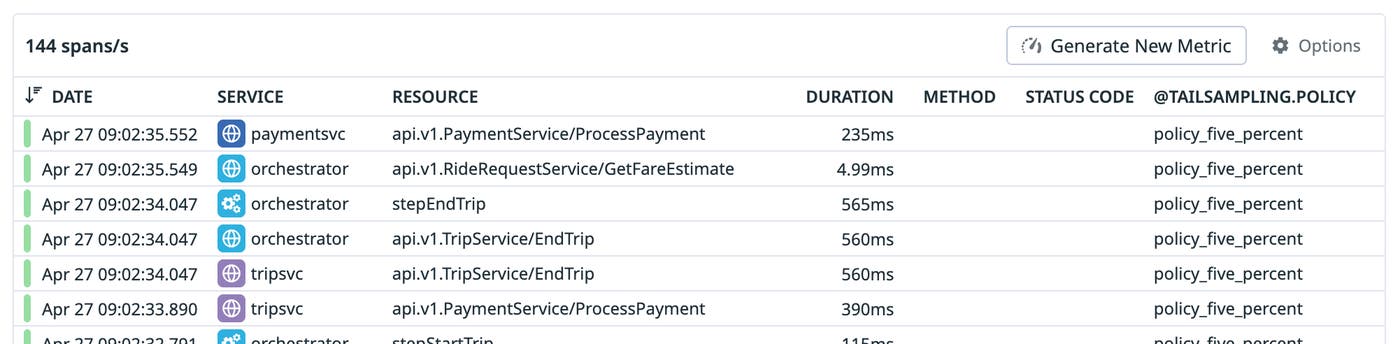
Each span carries a tailsampling.policy attribute recording the decision. You can promote it to a column to see which policy captured each trace.
Why probabilistic sampling is not enough
A flat 5% probabilistic policy treats a critical error trace the same as a routine success, so it can discard the very traces you most want to investigate. With only 5% of traces reaching Datadog, APM > Traces > Explorer becomes a narrowed view of error traces for tripsvc.
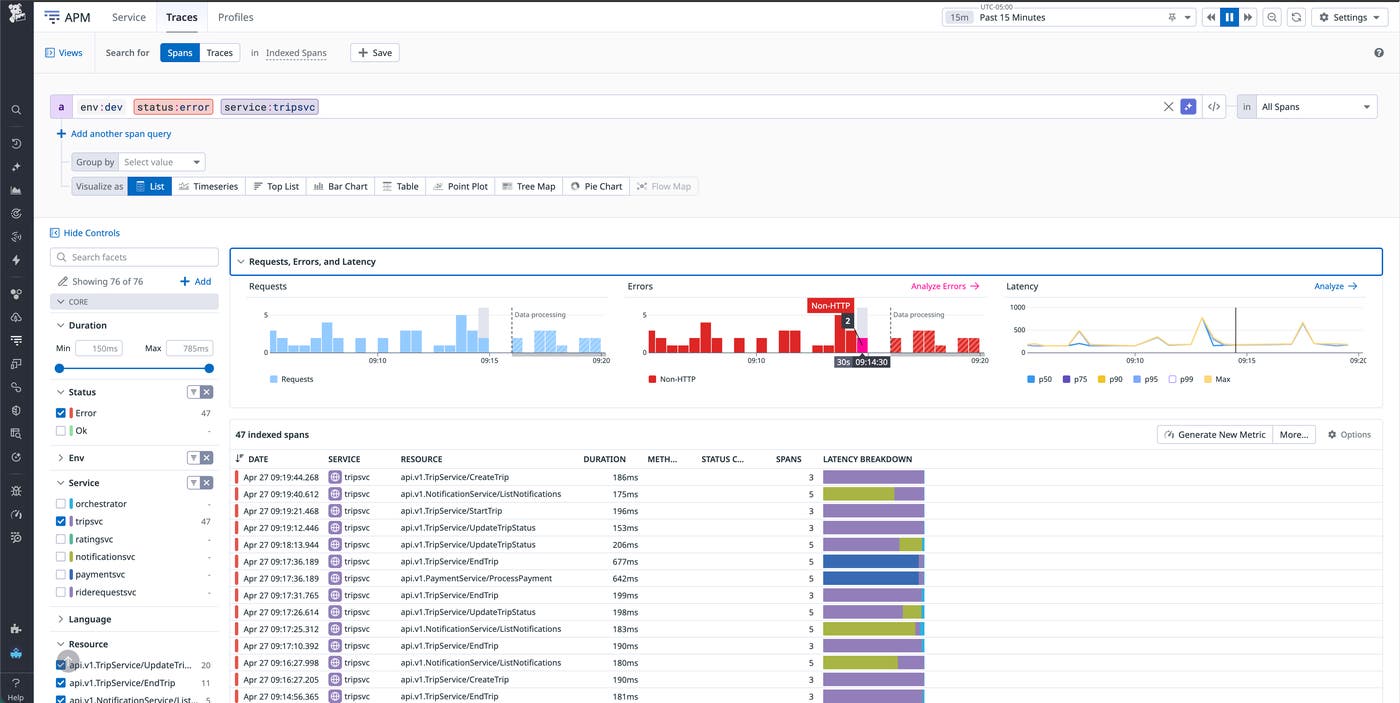
The Software Catalog Service Page, driven by Span Metrics on the full volume, shows far more errors over the same window.
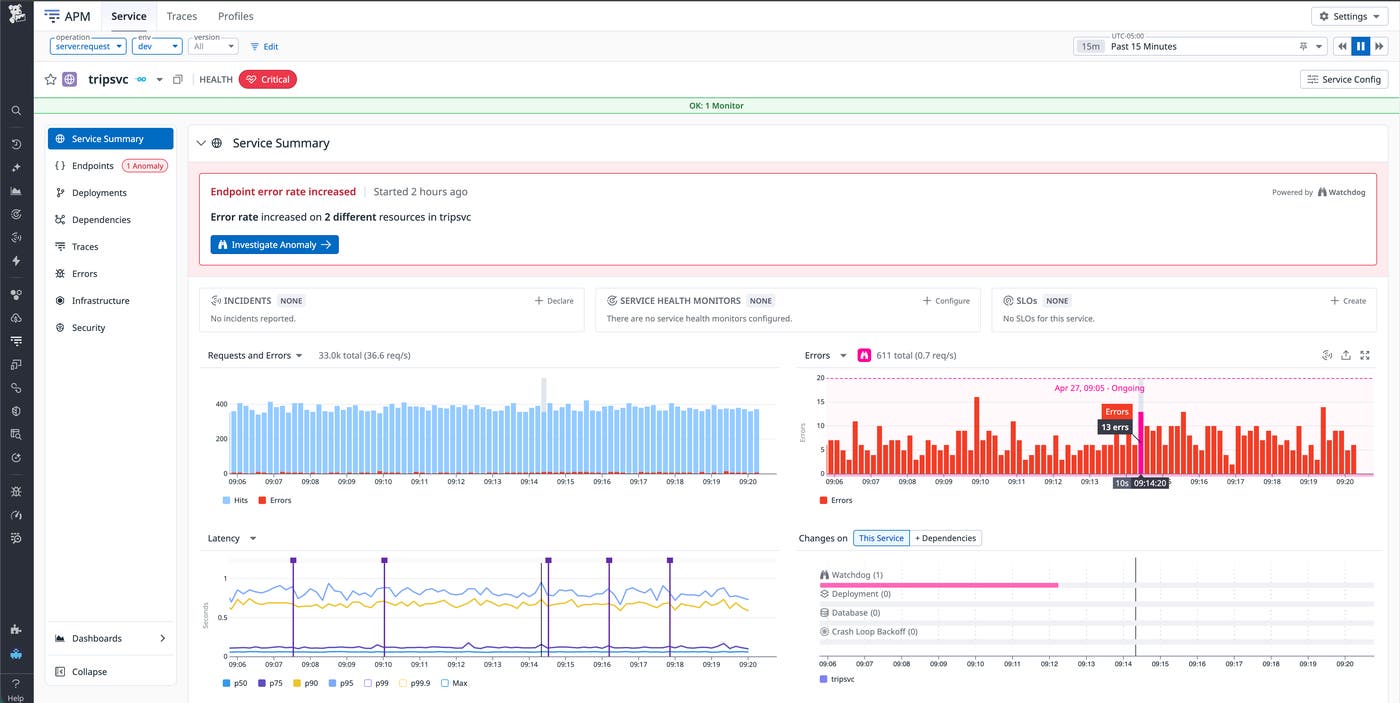
Use the Software Catalog and Service Page to evaluate service health, and use Traces Explorer to investigate the traces retained for analysis.
Sample only the traces worth keeping with targeted policies
Keep a trace if any of the following is true:
It contains an error.
Its latency exceeds a defined threshold.
It exceeds an expected rate limit.
It matches criteria useful for developer debugging.
If none of these conditions apply, let the trace fall through to the probabilistic baseline or drop it.
Order matters. Put the most specific, high-value policies first and leave the general fallback for last. Explicit drop policies take precedence. If a trace matches both a sample policy and a drop policy, the collector drops it.
Reach for the right policy type
The tail_sampling processor ships with a rich set of policy types. The following are the ones used more often in this configuration:
| Policy | What it does | Example |
|---|---|---|
| always_sample | Keep everything. Good for testing. | type: always_sample |
| status_code | Keep any trace where at least one span has a non-OK status, such as HTTP 5xx, gRPC errors, or anything marked ERROR. Adding UNSET also captures traces that never set OK, useful for catching implicit failures. | status_codes: [ERROR] |
| latency | Keys off the root span’s duration. Set the threshold at your SLO boundary, for example, your p99 target, so violations are captured automatically. | threshold_ms: 750 |
| string_attribute | Match traces by attribute values such as tenants, endpoints, or user IDs. | key: http.target, |
| probabilistic | Random sampling at a fixed rate. Use as a catch-all fallback. | sampling_percentage: 5 |
| and | Compose any policies into AND decision trees. | type: and
and_sub_policy: [...] |
Keep errors and slow traces first
Start by retaining every trace that exceeds the latency threshold and every error:
# Sample 100% of traces with a latency >= 750ms - name: policy_slow_response type: latency latency: {threshold_ms: 750}
# Sample 100% of traces with a status of ERROR - name: policy_error_status type: status_code status_code: {status_codes: [ERROR]}Drop the noise
Successful health checks can generate high trace volume while providing little diagnostic value. Drop them explicitly with an OTTL condition, using the drop policy type:
# Drop successful health check traces - name: policy_drop_health_checks type: drop drop: drop_sub_policy: - name: ottl_health_check type: ottl_condition ottl_condition: error_mode: ignore span: - |- ( IsMatch(attributes["http.target"], "^.*/(health|metrics|ping|prometheus)(?:/)?$") or IsMatch(attributes["http.path"], "^.*/(health|metrics|ping|prometheus)(?:/)?$") or IsMatch(attributes["http.route"], "^.*/(health|metrics|ping|prometheus)(?:/)?$") ) and (attributes["http.response.status_code"] == 200)Tame the heavy hitters
Uniform probabilistic sampling has a subtle failure mode. High-volume heavy-hitter services dominate the sampled output and drown out signals from smaller services. Before tuning, the 5% fallback still accounts for about half of the sampled output.
In the rideshare application, orchestrator and tripsvc generate the most traffic. Sample them at a lower 1% rate:
# Sample 1% of traces from high-volume services - name: policy_heavy_hitter_services type: and and: and_sub_policy: - name: service_name type: string_attribute string_attribute: { key: service.name, values: ["orchestrator", "tripsvc"] } - name: sample_one_percent type: probabilistic probabilistic: {sampling_percentage: 1}When one of these traces is not selected by the 1% policy, it can continue to the 5% fallback, which could still pick it up. Use invert_match to prevent that:
# Sample 5% of all traces EXCEPT the heavy hitters - name: policy_five_percent type: and and: and_sub_policy: - name: service_name type: string_attribute string_attribute: { key: service.name, values: ["orchestrator", "tripsvc"], invert_match: true, } - name: sample_five_percent type: probabilistic probabilistic: {sampling_percentage: 5}See the results
With targeted policies in place, the sampling mix shifts toward high-value traces. Over a representative window of 1.87 million total traces, the collector kept about 27,000 traces, did not sample 1.84 million, and dropped 3,550 health checks outright.
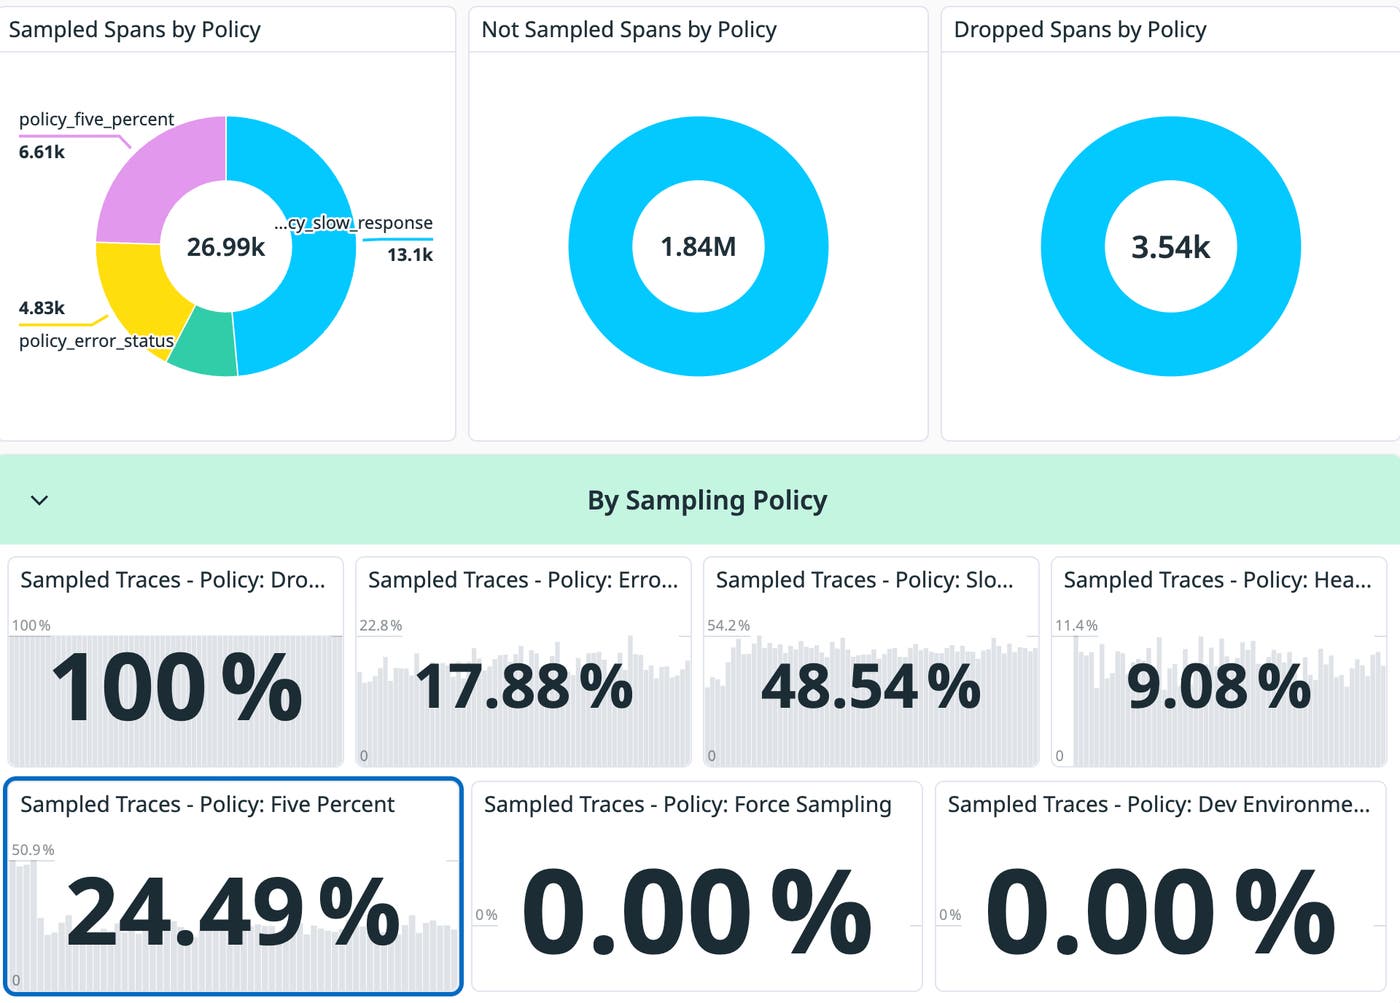
The traces that stayed are now meaningfully composed. Slow-response traces make up 48.5%, error traces 17.9%, heavy-hitter traces 9.1%, and probabilistic sampling 24.5%. The net result is 1.87 million traces reduced to about 27,000, a 98% reduction, with service health metrics fully intact.
Solve the developer experience problem tail sampling creates
Tail sampling cuts cost and noise, but it introduces real friction for developers. The problem is a black box: A developer instruments code, generates test traffic, and the trace never appears in the backend. Because tail sampling evaluates and drops traces at the collector level, you have no immediate feedback on whether a missing trace comes from faulty instrumentation, a misconfiguration, or an intentional policy.
Always sample the dev environment
Retain every trace from the dev environment so developers can validate their instrumentation without competing with production sampling policies:
# Always sample 100% of traces in the dev environment - name: policy_dev_environment type: string_attribute string_attribute: key: deployment.environment.name values: ["dev"] enabled_regex_matching: falseForce-sample a specific trace on demand
Sometimes you need to guarantee capture of one request you are actively debugging without changing collector config. A force_sample attribute makes that possible:
# Always sample traces with the `force_sample` attribute set - name: policy_force_sample type: string_attribute string_attribute: { key: force_sample, values: ["true"] }Developers can set this through code or the OTEL_RESOURCE_ATTRIBUTES environment variable, which attaches the key-value pairs as resource attributes on all emitted telemetry:
OTEL_RESOURCE_ATTRIBUTES="force_sample=true"To confirm which policy captured a given trace, open the span and read its tailsampling.policy attribute directly in the flame graph.
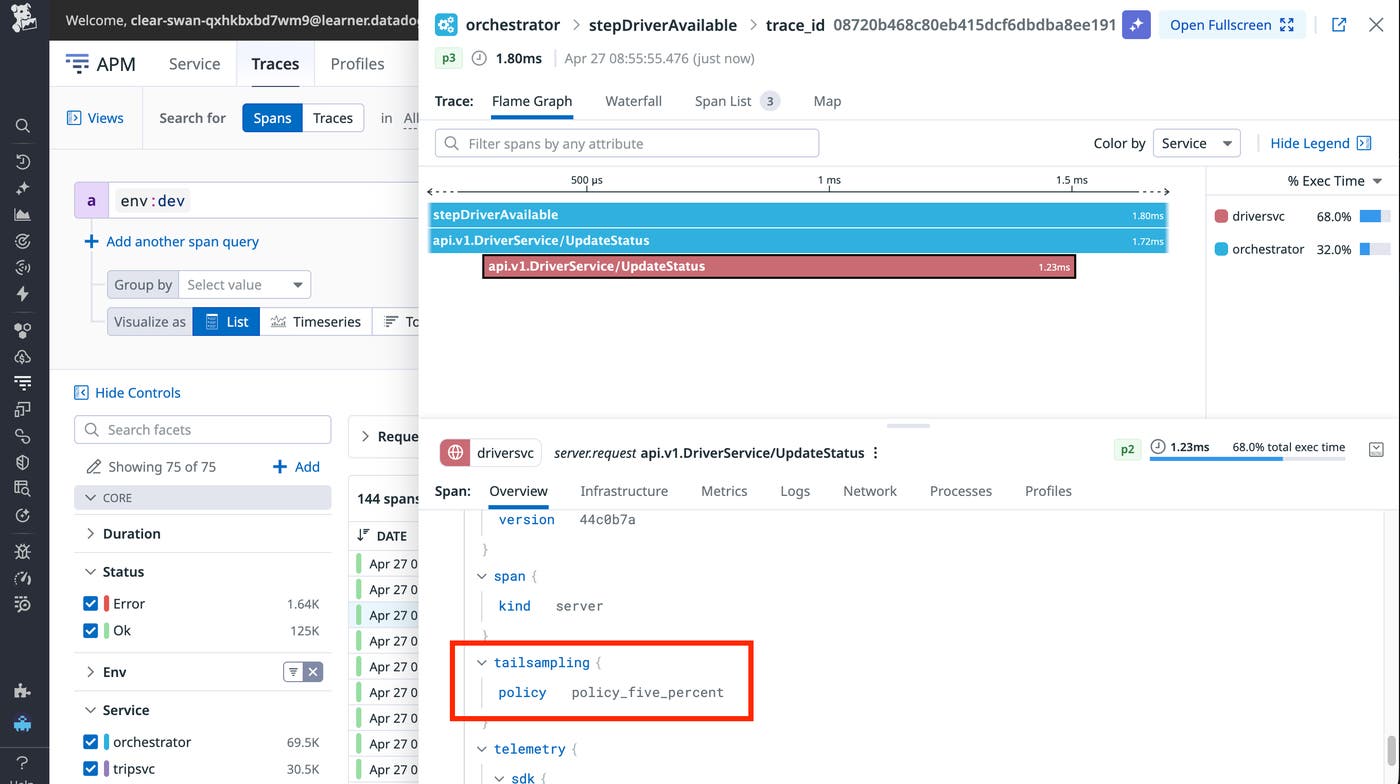
Understand why a drop decision can win
This is where evaluation order becomes important. Say you add policy_dev_environment, send a dev health-check request, and the trace still does not show up. Trace the request hop by hop, from Application to Upstream to Gateway to Datadog, using debug and detailed logging to inspect the payload at each stage. The trace arrives at the upstream collector with deployment.environment.name set to dev but never leaves the gateway.
The cause is a conflict between policy_drop_health_checks and policy_dev_environment. Per the Policy Decision Flow, the processor resolves conflicts with one firm rule: a drop decision always wins, regardless of any other policy. The dev health check matches both policies, so scope the drop policy to apply only outside dev:
- name: policy_drop_health_checks type: drop drop: drop_sub_policy: - name: ottl_health_check type: ottl_condition ottl_condition: error_mode: ignore span: - |- ( IsMatch(attributes["http.target"], "^.*/(health|metrics|ping|prometheus)(?:/)?$") or IsMatch(attributes["http.path"], "^.*/(health|metrics|ping|prometheus)(?:/)?$") or IsMatch(attributes["http.route"], "^.*/(health|metrics|ping|prometheus)(?:/)?$") ) and (attributes["http.response.status_code"] == 200) and (resource.attributes["deployment.environment.name"] != "dev")After restarting, the dev health check appears with tailsampling.policy set to policy_dev_environment.
tailsampling.policy: Str(policy_dev_environment)When policies overlap, check their decision semantics and use collector logging to follow an expected trace through the pipeline.
Assemble a production-ready policy stack
A production-ready policy stack layers from most specific to least, because the first match wins and a drop always wins:
Retain 100% of ERROR traces.
Retain 100% of traces above the 750 ms latency threshold.
Retain critical paths such as /checkout.
Sample other healthy traffic at 5%.
Explicitly drop low-value traffic such as successful health checks.
In the rideshare example, the completed policy stack reduces retained trace volume by about 98% while preserving the traces selected by the error and latency policies.
Tune the collector for memory and performance
Tail sampling is memory-hungry. The collector holds every in-flight trace in memory until it makes a decision. Size your buffers deliberately using these settings:
processors: tail_sampling: decision_wait: 30s # how long to buffer before deciding num_traces: 50000 # max traces in memory at once expected_new_traces_per_sec: 100
memory_limiter: check_interval: 1s limit_mib: 1500 # hard ceiling — triggers backpressure spike_limit_mib: 512Use the following as a rough memory sizing guide:
| Spans/sec | Estimated memory |
|---|---|
| 1,000 | ~200 MB |
| 5,000 | ~800 MB |
| 10,000 | ~1.5 GB |
| 25,000 | ~4 GB |
Operational best practices:
Monitor the
otelcol_processor_tail_sampling_*metrics in Datadog.Alert on
otelcol_processor_refused_spans> 0, a sign of memory pressure.Scale horizontally, since more collector pods means more buffer capacity.
Tune
decision_waitdown to 10–15s if your traces are short-lived.
Weigh the trade-offs before you roll out
Tail sampling adds memory requirements, trace-ID routing, export latency, and ongoing policy tuning.
| Challenge | Mitigation |
|---|---|
| Memory pressure. Buffering millions of spans per node demands careful resource planning, and the collector can run out of memory under sudden spikes. | Start with errors and latency. These two policies alone remove 80–90% of noise with no risk of dropping important traces. |
| Routing complexity. Trace-ID routing needs a dedicated load-balancer layer, and a misconfiguration produces split traces and wrong decisions. | Use probabilistic as a fallback. Always keep 1–5% of healthy traces to preserve baseline visibility. |
Added latency. Decisions are delayed by decision_wait, so spans are not forwarded until the window closes. | Monitor buffer metrics and alert on decision-timer latency and dropped spans. |
| Policy tuning. Thresholds need iterative tuning, since too strict misses issues and too loose defeats the purpose. | Dry-run first. Emit tailsampling.policy as a span attribute to observe decisions before you start dropping anything. |
Tail-based sampling in the OTel Collector lets you cut trace volume and cost while keeping every trace worth investigating. A gateway deployment, Span Metrics computed before sampling, and ordered targeted policies keep service health accurate even as ingest drops about 98%. Start with error and latency policies, add a probabilistic fallback, and layer in developer and drop policies as you learn your traffic.
The full collector configs, the rideshare app, and the dashboards are available as a hands-on workshop and source repository. For deeper reference, see the OTel tail sampling processor documentation and the Datadog OTel deployment patterns guide.
If you’re not already a Datadog customer, sign up for a free 14-day trial to correlate Span Metrics and sampled traces in one place.
