David M. Lentz
In Part 1 of this series, we looked at the important metrics to monitor when you’re running ECS or EKS on AWS Fargate. In Part 2 we showed you how to use Amazon CloudWatch and other tools to collect those metrics plus logs from your application containers.
Fargate’s serverless container platform helps users deploy and manage ECS and EKS applications, but the dynamic nature of containers makes them challenging to monitor. Datadog helps you automatically track your applications, container orchestrators, and the ephemeral Fargate infrastructure that supports it all. In this post, we’ll show you how to:
- Integrate your AWS environment with Datadog
- View traces and analyze APM data
- Collect and analyze logs from your containerized applications on Fargate
- Explore and alert on your monitoring data
Enable integrations and deploy the Agent
To begin monitoring ECS or EKS clusters on Fargate, you’ll need to enable and configure the necessary integrations. For ECS, this means setting up the AWS integration. To monitor EKS on Fargate, enable the Kubernetes integration.
Both ECS and EKS work with many other AWS services, so it’s helpful to also configure those services for monitoring. Follow our simple 1-click installation to enable the AWS integration if you haven’t already. Then navigate to the Configuration tab on the AWS integration tile and select the services to monitor from the Limit metric collection by AWS Service list. If any of your workloads are running on EC2, check the EC2 box to collect instance-level metrics.
Once you have set up the integration, Datadog will begin to collect CloudWatch metrics and events emitted by the AWS services you’re using. To get even deeper visibility into your ECS and EKS clusters on Fargate, you’ll need to deploy the Datadog Agent—the open source software that allows you to collect container-level data from your ECS tasks and EKS pods. The Agent collects data from the ECS task metadata endpoint so you can visualize and alert on the health and performance of your clusters. In EKS clusters, the Agent collects Kubernetes data from your pods, and monitors the amount of Fargate compute resources used by your containers. The Agent also provides Autodiscovery to make it easy to monitor your containerized infrastructure. In this section, we’ll walk through the processes for deploying the Agent on ECS and EKS.
Deploy the Agent on ECS
To monitor your ECS tasks with Datadog, you need to add labels to your application container definition so the Agent can automatically discover your application and configure it for monitoring. When you’re running your ECS tasks on Fargate, you also need to add the Agent to your task as a sidecar—an additional container that operates alongside your application container.
The code sample below shows an excerpt of an ECS task definition that specifies two containers. The first is an application container named redis. This container’s dockerLabels element applies labels that enable the Agent’s Autodiscovery capabilities. Based on these labels, the Agent knows to run the Redis check on this container.
The second container is datadog-agent—the sidecar that runs a containerized version of the Agent. To enable Fargate monitoring, you need to set the ECS_FARGATE environment variable to true and populate the DD_API_KEY variable with your Datadog API key.
"containerDefinitions": [ { "name": "redis", "image": "redis:latest", "dockerLabels": { "com.datadoghq.ad.instances": "[{\"host\": \"%%host%%\", \"port\": 6379}]", "com.datadoghq.ad.check_names": "[\"redisdb\"]", "com.datadoghq.ad.init_configs": "[{}]" } },
{ "name": "datadog-agent", "image": "public.ecr.aws/datadog/agent:latest", "environment": [ { "name": "DD_API_KEY", "value": "<MY_DATADOG_API_KEY>" }, { "name": "ECS_FARGATE", "value": "true" } ] }]When you run this task in your cluster, Datadog will begin monitoring your Redis container and you’ll see ECS metrics in your Datadog account showing you the CPU, memory, disk, and network usage of your ECS Fargate cluster. Later in this post, we’ll walk you through how to visualize and analyze your ECS metrics with dashboards.
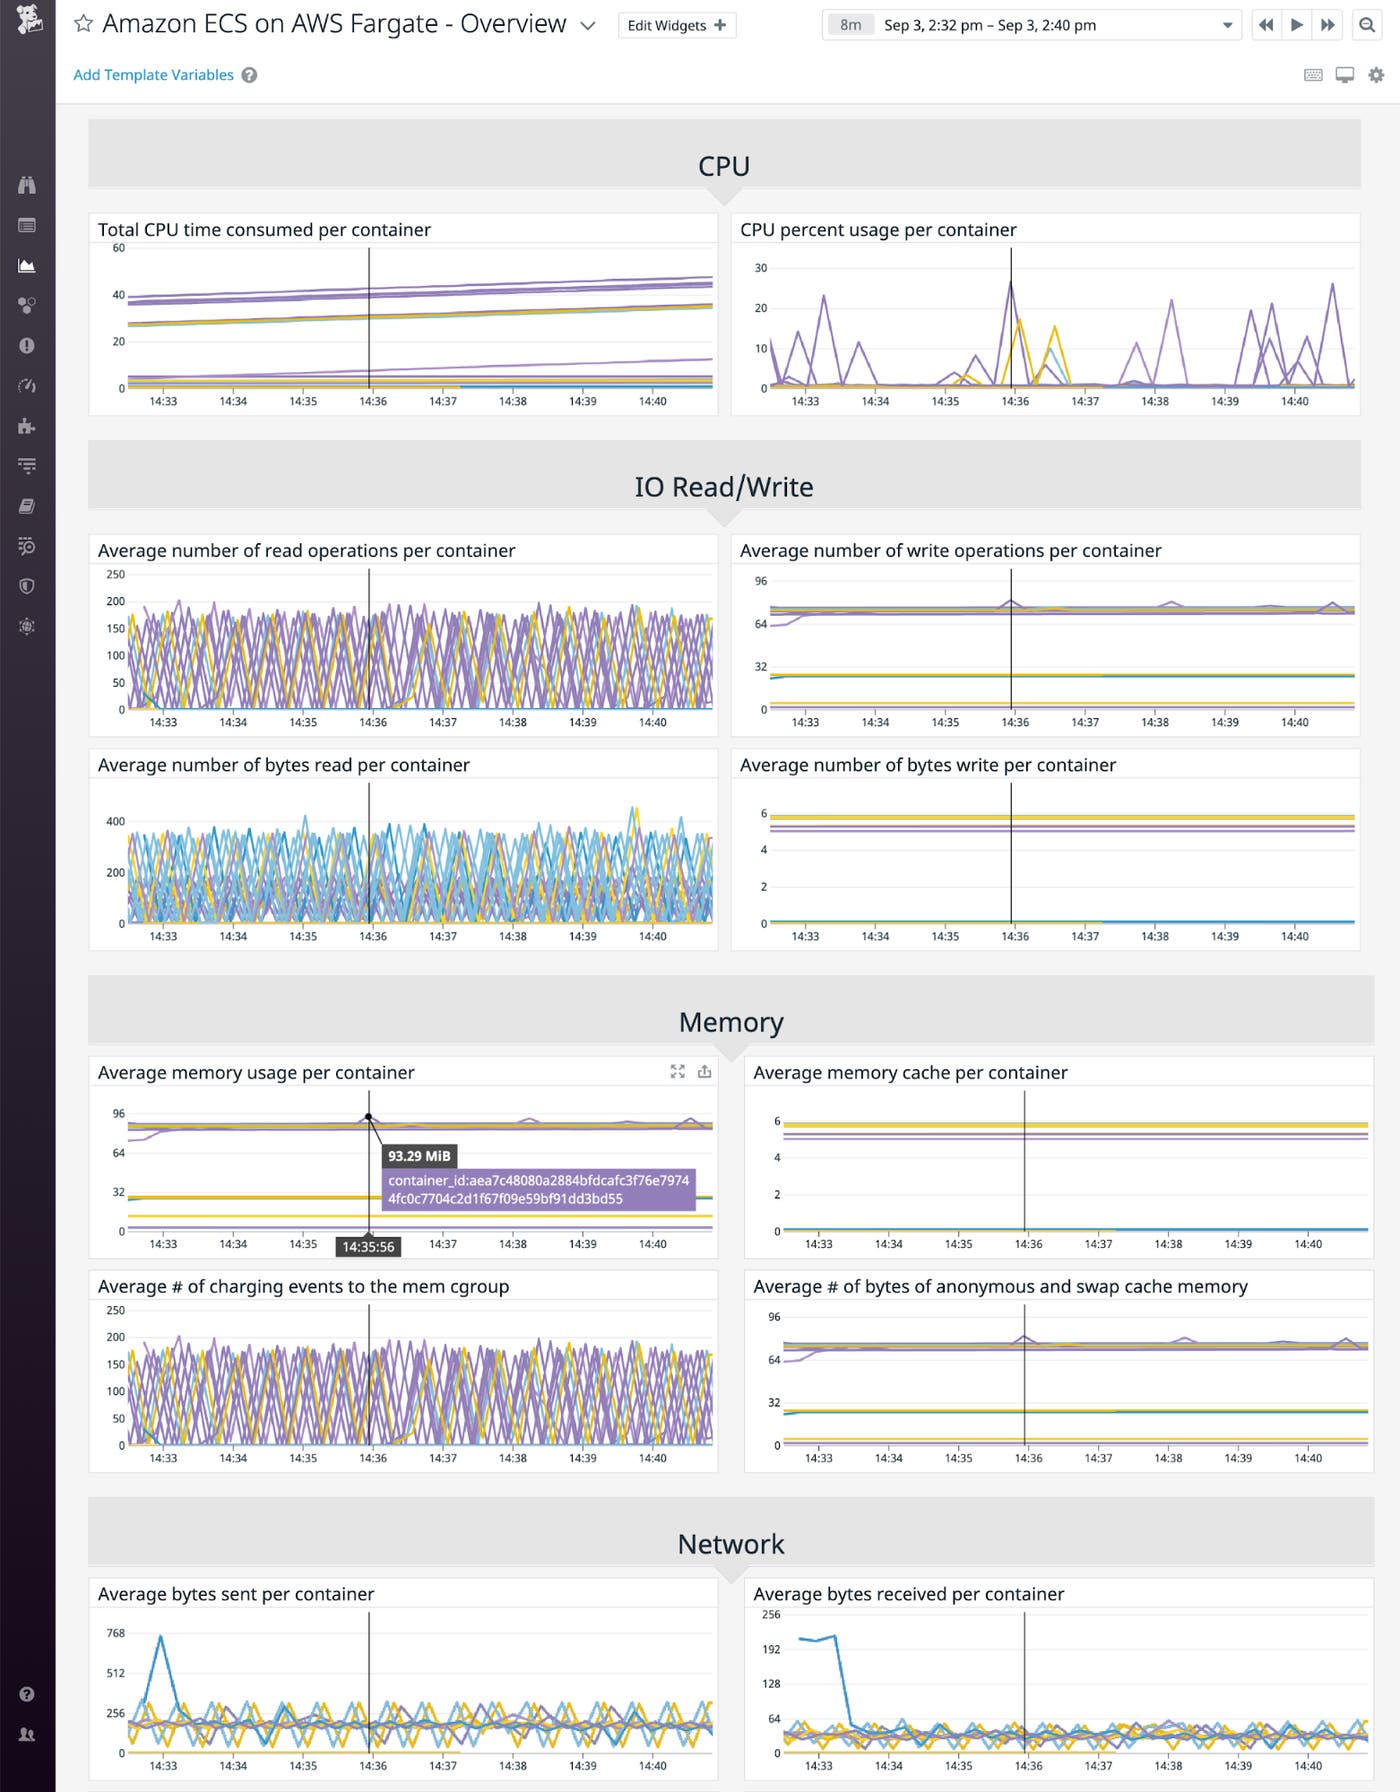
For more information about ECS on Fargate monitoring, see our documentation.
Deploy the Agent on EKS
To install the Kubernetes integration, visit the integration tile and click Configuration, then Install Integration. Next, you’re ready to deploy the Agent and begin monitoring your EKS cluster. The Agent collects the key metrics we identified in Part 1 of this series—including the CPU and memory usage of your Fargate compute resources—as well as distributed traces that can highlight errors and bottlenecks deep in your application. In this section, we’ll walk through how to deploy the Agent into your EKS cluster.
First, deploy the Metrics Server using the command below:
kubectl apply -f https://github.com/kubernetes-sigs/metrics-server/releases/download/v0.3.6/components.yamlThe Agent requires appropriate permissions to monitor your EKS cluster. You’ll need to apply the datadog-eks-rbac.yaml manifest—shown below—in order to create the necessary ClusterRole and ClusterRoleBinding objects.
apiVersion: rbac.authorization.k8s.io/v1kind: ClusterRolemetadata: name: datadog-agentrules: - apiGroups: - "" resources: - nodes/metrics - nodes/spec - nodes/stats - nodes/proxy - nodes/pods - nodes/healthz verbs: - get---apiVersion: rbac.authorization.k8s.io/v1kind: ClusterRoleBindingmetadata: name: datadog-agentroleRef: apiGroup: rbac.authorization.k8s.io kind: ClusterRole name: datadog-agentsubjects: - kind: ServiceAccount name: datadog-agent namespace: default---apiVersion: v1kind: ServiceAccountmetadata: name: datadog-agent namespace: defaultApply this RBAC configuration to your cluster:
kubectl apply -f datadog-eks-rbac.yamlNext, create a Deployment that contains your application container and the Datadog Agent as a sidecar. The example code below includes annotations that allow the Agent’s Autodiscovery feature to find the containerized application and apply the NGINX integration configuration. The env section of this manifest includes two required environment variables: one to store your Datadog API key (DD_API_KEY) and another to enable Fargate monitoring (EKS_FARGATE).
apiVersion: apps/v1kind: Deploymentmetadata: name: nginx-demo-fargate namespace: defaultspec: replicas: 1 selector: matchLabels: app: "nginx-demo-fargate" template: metadata: labels: app: "nginx-demo-fargate" name: "nginx-demo-fargate-pod" annotations: ad.datadoghq.com/nginx-demo-ctr.check_names: '["nginx"]' ad.datadoghq.com/nginx-demo-ctr.init_configs: '[{}]' ad.datadoghq.com/nginx-demo-ctr.instances: '[{"nginx_status_url": "http://%%host%%:81/nginx_status/"}]' spec: serviceAccountName: datadog-agent shareProcessNamespace: true volumes: - name: "config" configMap: name: "nginxconfig" containers: - name: nginx-demo-ctr image: nginx resources: limits: cpu: "2" requests: cpu: "1.5" ports: - containerPort: 81 volumeMounts: - name: "config" mountPath: "/etc/nginx/nginx.conf" subPath: "nginx.conf" ## Running the Agent as a sidecar - image: public.ecr.aws/datadog/agent:latest name: datadog-agent env: - name: DD_API_KEY value: "<MY_DATADOG_API_KEY>" ## Set DD_SITE to "datadoghq.eu" to send your ## Agent data to the Datadog EU site - name: DD_SITE value: "datadoghq.com" - name: DD_EKS_FARGATE value: "true" - name: DD_KUBERNETES_KUBELET_NODENAME valueFrom: fieldRef: apiVersion: v1 fieldPath: spec.nodeName resources: requests: memory: "512Mi" cpu: "800m" limits: memory: "512Mi" cpu: "800m"---apiVersion: v1data: nginx.conf: |+ events {} http { server { listen 81; server_name localhost; location /nginx_status { stub_status on; access_log off; allow all; } } }kind: ConfigMapmetadata: name: nginxconfig namespace: defaultCreate this Deployment in your EKS cluster:
kubectl apply -f nginx-with-datadog-agent.yamlOnce EKS is finished creating the Deployment, Datadog will begin monitoring your NGINX container and your EKS pods running on Fargate. Later in this post, we’ll show you how Datadog dashboards allow you to explore and analyze your metrics.
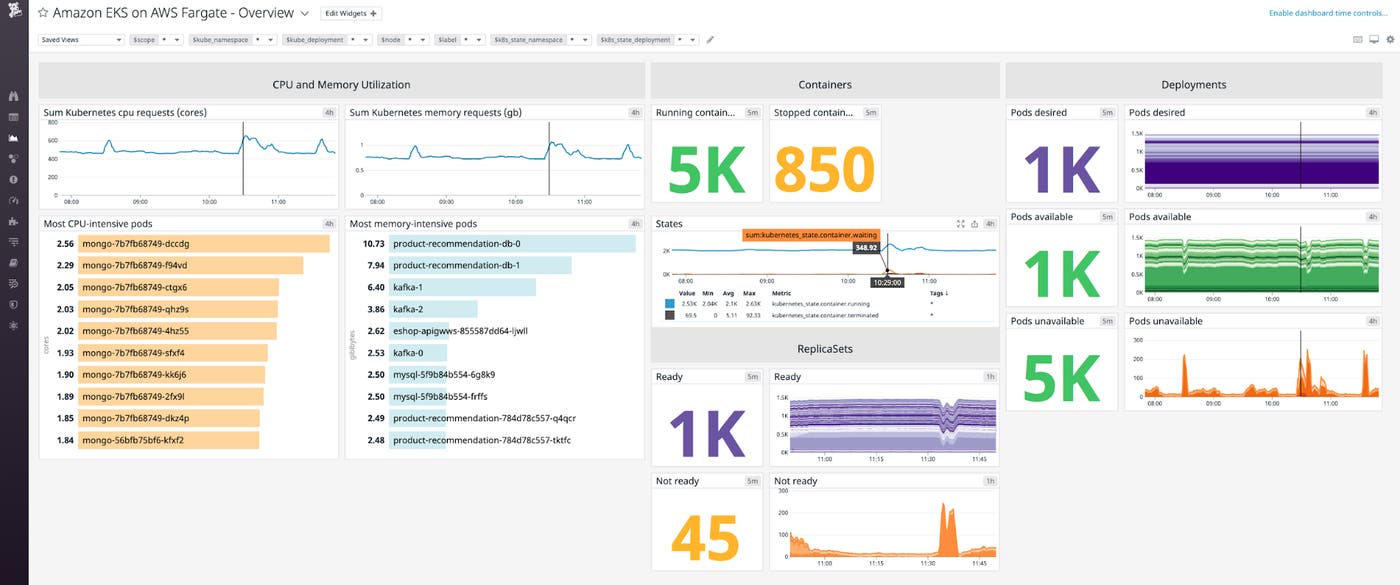
To monitor the state of your EKS cluster, you can enable the Cluster Checks Runner to collect metrics from the kube-state-metrics service. The Cluster Checks Runner is a Datadog Agent that you launch as a Deployment to monitor the services in your Kubernetes cluster. It doesn’t need access to the hosts that run your pods, so it works well with Fargate. See the documentation for information on setting up the Cluster Checks Runner.
See the Datadog EKS Fargate documentation to learn more, including how to collect events from your cluster.
View traces and analyze APM data
Because containerized infrastructure is complex and ephemeral, it can be hard to spot the source of errors and latency that degrade the performance of your application. Datadog distributed tracing and APM allows you to visualize dependencies among your services so you can quickly find bottlenecks and troubleshoot performance problems. In this section, we’ll walk you through setting up APM for ECS and EKS, and then we’ll show you how to visualize your trace data.
Collect distributed traces from ECS
To begin collecting distributed traces and APM data from your ECS tasks on Fargate, you need to allow the Agent to communicate on the container’s port 8126 and add the DD_APM_ENABLED and DD_APM_NON_LOCAL_TRAFFIC environment variables to the Agent container definition:
"containerDefinitions": [ { "name": "datadog-agent", "image": "public.ecr.aws/datadog/agent:latest", "portMappings": [ { "hostPort": 8126, "protocol": "tcp", "containerPort": 8126 } ], "environment": [ { "name": "DD_APM_ENABLED", "value": "true" }, { "name": "DD_APM_NON_LOCAL_TRAFFIC", "value": "true" } ] }See the documentation for more information about setting up distributed tracing and APM for ECS on Fargate.
Collect distributed traces from EKS
To begin collecting distributed traces and APM data from your EKS cluster, first make sure you’ve added the Agent as a sidecar in your application pods. (If you’re receiving EKS metrics, you can be sure the Agent is deployed successfully.) Next you’ll need to modify your Agent container’s manifest to add the DD_APM_ENABLED environment variable and a port definition to allow incoming trace data, as shown below.
ports: - containerPort: 8126 name: traceport protocol: TCP env: - name: DD_APM_ENABLED value: "true"See the documentation for more information about setting up distributed tracing and APM for EKS on Fargate.
Visualize your APM data
Datadog APM gives you important details about the performance of your services and their dependencies. In this section, we’ll show you how to visualize your APM data with flame graphs and the Service Map.
The flame graph
Datadog displays your distributed trace data as a flame graph—a visualization that shows you all the service calls that make up a single request. Flame graphs make it easy to spot latency and errors, and to drill down to explore the cause of a problem.
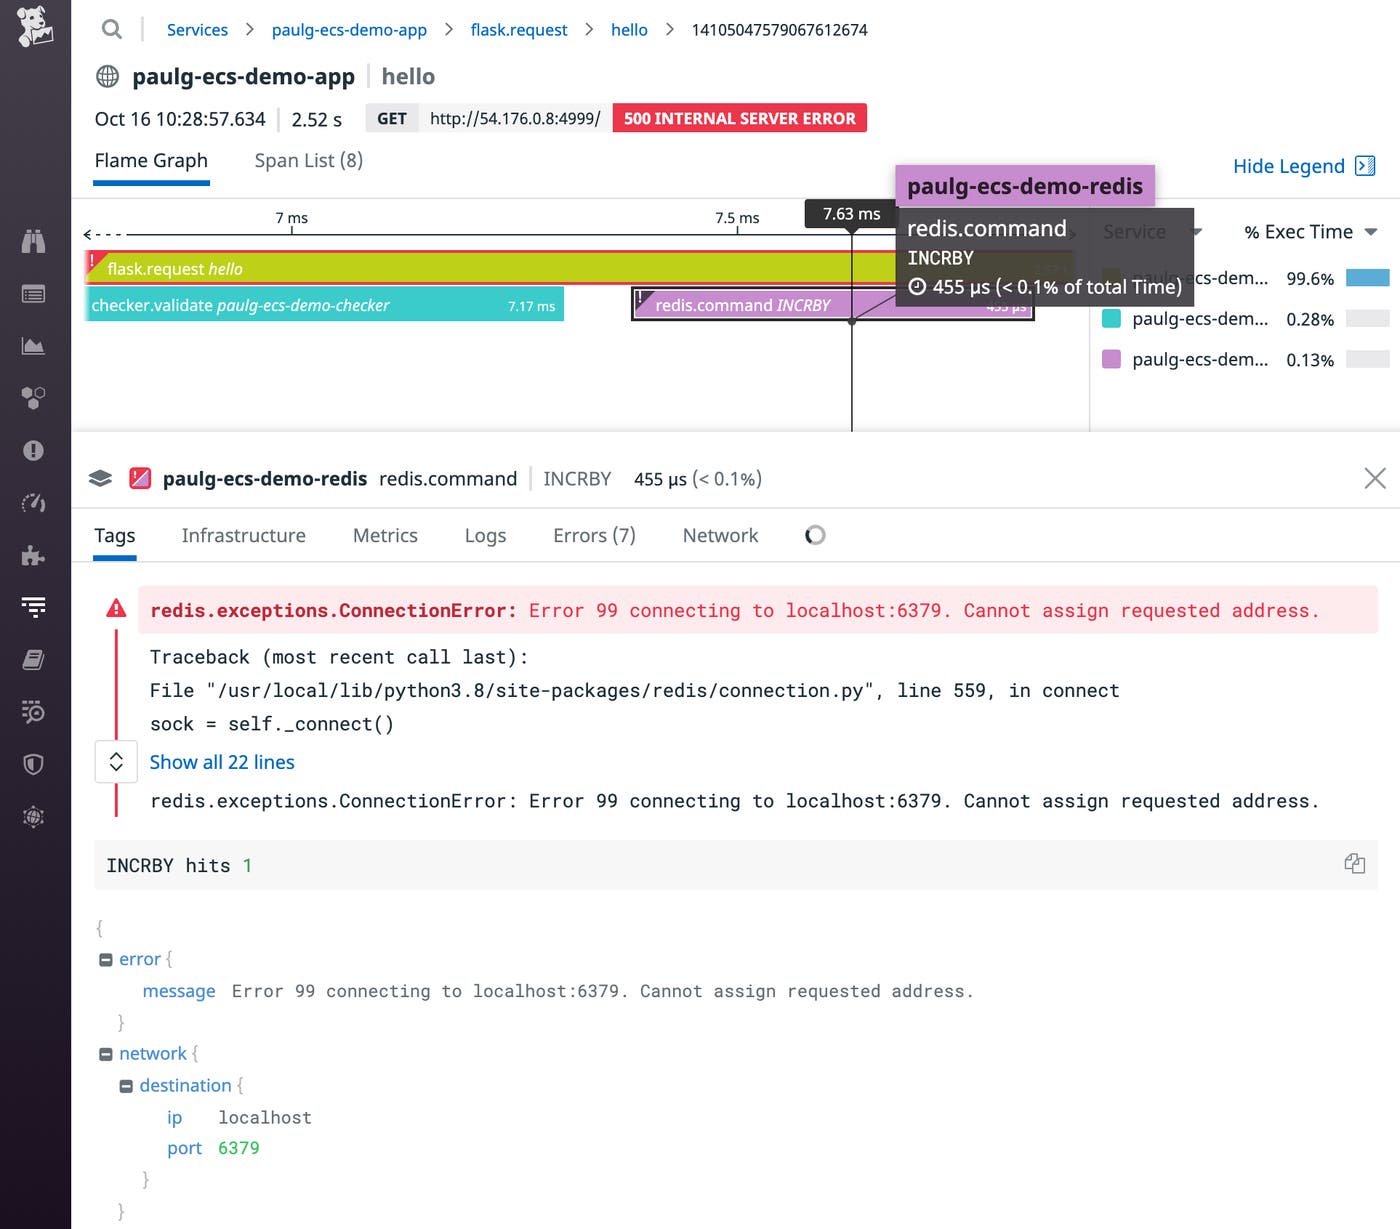
Within a flame graph, the horizontal bars are called spans, and each one represents a call to a single service within the application. Their width indicates the relative time it takes to complete the request, which can reveal the source of latency within your application. The vertical arrangement of the spans represents their dependencies, with each span being called by the one above it.
You can click on any span to view more information. The tabs on the bottom of the page display correlated data such as logs and metrics that provide further context for each span.
Collect and analyze logs from your applications on Fargate
Logs from your applications on Fargate can help provide rich context for troubleshooting issues in your container environment. In this section, we’ll show you how to bring your ECS logs into Datadog using Fluent Bit, and then we’ll show you how to filter and aggregate your log data for deep analysis. You can also forward logs from your EKS pods running on Fargate to CloudWatch—see this post for details.
FireLens for Amazon ECS is a log router that allows you to use Fluent Bit to collect logs from your ECS tasks running on Fargate and forward them to a log management platform like Datadog. In this section, we’ll show you how to create an ECS task definition that includes a FireLens logging configuration that routes application logs to Datadog.
In addition to your application container, your task definition needs to specify a Fluent Bit sidecar container that’s responsible for routing logs to Datadog. AWS provides an aws-for-fluent-bit Docker image you can use to create the sidecar container.
In the example below, our Fluent Bit sidecar container is named log_router. Its firelensConfiguration element specifies fluentbit as its configuration type. It also sets the enable-ecs-log-metadata option to true so Fluent Bit will enrich the logs with some additional information about the container they came from.
"containerDefinitions": [ { "name": "log_router", "image": "amazon/aws-for-fluent-bit", "logConfiguration": null, "firelensConfiguration": { "type": "fluentbit", "options": { "enable-ecs-log-metadata": "true" } } } ]Next, the task’s application container needs a logConfiguration that will route logs to Datadog. The options element in this example provides the required apikey, Host, and TLS fields, as well as all the recommended and optional fields listed in the Fluent Bit integration documentation.
{ "name": "web", "image": "httpd:2.4", "portMappings": [ { "hostPort": 80, "protocol": "tcp", "containerPort": 80 } ], "firelensConfiguration": null, "logConfiguration": { "logDriver": "awsfirelens", "options": { "dd_message_key": "log", "apikey": "<MY_DATADOG_API_KEY>", "provider": "ecs", "dd_service": "my-web-app", "dd_source": "httpd", "Host": "http-intake.logs.datadoghq.com", "TLS": "on", "dd_tags": "project:fluent-bit", "Name": "datadog" } } }Once you register your revised task definition and update your service, you should start to see ECS logs appearing in Datadog.
See Part 2 of this series for more information on routing ECS logs. You can also find further guidance on using FireLens to send Fargate logs to Datadog in our blog post and documentation. Later in this post, we’ll look at how you can visualize your ECS logs in Datadog.
Filter and aggregate your logs using metadata
Now that you’re collecting logs from your applications running on Fargate, you can start analyzing your log data in Datadog.
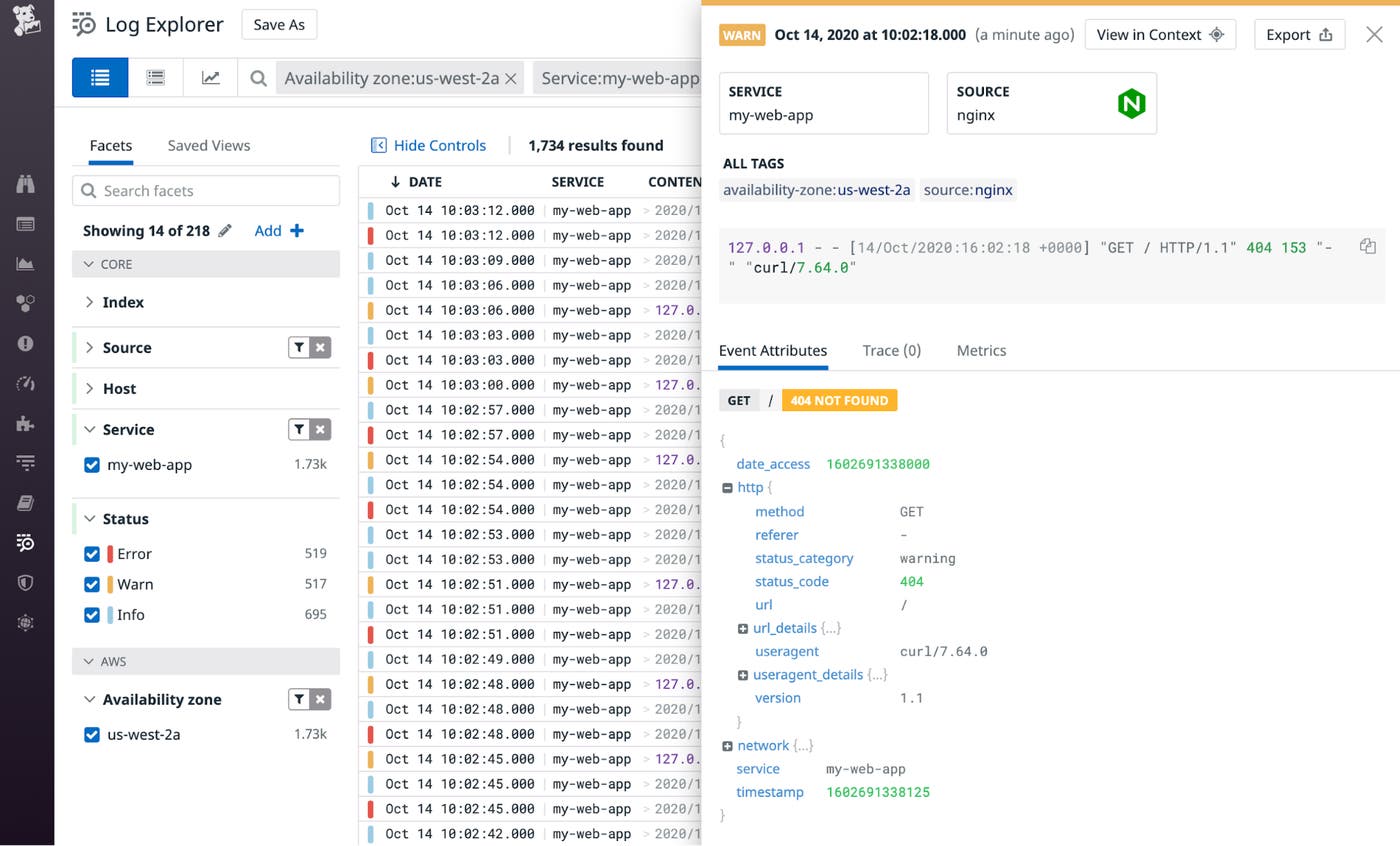
In this example, we’ve filtered logs based on the value of the service tag—which was set in the dd_service option in the Fluent Bit configuration file—to show only logs generated by the my-web-app service. This view also displays logs from only one AZ—us-west-2a. Because Datadog automatically enriches these logs with metadata from AWS, it’s easy to filter by tags like region, cluster_name, container_name, or task_family.
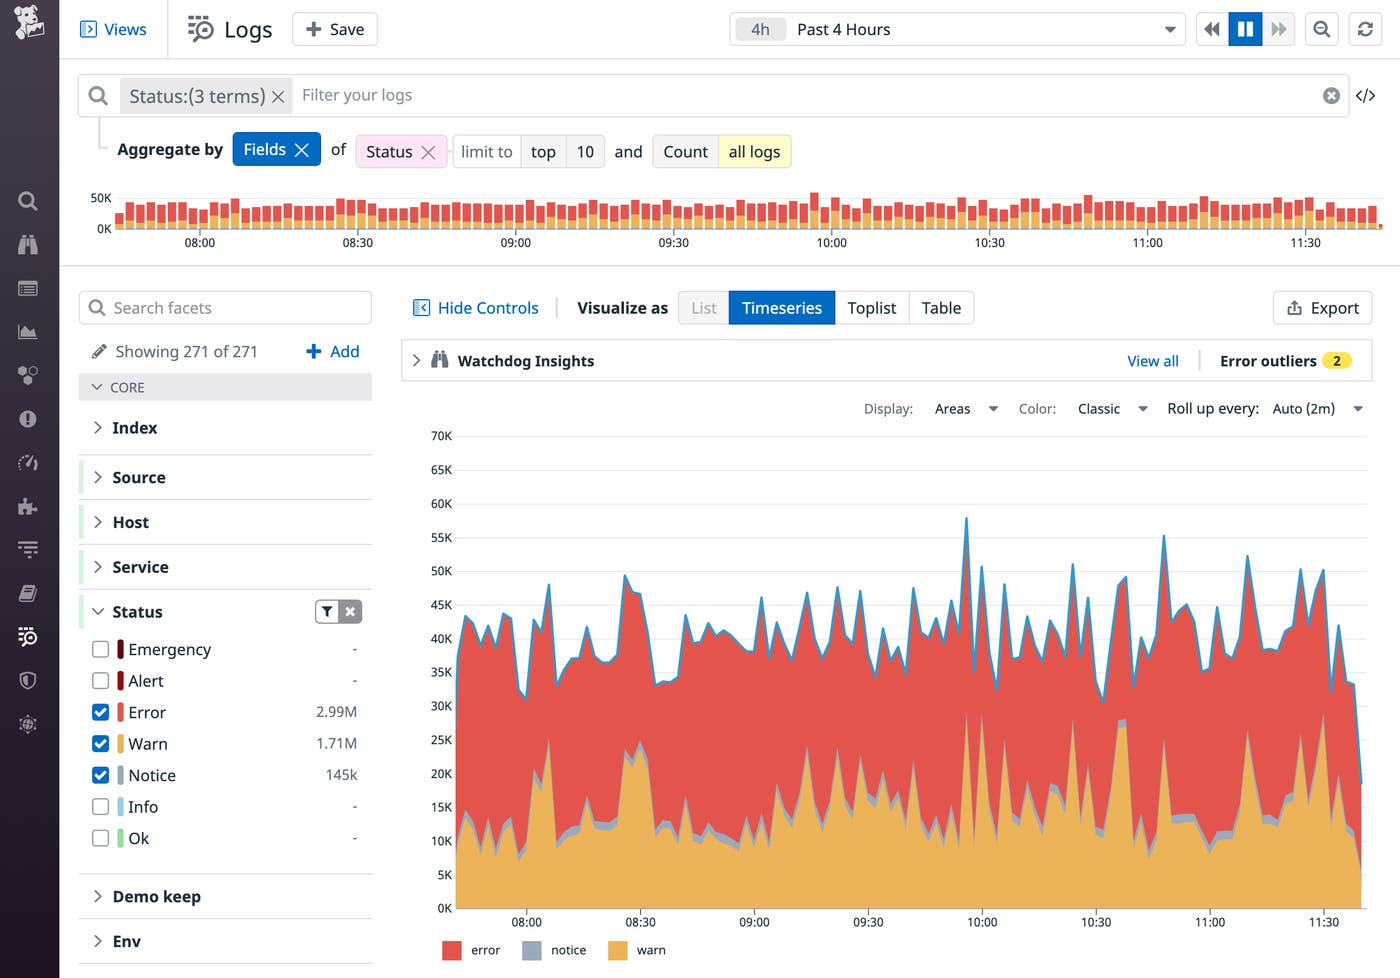
For a deeper understanding of your cluster’s performance, you can aggregate your log data and spot trends in your services’ performance. The screenshot below shows logs aggregated by status to show the relative counts of logs from three different log levels—error, warn, and notice.
Explore all your ECS and EKS Fargate monitoring data
Once you’re collecting metrics, logs, and traces from your ECS tasks and EKS clusters, you can visualize and alert on all of that data in Datadog. In this section, we’ll show you how to use dashboards to graph your monitoring data and alerts to notify you of potential issues within your containerized infrastructure. First, to help you organize your data, we’ll take a look at how to use tags in Datadog.
Take advantage of tags
Tags give you the power to organize your data in ways that help you understand the health and performance of your cluster and the applications that run there. You can use tags to filter your view in the Datadog UI as you visualize your metrics, logs, and infrastructure. And tags provide a link between different types of monitoring data so you can get deeper context for troubleshooting. For example, tags allow you to easily pivot from viewing metrics on a graph to seeing related traces from the same container or service.
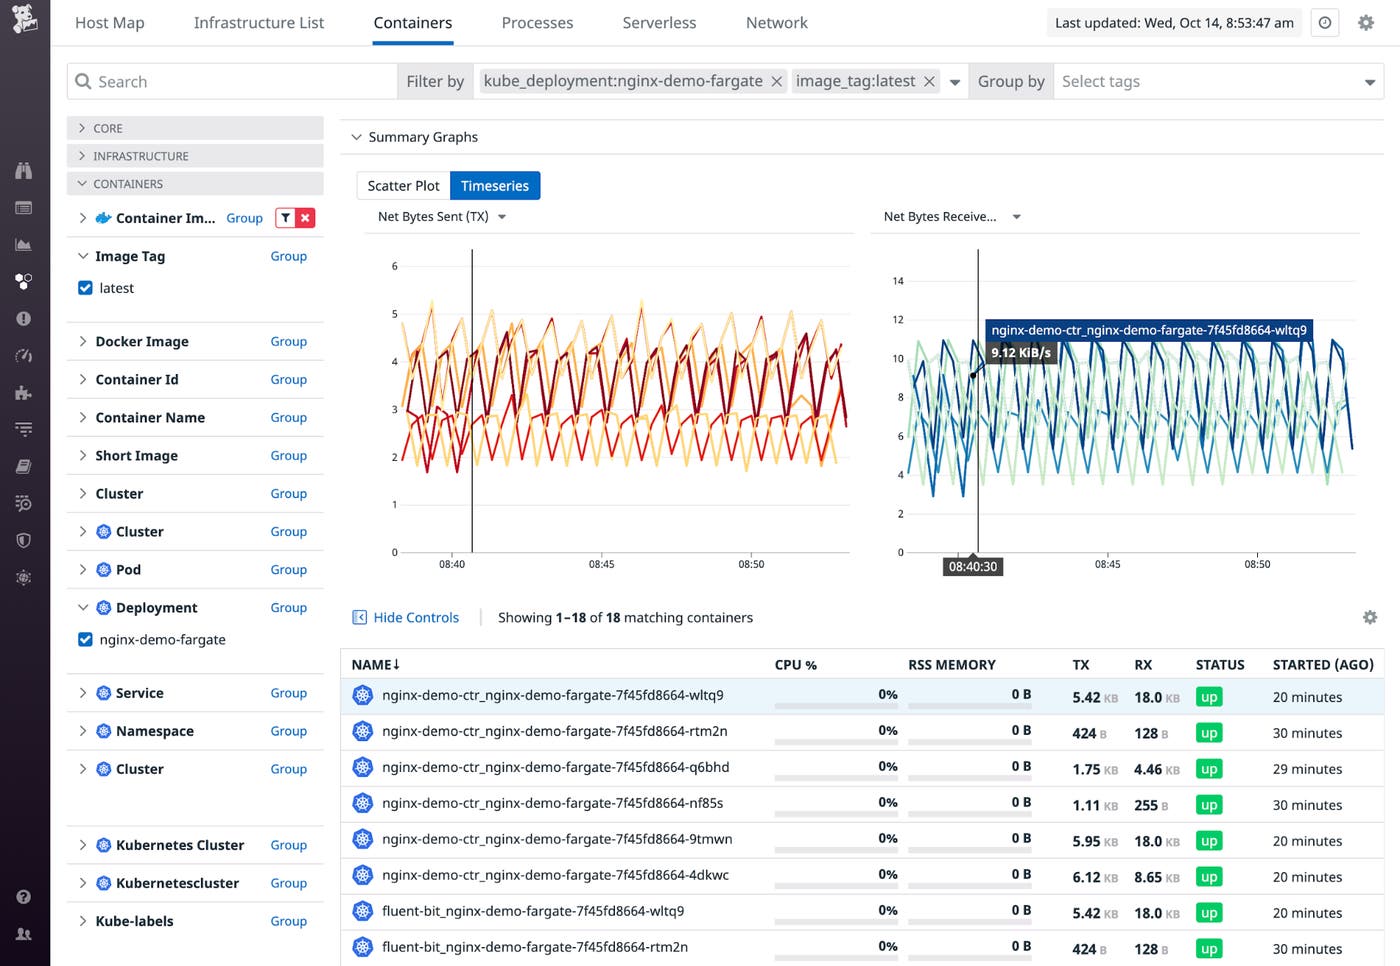
ECS and EKS automatically inherit tags from AWS and from the orchestrator, so you’ll be able to organize your data—for example by ECS task family or EKS pod name—without any additional configuration. The screenshot below shows the Live Container view, which graphs the performance of EKS containers filtered by kube_deployment and image_tag.
In this section, we’ll show you how you can create tags by importing Docker labels from your ECS tasks and Kubernetes labels from your EKS pods. We’ll also show you how to create your own custom tags so you can query and sort by environment, team, or any other tag that’s important to you.
Import Docker labels from ECS
If you’re already labeling the Docker containers in your ECS cluster, you can turn those labels into tags in Datadog by adding the DD_DOCKER_LABELS_AS_TAGS environment variable to the Agent container in your task definition. Like Docker labels, Datadog tags store metadata in key-value format. You can use DD_DOCKER_LABELS_AS_TAGS to map the Docker label key to the key of the corresponding Datadog tag. For example, if your Docker container has a label of role:app, you can import that label as a rolename:app tag by adding the following code to the environment section of your container definition:
"environment": [{ "name": "DD_DOCKER_LABELS_AS_TAGS", "value": "{\"role\":\"rolename\"}"}See the Agent documentation for more information on how to extract Docker metadata into Datadog tags.
Import Kubernetes pod labels from EKS
You can also configure the Agent to inherit Kubernetes pod labels as tags by using the DD_KUBERNETES_POD_LABELS_AS_TAGS environment variable. The example code below shows how you can add this variable to your Agent container, creating a rolename tag in Datadog whose value matches the value of the role label in the pod.
env: - name: DD_KUBERNETES_POD_LABELS_AS_TAGS value: '{"role":"rolename"}'See the documentation for further guidance on using environment variables in your Docker containers and Kubernetes pods.
Add your own tags
In both ECS and EKS, you can add custom tags by using the DD_TAGS environment variable. The example code below shows an ECS task definition excerpt that adds a team:product tag to the task.
"environment": [ { "name": "DD_API_KEY", "value": "<MY_DATADOG_API_KEY>" }, { "name": "DD_TAGS", "value": "team:product" }, { "name": "ECS_FARGATE", "value": "true" } ],Here is an example of how you can apply the same tag in EKS by adding the environment variable in the Agent’s manifest:
env: - name: DD_API_KEY value: <MY_DATADOG_API_KEY> - name: DD_EKS_FARGATE value: "true" - name: DD_TAGS value: team:productSee the documentation on tagging best practices for guidance on creating a successful tagging strategy.
Create dashboards to visualize your metrics
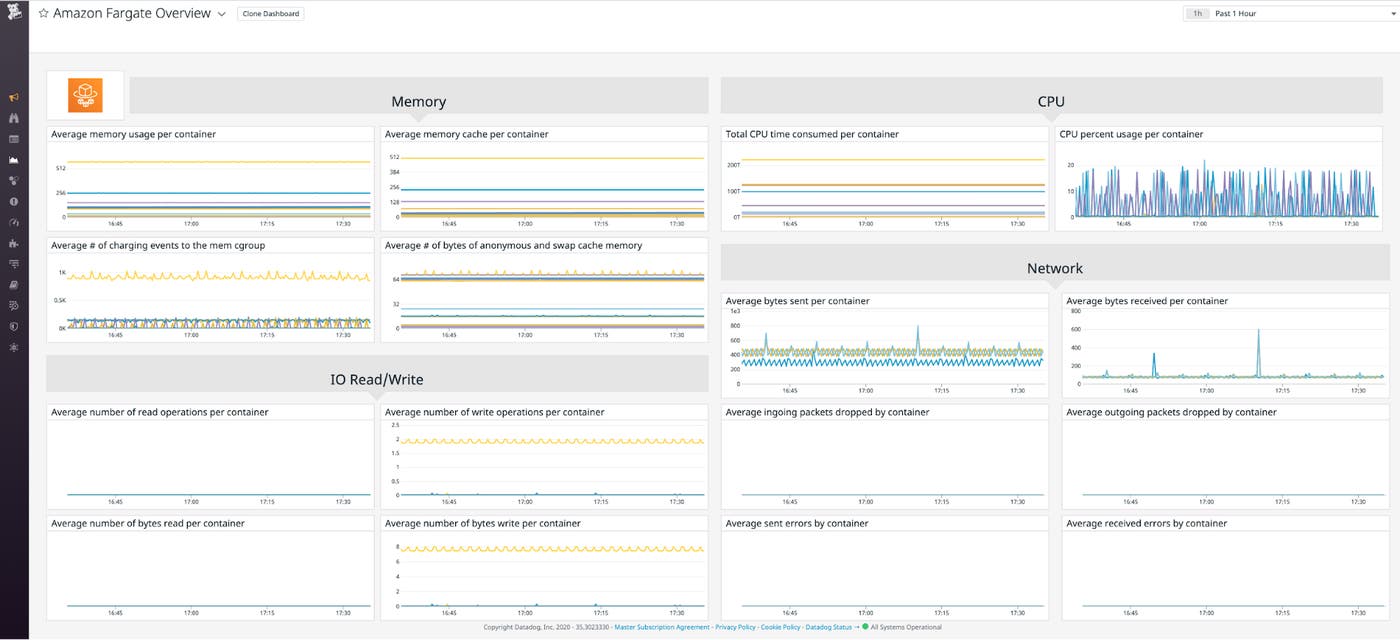
The out-of-the-box Fargate dashboard—shown at the top of this post—displays important per-container metrics around memory and CPU usage, disk I/O, and network performance. To give you complete visibility into how your containerized application is performing, Datadog integrates with more than 1,000 technologies and provides built-in dashboards to make it easy for you to monitor them all.
You can create a custom dashboard that combines the most relevant data from your containers, orchestrators, and other AWS services like Elastic Load Balancing (ELB) and Amazon Elastic File System (EFS).
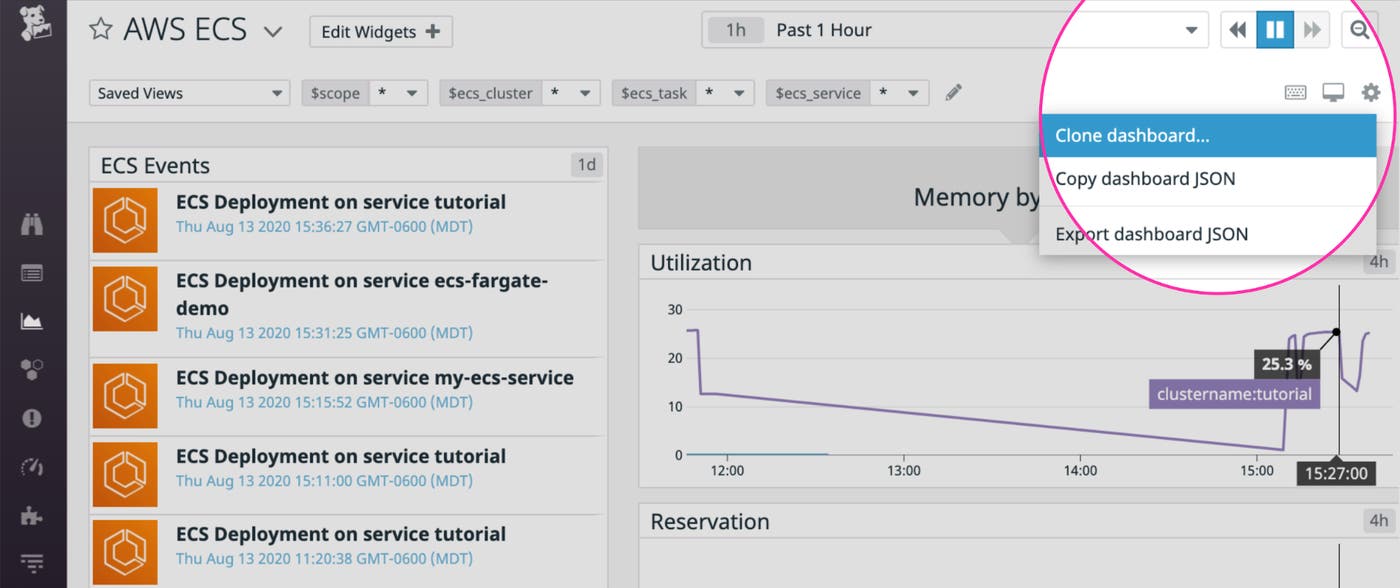
To customize a dashboard, first clone it—as shown in the screenshot below—then click the Edit Widgets button to add new graphs.
The container map
The container map gives you a bird’s-eye view of your containers. This can help you quickly spot potential problems in the health of your container fleet. In the screenshot below, the map indicates a lower rate of bytes transmitted in the us-west-1b availability zone, which could suggest a disruption in that zone’s networking.
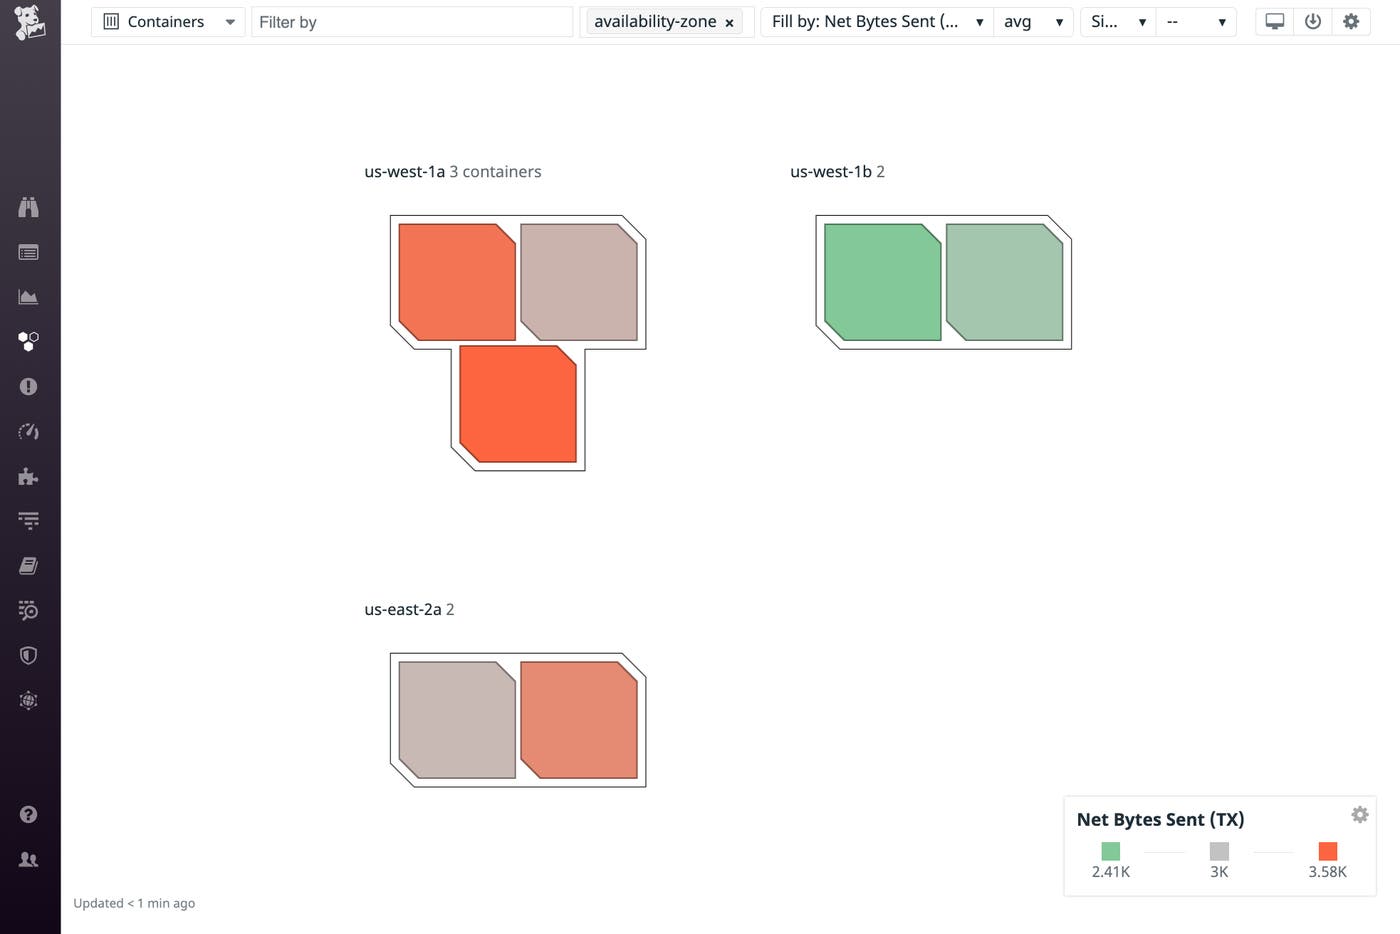
You can group your containers and filter your view by tag, for example to isolate containers from separate clusters or focus on containers that make up a single ECS task or EKS pod. By default, the containers on the map are shaded to indicate their relative number of I/O writes per second, but you can customize this to show you their network, memory, or CPU usage. You can click on any container to navigate to the Live Container view for real-time visibility into all the resources in your EKS clusters running on Fargate.
Alerts
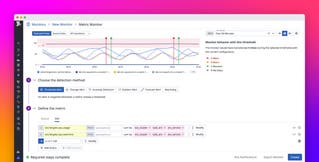
Visualizing your metrics, logs, and APM data is an easy way to spot-check for potential problems, but you can also create alerts to proactively notify your team if your monitoring data indicates a problem. In the screenshot below, we’ve created an alert that will trigger if the memory used by the pods that run our my-web-app service rises above a certain threshold. An alert like this one can notify you of diminishing memory in the Fargate compute resources where your containers are deployed, allowing you to revise your pod definitions to provide more memory.
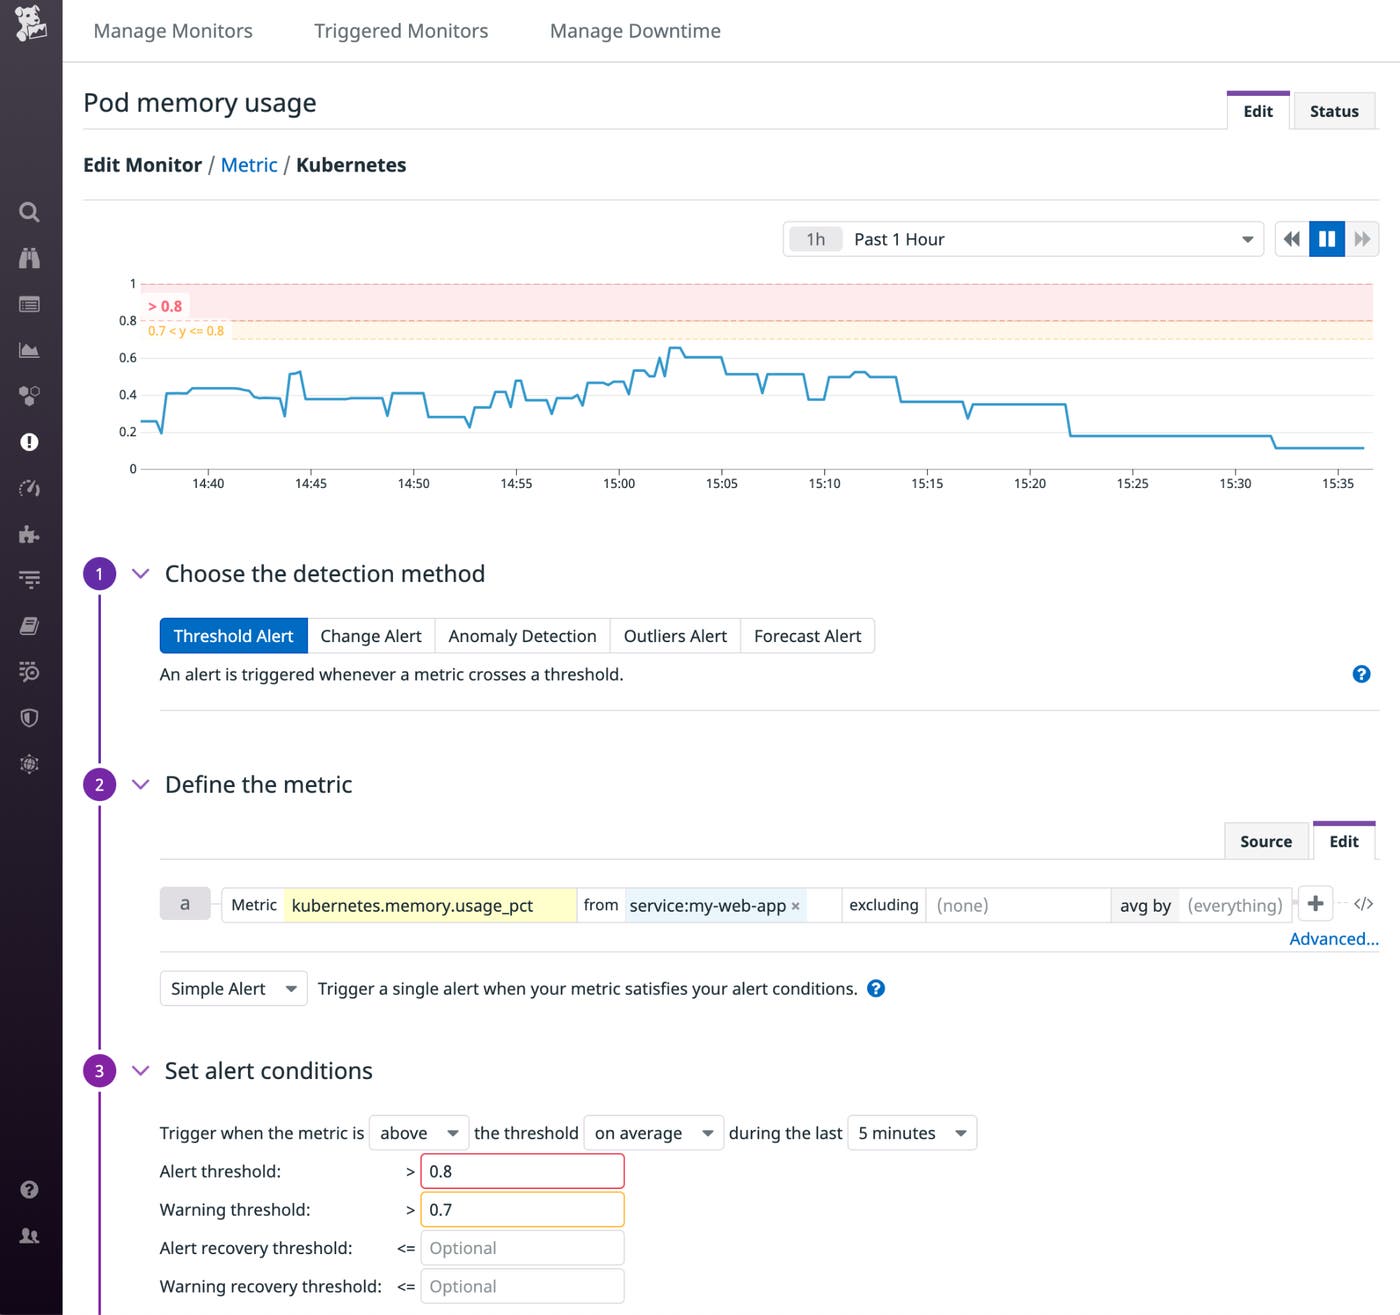
You can also create alerts based on your logs and your APM data. See the documentation for more information about creating alerts in Datadog.
Maximize visibility into your Fargate-backed clusters
To fully understand the health and performance of your ECS and EKS clusters running on Fargate, you need to monitor your AWS environment as a whole, plus any other technologies in your stack that contribute to your services. Datadog brings your metrics, traces, and logs into a single platform so you can monitor and alert on every dimension of your containerized services. If you don’t already have a Datadog account, sign up today for a free 14-day trial.


