
Evan Mouzakitis

David Lentz
Editor's note: Redis uses the terms “master” and “slave” to describe its architecture and certain metrics. When possible, Datadog does not use these terms. Except when referring to specific metric names for clarity, we will replace these words with “primary” and “replica.”
To implement ongoing, meaningful monitoring, you will need a dedicated system that allows you to store, visualize, and correlate your Redis metrics with the rest of your infrastructure. You also need to be alerted when any system starts to misbehave. In this post, we will show you how to use Datadog to capture and report on the key metrics identified in Part 1. We'll also discuss collecting and monitoring Redis logs and traces.
Integrating Datadog and Redis
Verify that Redis and redis-cli are working
Before you begin, run this command on your server to verify that Redis is running properly:
redis-cli info | grep uptime_in_secondsIf you are running the command from a different host or port, add arguments to the command as follows:
redis-cli -h <host> -p <port> info | grep uptime_in_secondsMake sure the output displays "uptime_in_seconds" followed by an integer:
uptime_in_seconds: 162Install the Datadog Agent
The Datadog Agent is open-source software that collects and reports metrics, traces, and logs from your different hosts so you can use that information within the Datadog platform. Installing the Agent usually requires just a single command. Installation instructions for different systems are available here.
As soon as the Datadog Agent is up and running, you should see your host reporting basic system metrics in your Datadog account.

Configure the Agent
Next you will need to create a Redis configuration file for the Agent. You can find the location of the Agent's configuration directory for integrations (conf.d) for your OS here. In that directory you will find a redisdb.d subdirectory containing a Redis configuration template named conf.yaml.example. Copy this file to conf.yaml. You can edit the file to customize your configuration if you are running Redis on a non-default port or have multiple Redis instances running, and you can include a list of tags that will be applied to every collected metric:
init_config:
instances: - host: localhost port: 6379 tags: - instance:productionSave and close the file.
Restart the Agent
Restart the Agent to load your new configuration. The restart command varies somewhat by platform; see the specific commands for your platform here.
Verify the configuration settings
To check that Datadog and Redis are properly integrated, execute the Datadog status command. The command for each platform is available here.
If the configuration is correct, you will see a section like this in the status output:
Running Checks====== [...]
redisdb ------- Total Runs: 104 Metrics: 33, Total Metrics: 3432 Events: 0, Total Events: 0 Service Checks: 1, Total Service Checks: 104The Service Checks in this snippet report the availability of your Redis instance. The Metrics and Events figures show that the Agent is reporting monitoring data to your Datadog account.
Turn on the integration
Finally, click the Redis Install Integration button inside your Datadog account. The button is located under the Configuration tab in the Redis integration settings.

Viewing Redis metrics in Datadog
Once the Agent begins reporting Redis metrics, you will see a Redis dashboard among your list of available dashboards in Datadog.
The default Redis dashboard displays the key metrics to watch highlighted in our introduction to Redis monitoring.
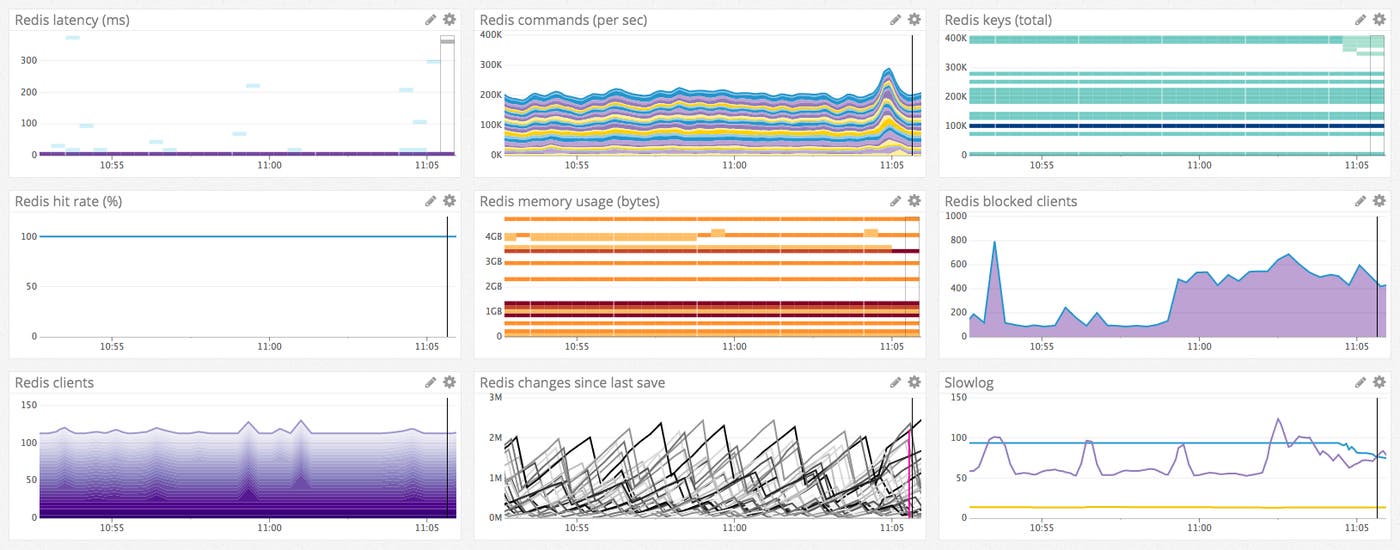
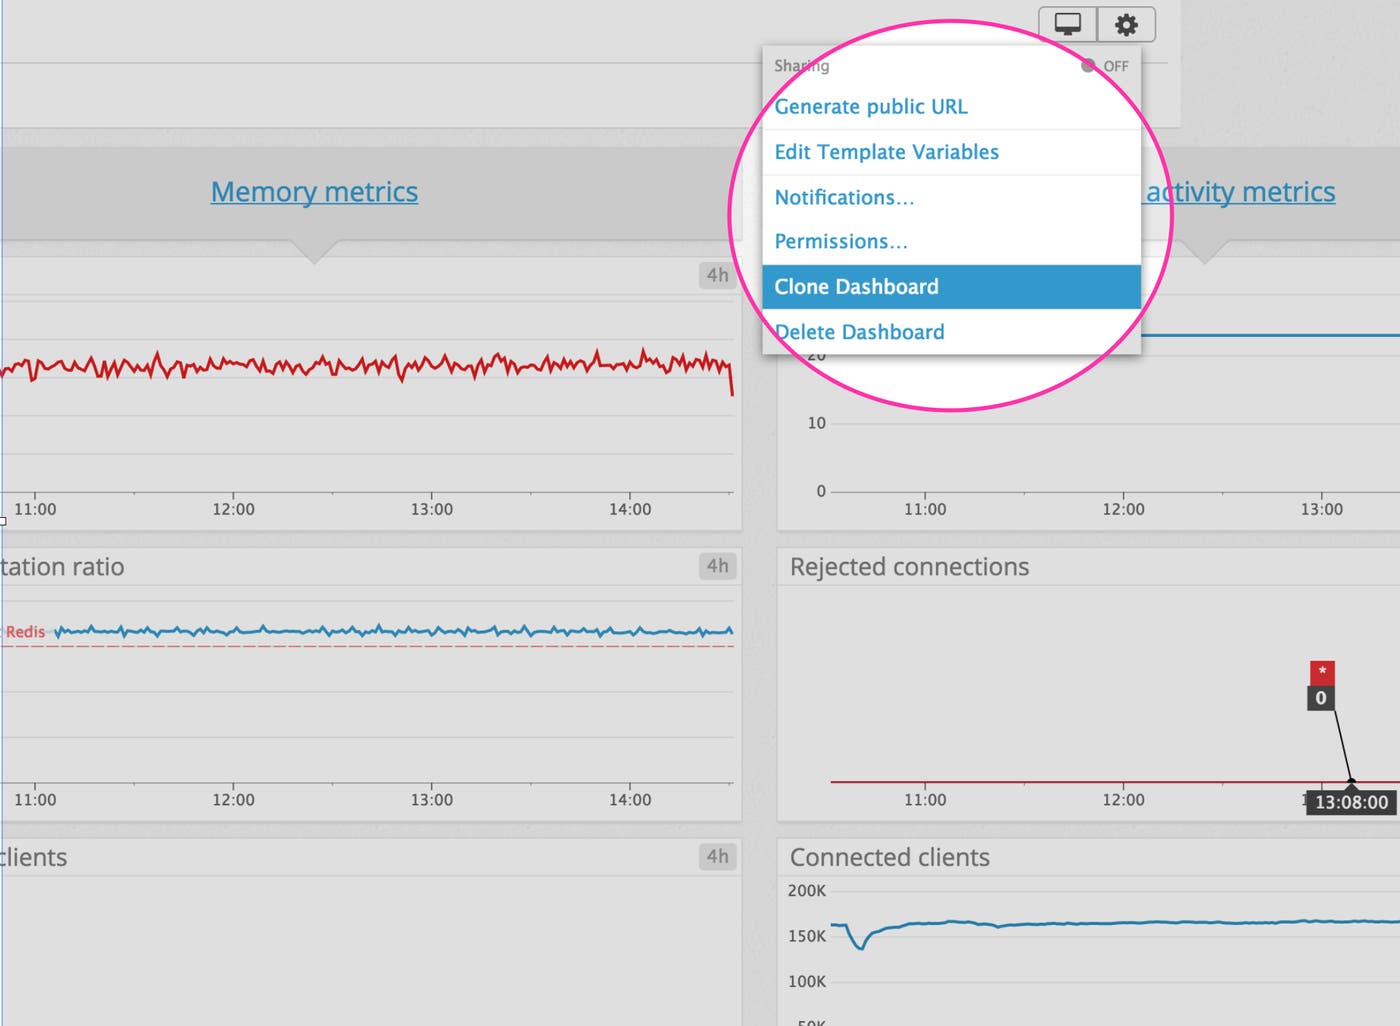
You can easily create a more comprehensive dashboard to monitor your entire web stack by adding additional graphs and metrics from your other systems. For example, you might want to graph Redis metrics alongside metrics from your NGINX web servers, or alongside host-level metrics such as network traffic. To start building a custom dashboard, clone the default Redis dashboard by clicking on the gear on the upper right of the dashboard and selecting Clone Dashboard.
Implementing APM for Redis
Datadog APM automatically aggregates statistics about your application’s request rate, latency, and errors, and generates detailed flame graphs that visualize the execution of individual requests. In this section, we'll walk through how you can start tracing requests with APM, using a simple Python application that interacts with Redis as an example. Datadog APM supports several widely used languages, libraries, and frameworks, including the Python Redis library. We'll see our example application automatically emit trace information, and we'll manually instrument the Python code to collect custom traces.
Instrumenting your Redis client
This example application is built on the Redis Python client redis-py. The app is named "myapp.py" and communicates with a Redis server on the localhost (127.0.0.1).
# Adapted from http://webpy.org/docs/0.3/tutorialimport redis, random, web
urls = ( '/', 'index')
class index: def GET(self): client = redis.StrictRedis(host="127.0.0.1", port=6379) client.set('randomnumber', random.randint(1,9999)) return str(client.get('randomnumber'))
if __name__ == "__main__": app = web.application(urls, globals()) app.run()You'll need to install Datadog's Python tracing client, ddtrace:
pip install ddtraceLaunch the example app:
DATADOG_ENV=redis_test ddtrace-run python myapp.pyThe DATADOG_ENV parameter sets the environment value of this service to redis_test. We'll use this below to make it easier to find the traces from this test app within Datadog. DATADOG_ENV is not required and has no default; you can omit this and your env value will be set to none.
Once you've issued this command, the app automatically begins sending trace data to the Datadog Agent.
See our documentation on tracing Python applications for sample code and more information.
Enabling APM
To configure the Agent to forward trace information, modify its configuration file to enable the apm_config option, shown here:
apm_config: # Whether or not the APM Agent should run enabled: true(The location of the Agent’s configuration file varies depending on OS; see this page for information about configuring the Agent on your system and restarting it to apply your configuration changes.)
Viewing trace info in Datadog
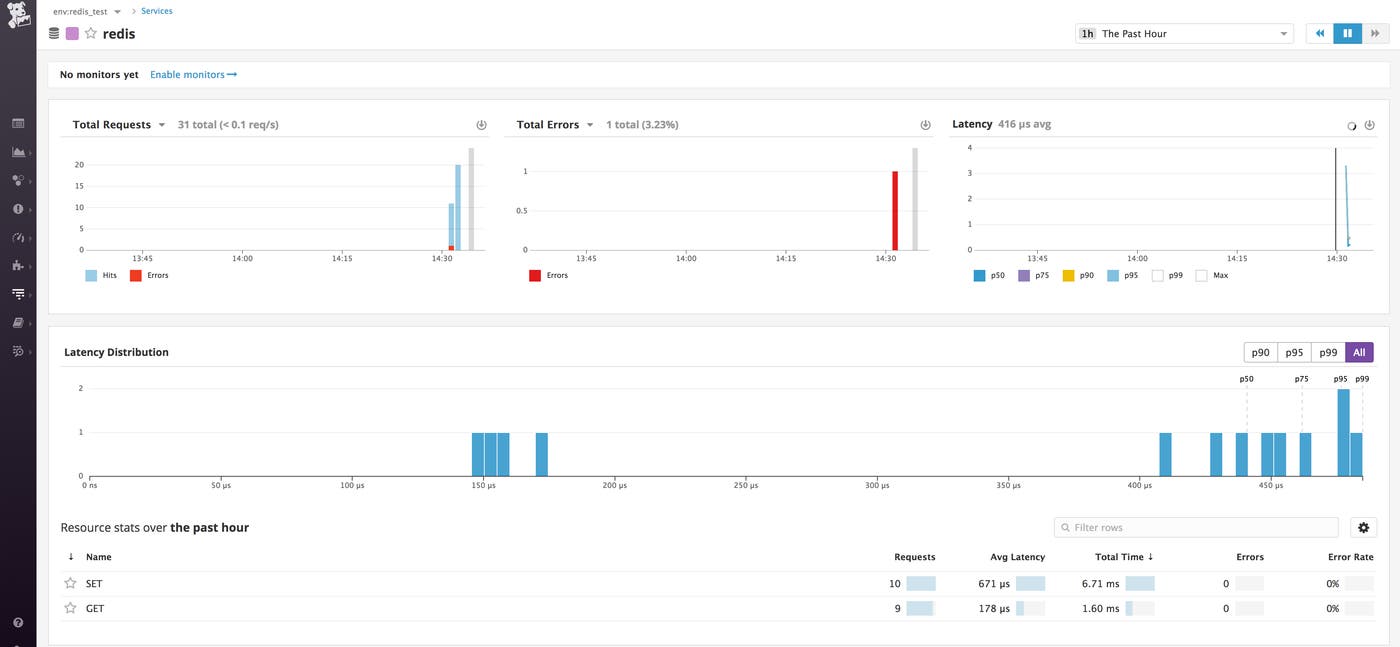
You've configured the Datadog Agent to enable APM, and ddtrace is providing automatic tracing for your Redis client application. You can now see a redis item on the Service list in your Datadog account. (Make sure env:redis_test is selected on the drop-down list in the top-left corner.) Click to view your APM information on the Service page.
To collect tracing detail beyond what's provided by auto-instrumentation, you can use ddtrace's tracer class. As shown in the code below, tracer allows you to attach metadata to your trace (here, tags and a service name) and allows you to define a span of code to trace (via the wrap decorator).
# Adapted from http://webpy.org/docs/0.3/tutorialimport redis, random, web
urls = ( '/', 'index')
from ddtrace import tracer
class index: tracer.set_tags({'team_name':'webapp_team'}) @tracer.wrap('my.wrapped.function', service='my.service') def GET(self): client = redis.StrictRedis(host="127.0.0.1", port=6379) client.set('randomnumber', random.randint(1,9999)) return str(client.get('randomnumber'))
if __name__ == "__main__": app = web.application(urls, globals()) app.run()The tracer.wrap decorator in the example code names the service (my.service) and resource (my.wrapped.function) that will report APM data. On the Service list, click the Custom button to view a list of services with custom traces available. Click my.service to view high-level information about the app, including total requests and errors, and aggregate data about request latency. (For more information, see the Service page documentation.)
To view custom trace information about the function call, click my.wrapped.function in the Resource stats section at the bottom of the page.
The trace page visualizes the timeline of the request’s execution, and shows the service calls that comprise that request. In the image below, we can see that 69.7% of the request’s duration was spent executing Redis commands; moving the cursor over the timeline shows more detail about each of those calls and commands.
If the latency of a call is high, the trace page can help to determine where in the request the inefficiency is introduced.
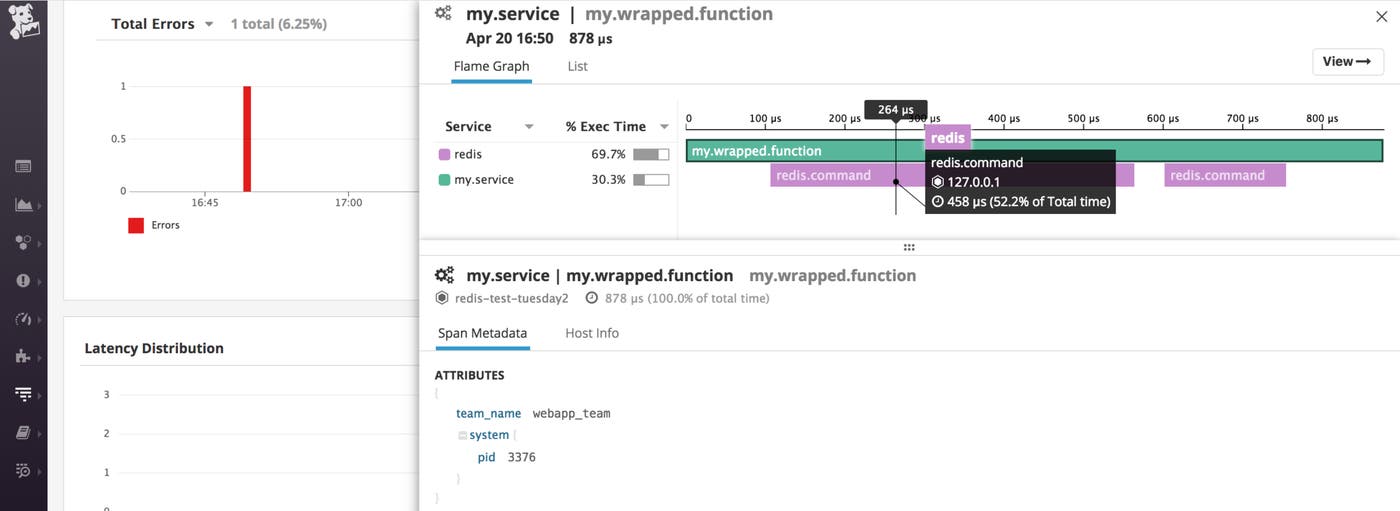
Traces also provide metadata about each request. For example, note the team_name tag in this view, which was set in the call to the set_tags method.
You can learn more about the trace page in the Datadog documentation.
Capturing Redis Logs
Now that you're collecting metrics and request traces, the next step is to start collecting logs from your Redis cache as well. To show how Datadog's logging works, we'll continue our discussion of myapp.py, an example web application written in Python that functions as a Redis client.
Enabling logging
Log collection is disabled in the Agent by default. Enable it by editing the Agent configuration file, uncommenting the relevant line:
# Logs agent is disabled by defaultlogs_enabled: trueNext, modify the configuration of the Redis integration. Edit redisdb.d/conf.yaml to configure the logs item as shown below:
logs: - type: file path: /var/log/redis/redis-server.log source: redis sourcecategory: database service: my.serviceThe path to the Redis log file varies between distributions. To determine the proper path value for this configuration, query your Redis server with this command:
redis-cli config get logfileFinally, restart the Agent as described in the Agent installation instructions specific to your OS.
For more information about configuring log collection in Datadog, see our log management documentation.
Viewing log info in Datadog
You can now see information from your Redis logs begin to appear on the Log Explorer page in your Datadog account.
The level of detail in your Redis logs is determined by the loglevel value specified in /etc/redis/redis.conf. You can view your current loglevel using this command:
redis-cli config get loglevelTo change your loglevel, edit the loglevel line in redis.conf (which is commented with descriptions of the available loglevel values). At all levels, your logs will show information about the server’s status (starting, stopping, ready to accept connections, plus important and critical notices). At the higher loglevels you will see log entries created when a Redis client establishes or relinquishes a connection to the server, and a current count of keys in the Redis data store.
To filter this view to display only your Redis logs, type service:my.service in the search field at the top of the page.
In the image below, the log entry shows that this Redis instance has no configured replicas, and currently has one client connected (a single instance of the myapp.py application). The integration pipeline automatically extracts key attributes from each log entry, including PID, role, and severity.
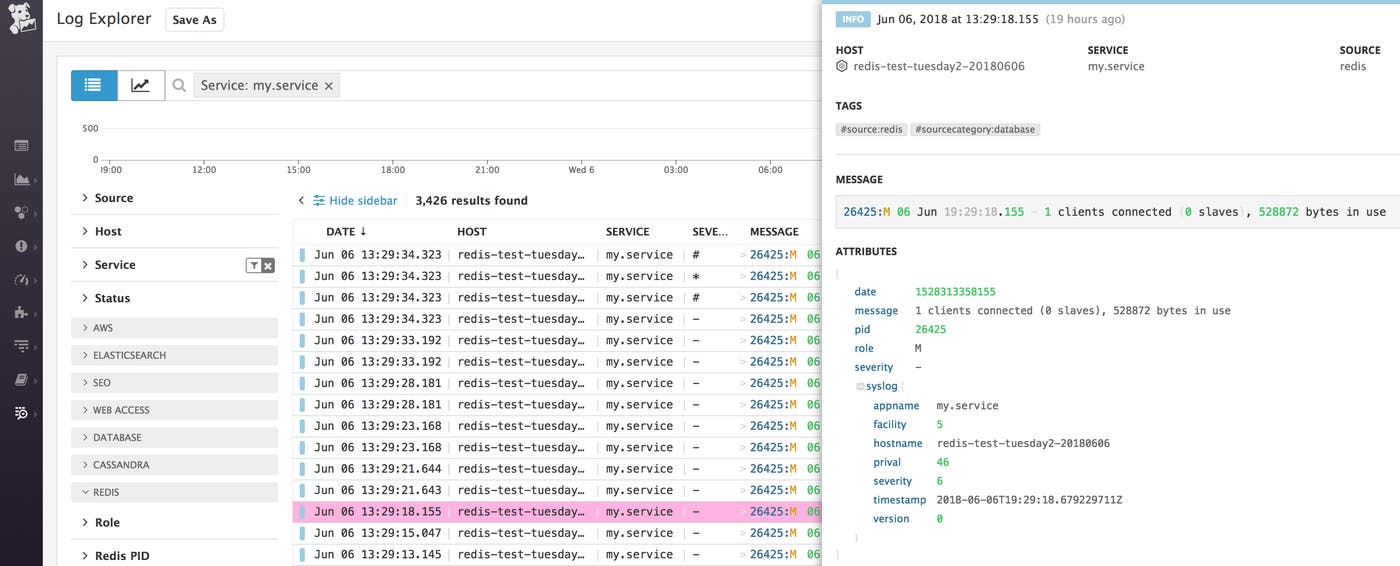
For more information, see our docs on exploring, searching, and graphing logs.
Alerting on Redis metrics
Once Datadog is capturing and visualizing your metrics, you will likely want to set up some alerts to be automatically notified of potential issues.
Datadog can monitor individual hosts, containers, services, processes—or virtually any combination thereof. For instance, you can monitor all of your Redis hosts, or all hosts in a certain availability zone, or a single key metric being reported by all hosts corresponding to a specific tag. You can also build alerts around the performance of your service, as measured by Datadog APM, or around any data being captured in your Redis logs.
End-to-end Redis visibility
In this post we’ve walked you through integrating Redis with Datadog to visualize your key metrics, request traces, and logs, and to notify the right team whenever your infrastructure or application shows signs of trouble.
If you've followed along using your own Datadog account, you should now have improved visibility into what's happening in your environment, as well as the ability to create automated alerts tailored to your infrastructure, your usage patterns, and the metrics that are most valuable to your organization.
If you don't yet have a Datadog account, you can sign up for a free trial and start monitoring Redis right away.
Source Markdown for this post is available on GitHub. Questions, corrections, additions, etc.? Please let us know.

