Mallory Mooney
To centralize logging from your entire stack—from traditional infrastructure to serverless components—Datadog is announcing native support for the launch of FireLens for Amazon ECS. FireLens streamlines logging by enabling you to configure a log collection and forwarding tool such as Fluent Bit directly in your Fargate tasks.
We’ve partnered with AWS to provide built-in Fluent Bit support for Datadog so that you can now seamlessly route container logs from AWS Fargate. Once your logs are flowing into Datadog, you can monitor them alongside other Fargate metrics to get visibility into your containerized services.

Configure Fluent Bit directly in your Fargate tasks
In order to start forwarding Fargate container logs to Datadog with Fluent Bit, you will need to specify a new container definition for your Fargate task:
"containerDefinitions": [{ "essential": true, "image": "amazon/aws-for-fluent-bit:latest", "name": "log_router", "firelensConfiguration": { "type": "fluentbit", "options": { "enable-ecs-log-metadata": "true" } }}]This will create a FireLens container using Amazon’s Fluent Bit image so you can use Fargate task definitions to route logs with Fluent Bit. The essential parameter ensures that containers that rely on this configuration won’t continue running if the FireLens container stops for any reason. The enable-ecs-log-metadata option enables FireLens to automatically detect metadata from Fargate and append it to your logs, such as the ECS cluster and the ECS task definition associated with the container that generated the log.
Then, in the same Fargate task, create a new log configuration that uses AWS FireLens as the log driver and specifies output options for Fluent Bit:
"logConfiguration": { "logDriver": "awsfirelens", "options": { "Name": "datadog", "apiKey": "<DATADOG_API_KEY>", "dd_service": "my-httpd-service", "dd_source": "httpd", "dd_tags": "project:example", "TLS": "on", "provider": "ecs" }}You can find your API key in your Datadog account. The dd_service and dd_source options associate your container logs with a specific service and source in Datadog. The service should be the name of the service that is generating your logs (e.g., my-httpd-service), while the source should be the underlying technology for the service (e.g., httpd). The source option will automatically trigger a log processing pipeline in Datadog for your integration (if available). You can also add tags to your logs (e.g., project:example) to help you easily find, filter, and analyze them in Datadog. The provider option maps metadata from ECS to Datadog tags.
Monitor your Fargate tasks in Datadog
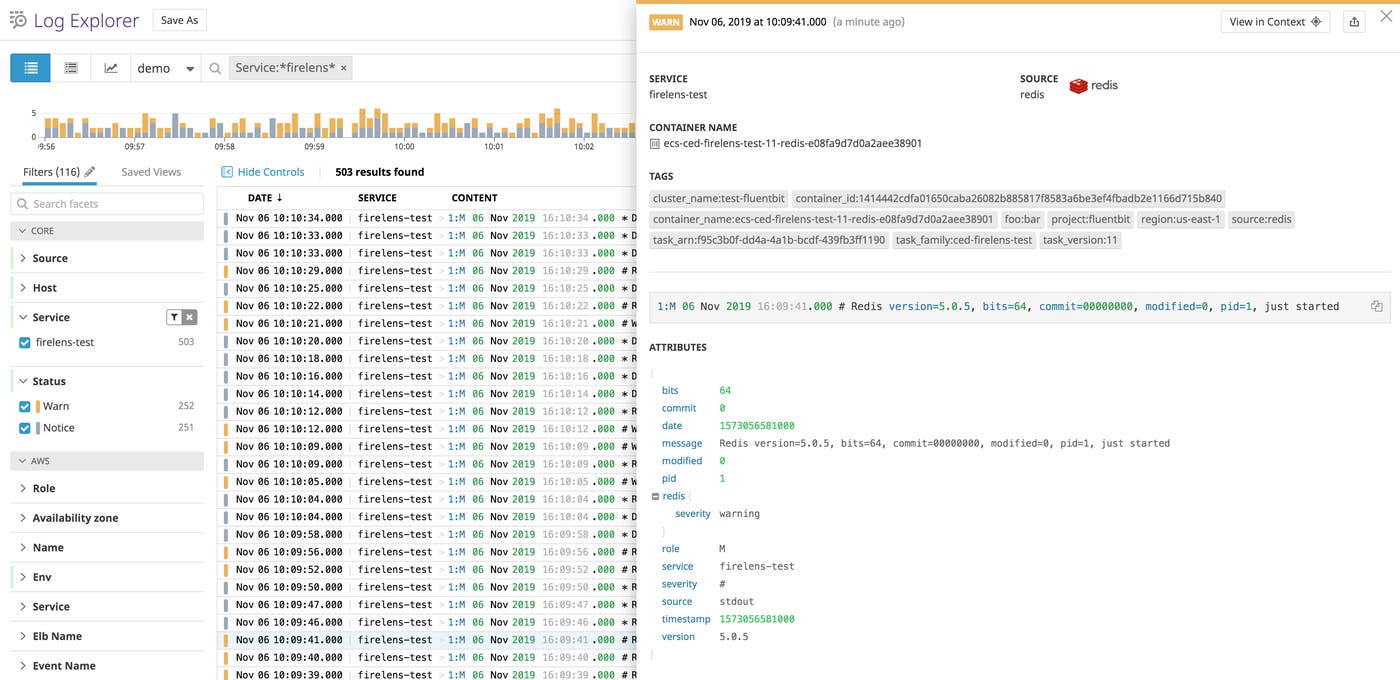
Whenever a Fargate task runs, Fluent Bit will automatically route the container logs to Datadog so that you can begin monitoring them. These logs contain information about all of the containers managed by your Fargate tasks, including the container name and the associated ECS cluster. Datadog will also automatically ingest any additional tags you’ve added to your Fluent Bit configuration or Fargate tasks so you can easily sift through and analyze your logs.

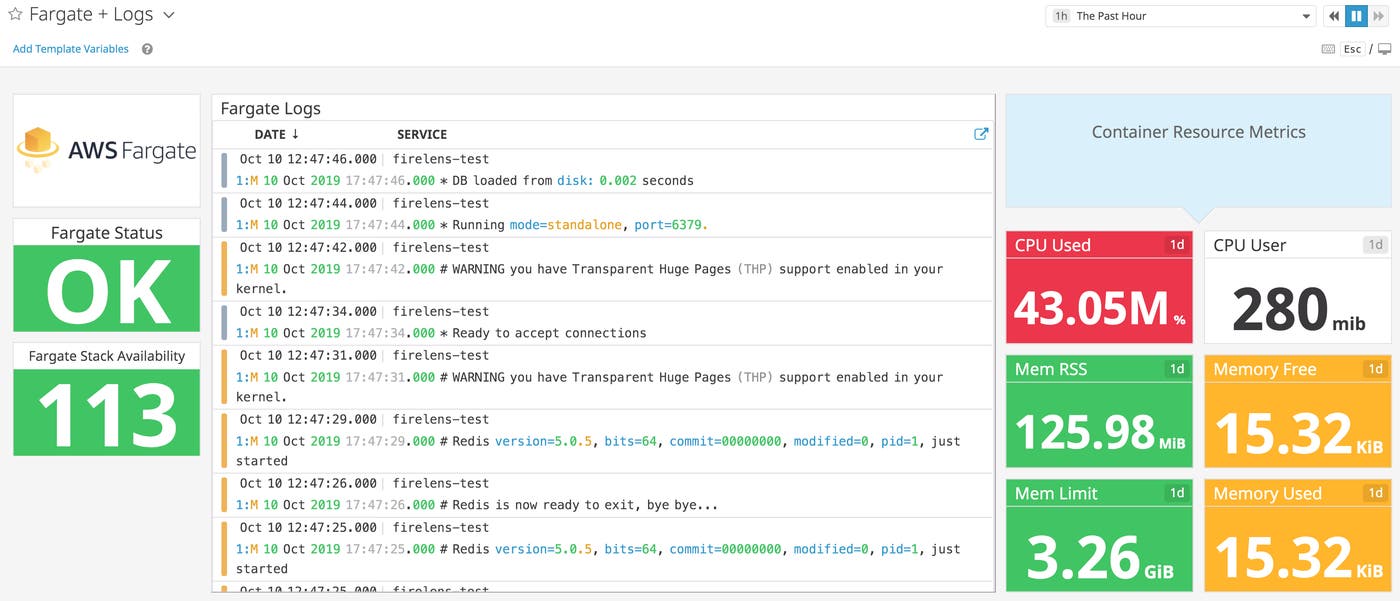
If you’ve enabled Datadog’s Fargate integration, you can monitor your logs alongside metrics from all of your Fargate containers, such as CPU and memory usage. In the Live Container view, resource metrics are graphed at a two-second resolution so you can detect critical performance spikes in your container infrastructure. You can also easily stream your logs from within any container.
And with Autodiscovery, Datadog automatically detects containerized services on Fargate and configures Datadog Agent checks for 1,000+ integrations like Redis and NGINX, so you can easily start collecting and analyzing key service metrics.
Start monitoring Fargate tasks with FireLens and Fluent Bit
Datadog’s Fluent Bit plugin for FireLens is readily available for forwarding logs from your Fargate applications and provides a seamless way to monitor and explore your logs alongside metrics from your containerized services. See our AWS Fargate monitoring guide for more information and follow these steps to start forwarding logs to Datadog. If you’re not yet using Datadog, you can sign up for a free trial today.


