Abril Loya McCloud
Application performance monitoring allows you to better understand and improve application performance by tracking how your services interact in the process of serving real requests. For each of your services, Datadog APM automatically gathers high-level performance metrics and decomposes individual request traces in detailed flame graphs so you can isolate issues, prioritize fixes, and optimize overall application performance.
To make it easier to automate your monitoring of service-level performance, we are happy to announce the availability of Datadog APM monitors. The new APM monitors are designed to notify you of changes in service-level indicators, like latency and error rate, for each of your services.
Monitoring service-level indicators
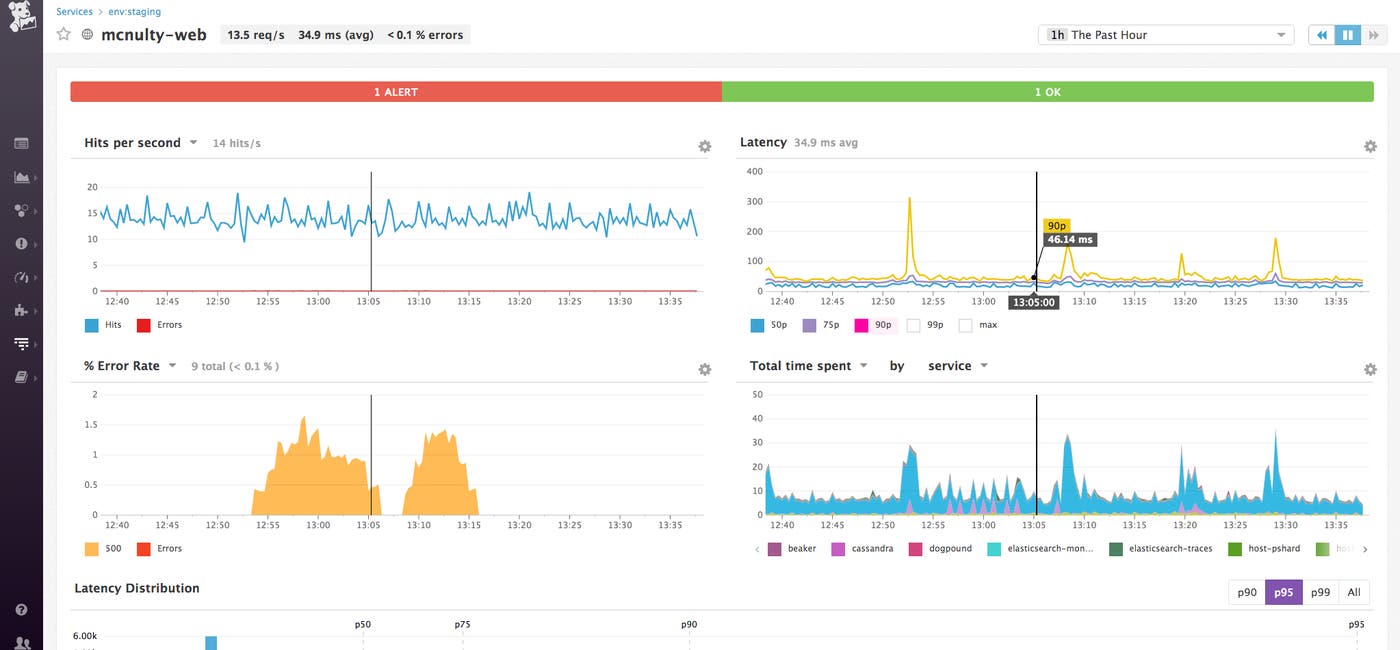
Datadog APM automatically generates individual service dashboards that show key service-level indicators (SLIs): throughput, latency, and error rates. APM monitors alert you to changes in your SLIs that could lead to user-facing issues or SLA violations.
APM monitors can be set to alert on indicators like elevated error rates, abnormal drops in throughput, or rising latency. For example, you can notify your team any time the 95th percentile (p95) latency for a service exceeds a threshold that violates the internal SLA established between teams.
Monitors can be created directly from the service dashboard via the monitor status bar at the top of the dashboard. Clicking the status bar brings up a monitor panel showing all alerts set up for the service, including both APM monitors and infrastructure monitors.
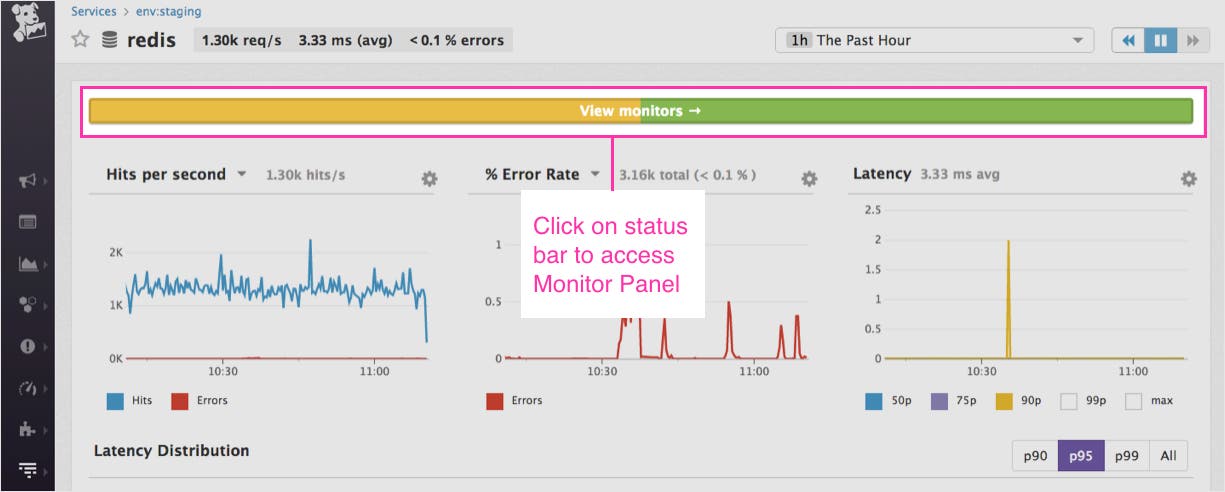
The monitor panel also includes a list of suggested alerts you can enable with one click. Suggested alerts serve as a guide to the metrics you should consider alerting on to get the most out of your application monitoring. For example, if you’re monitoring a Redis cache, Datadog APM will suggest that you enable monitors like ‘Service redis has a high p90 latency,’ with a preset, adjustable alert threshold.

You can edit the monitors you’ve enabled directly in the APM monitor panel or by heading to the “Manage Monitors” page.
Drill down
When an APM monitor is triggered, team members receive a notification with contextual information. The example notification below shows an unexpected increase in the average error rate of a web application in our staging environment.

The body of the alert includes links back to a service overview for the web application, as well as end-to-end traces of recent requests so you can immediately begin to investigate.
On the APM trace page, you can sort by errors to identify problematic requests. By inspecting individual traces, you can see what is causing the error, as well as all the other context for a particular request.
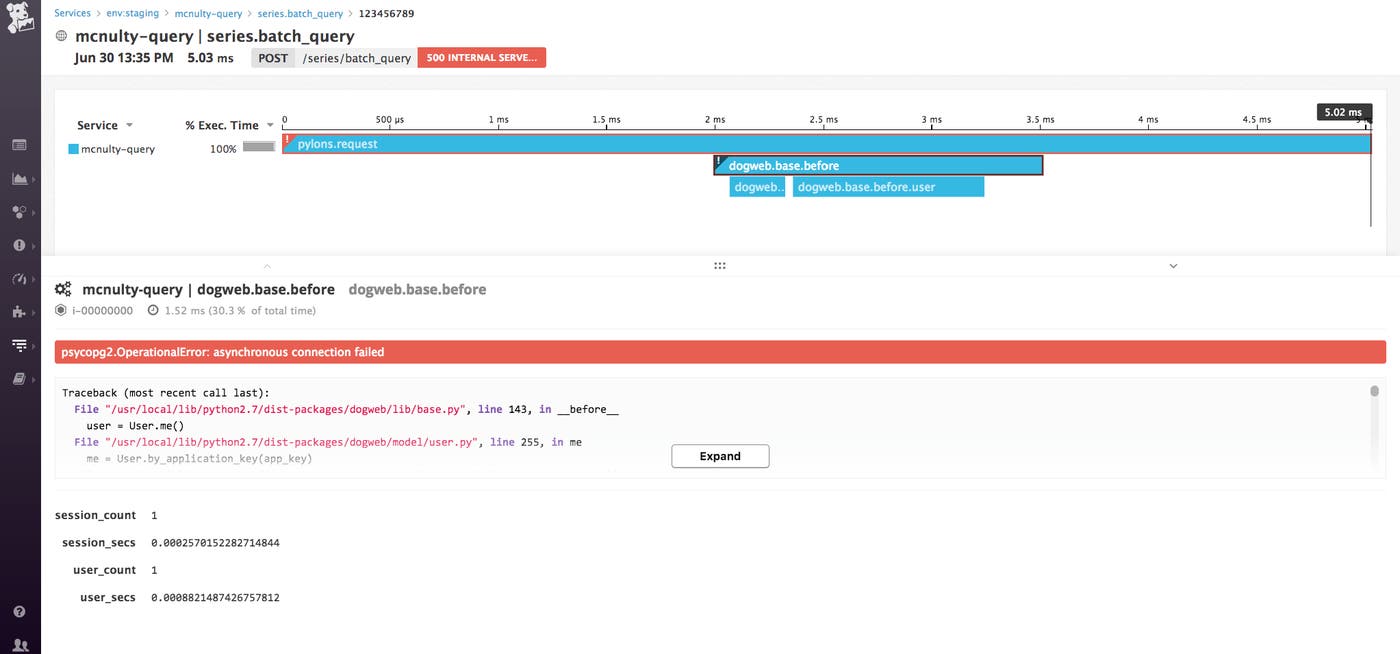
This trace shows that the service encountered an internal server error when processing a request, apparently because our client application lost a connection to a Postgres database via psycopg. Because Datadog integrates with Postgres and 1,000 other technologies, you can immediately jump to your Postgres dashboard to investigate the cause of the issue. The full stack trace is displayed for additional context.
Better alerting, better service performance
Setting up an APM monitor is simple. To create a monitor directly from a service dashboard, open the monitor panel at the top of the page and click the “New Service Monitor” button. You can also go directly to your Monitors page and choose APM under “New Monitor.”
On the new monitor page, define the service and environment you would like to alert on and set the alert conditions for either a threshold or anomaly alert. Defining a service environment for your alerts minimizes noise from things like service testing.
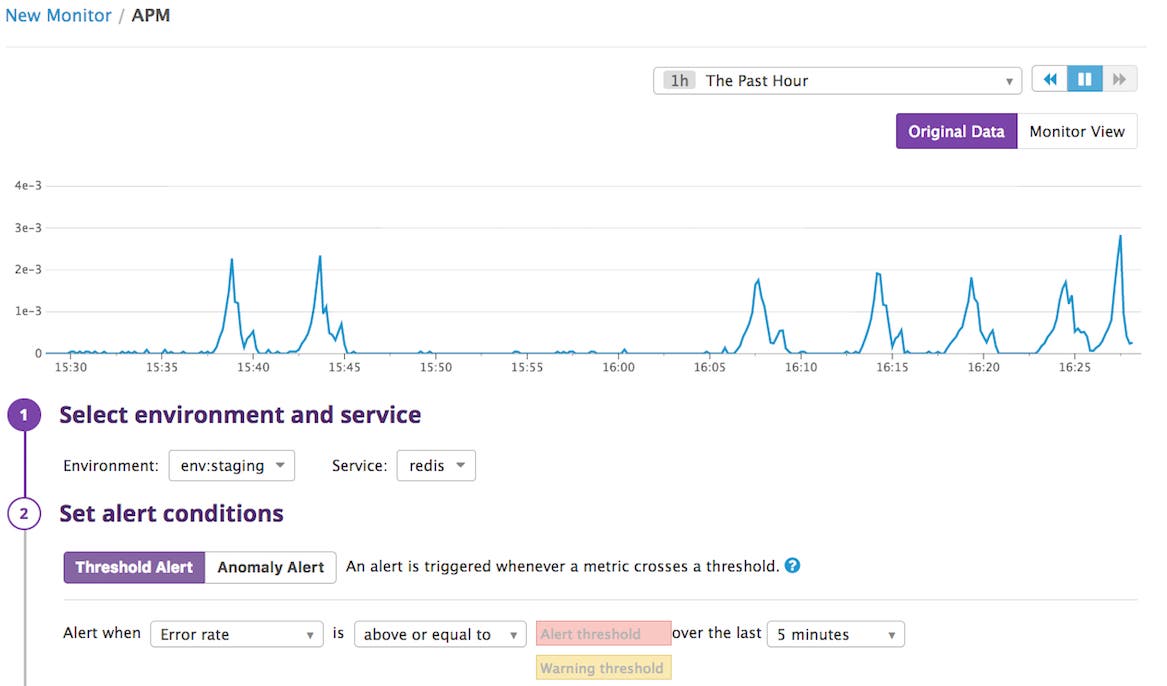
You can then edit the body of the alert message, which autopopulates according to the alert parameters, and add notification channels and recipients for the alert.
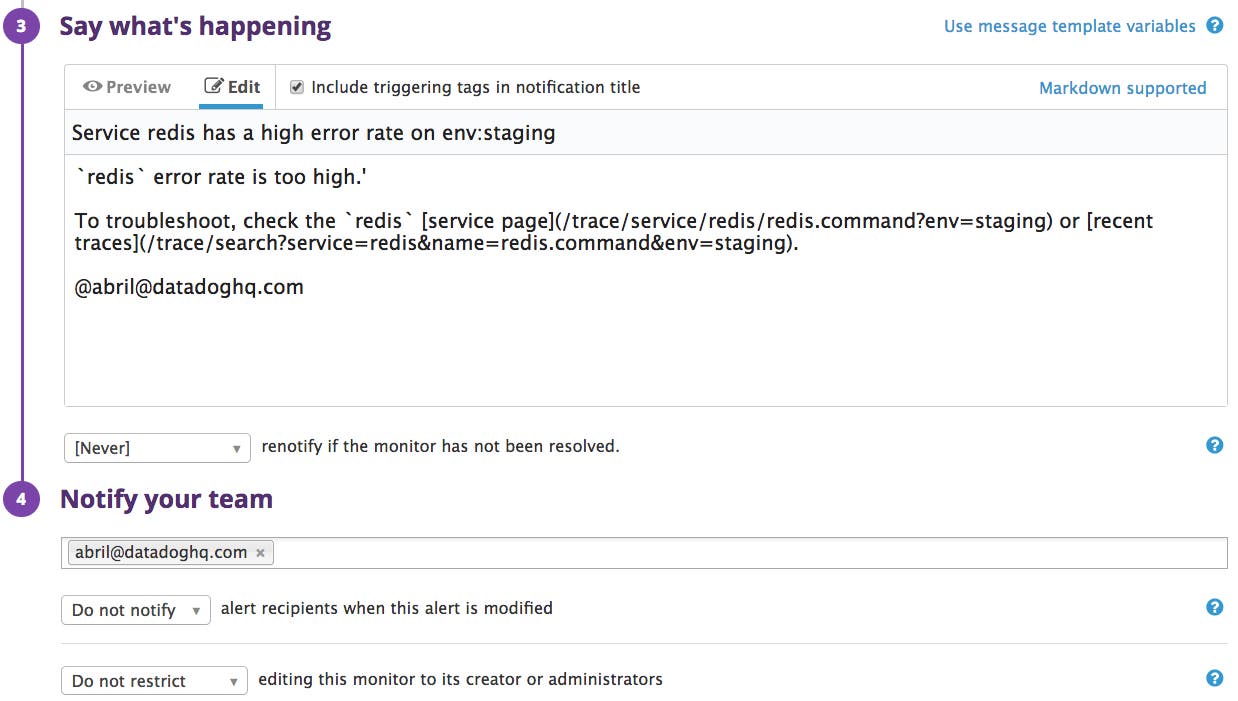
If you’re already a Datadog customer, you can set up your first APM monitor in minutes by following the steps above. Haven’t tried APM yet? Learn how to set it up for your Datadog account here.
If you’re not a customer, sign up for a 14-day full-featured free trial today to see how you can monitor and optimize your application performance with Datadog.


