Jordan Obey
In Part 2 of this series, we looked at how to use vSphere's built-in monitoring tools to get insight into core components of your vSphere environment, including virtual machines and their underlying hardware. Next, we'll show you how to use Datadog to get complete end-to-end visibility into the physical and virtual layers of your vSphere environment. Datadog collects metrics, traces, logs, and more into a single platform, so you can easily monitor the health and performance of vSphere as well as the applications and services you are running on your VMs, so you can make better resource and capacity planning decisions and ensure ESXi hosts and virtual machines continue to behave as expected.
In this post we will:
- Enable Datadog's vSphere integration to begin collecting data
- Visualize key vSphere metrics with Datadog dashboards
- Collect vSphere logs
- Collect traces and logs from applications running in your virtual environment
Enable Datadog's vSphere integration
Datadog's vSphere integration collects metrics and events from your vCenter Server. The integration is built into the Datadog Agent, which is open source software that collects monitoring data from the host it is installed on and forwards it to Datadog.
As we saw in Part 1, the vCenter Server manages your entire vSphere environment. Because of this, you only need to install the Agent on a single VM that's connected to your vCenter Server in order to collect data from all of your ESXi hosts, virtual machines, clusters, datastores, and data centers. To install the Agent, follow the instructions for the OS you're running on the VM you wish to install it on.
Configure vSphere metric collection
After installing the Agent, you'll need to configure it so that it has the necessary role-based permissions to begin collecting data from your environment. To do this, first log into the vSphere Web Client and create a user with read-only access. Name it datadog-readonly.
Next, SSH into the VM where you installed the Datadog Agent and navigate to its vpshere.d subdirectory. Make a copy of the conf.yaml.example template file and save it as conf.yaml. Now you can edit conf.yaml to configure the Agent's vSphere integration. To point the Agent to your vCenter Server, you'll need to update the host attribute of conf.yaml with the location of your vCenter Server instance and include your read-only user credentials so that it resembles the following:
init_config:instances: - host: example.vcenter.localdomain username: datadog-readonly password: example_password use_legacy_check_version: false empty_default_hostname: true collection_level: 1The example above includes a collection_level parameter which enables you to choose 1 of vSphere's 4 data collection levels and determine how many vSphere metrics the Agent can access. By default, collection_level is set to 1, but you can edit the configuration as necessary to meet your needs.
By default, the Agent will collect all available metrics emitted by your vSphere environment at the configured collection level. You can, however, edit the conf.yaml file's resource_filtersparameter so that the Agent only collects data from specific vSphere components. Filters are based on the following attributes:
resource, which defines what vSphere object to filter (e.g., a VM, host, cluster, datastore, or data center)property, which defines what metadata the Agent will use to filter objects (e.g., name, tag, hostname, etc.)type, which defines whether objects will be included or excluded from filter resultspatterns, which defines regex patterns that object properties will be compared to
Filters enable you to fine-tune what the Datadog Agent collects so that you can focus on the data you care about most. For instance, if you are only interested in data from specific hosts and the VMs running on them, you can edit the resource_filters parameters like the following:
Note: While this configuration includes the properties "whitelist" and "blacklist," these are terms Datadog plans to move away from going forward.
resource_filters:- resource: vm property: hostname type: whitelist patterns: - <vm_hostname_regex>- resource: host property: name type: whitelist patterns: - <host_name_regex>This configuration will look for and collect metrics from any VMs running on a host whose hostname matches the provided patterns as well any hosts whose name matches the given patterns.
Additional resource_filter options are available in the Agent's vSphere configuration template here.
The vSphere integration configuration file also includes a collection_type parameter which can be set to either realtime or historical. When collection_type is set to realtime, the Agent will collect metrics from ESXi hosts and VMs. When collection_type is set to historical, the Agent will collect metrics from resources that only report aggregated data, such as datastores, data centers, and clusters. By default, collection_type is set to realtime. If you'd like to enable collection of both realtime and historical metrics, we recommend creating an additional check instance and setting its collection_type to historical.
Once you've configured the integration, save conf.yaml and restart the Agent. In order to confirm that the Agent is properly reporting vSphere metrics, run a status check using the appropriate commands for your platform. If the Agent was configured correctly, after running a status check you should see something similar to the following underneath the header Running Checks:
vsphereTotal Runs: 1Metric Samples: Last Run: 33, Total: 90Events: Last Run: 3, Total: 15Service Checks: Last Run: 0, Total: 2Visualize your vSphere metrics
Now that you've enabled the integration, Datadog will automatically start collecting monitoring data from your vSphere objects and populating an out-of-the-box dashboard with key metrics we looked at in Part 1 of this series, including CPU usage, memory ballooning, and disk latency, so you can quickly visualize the health and performance of your environment.
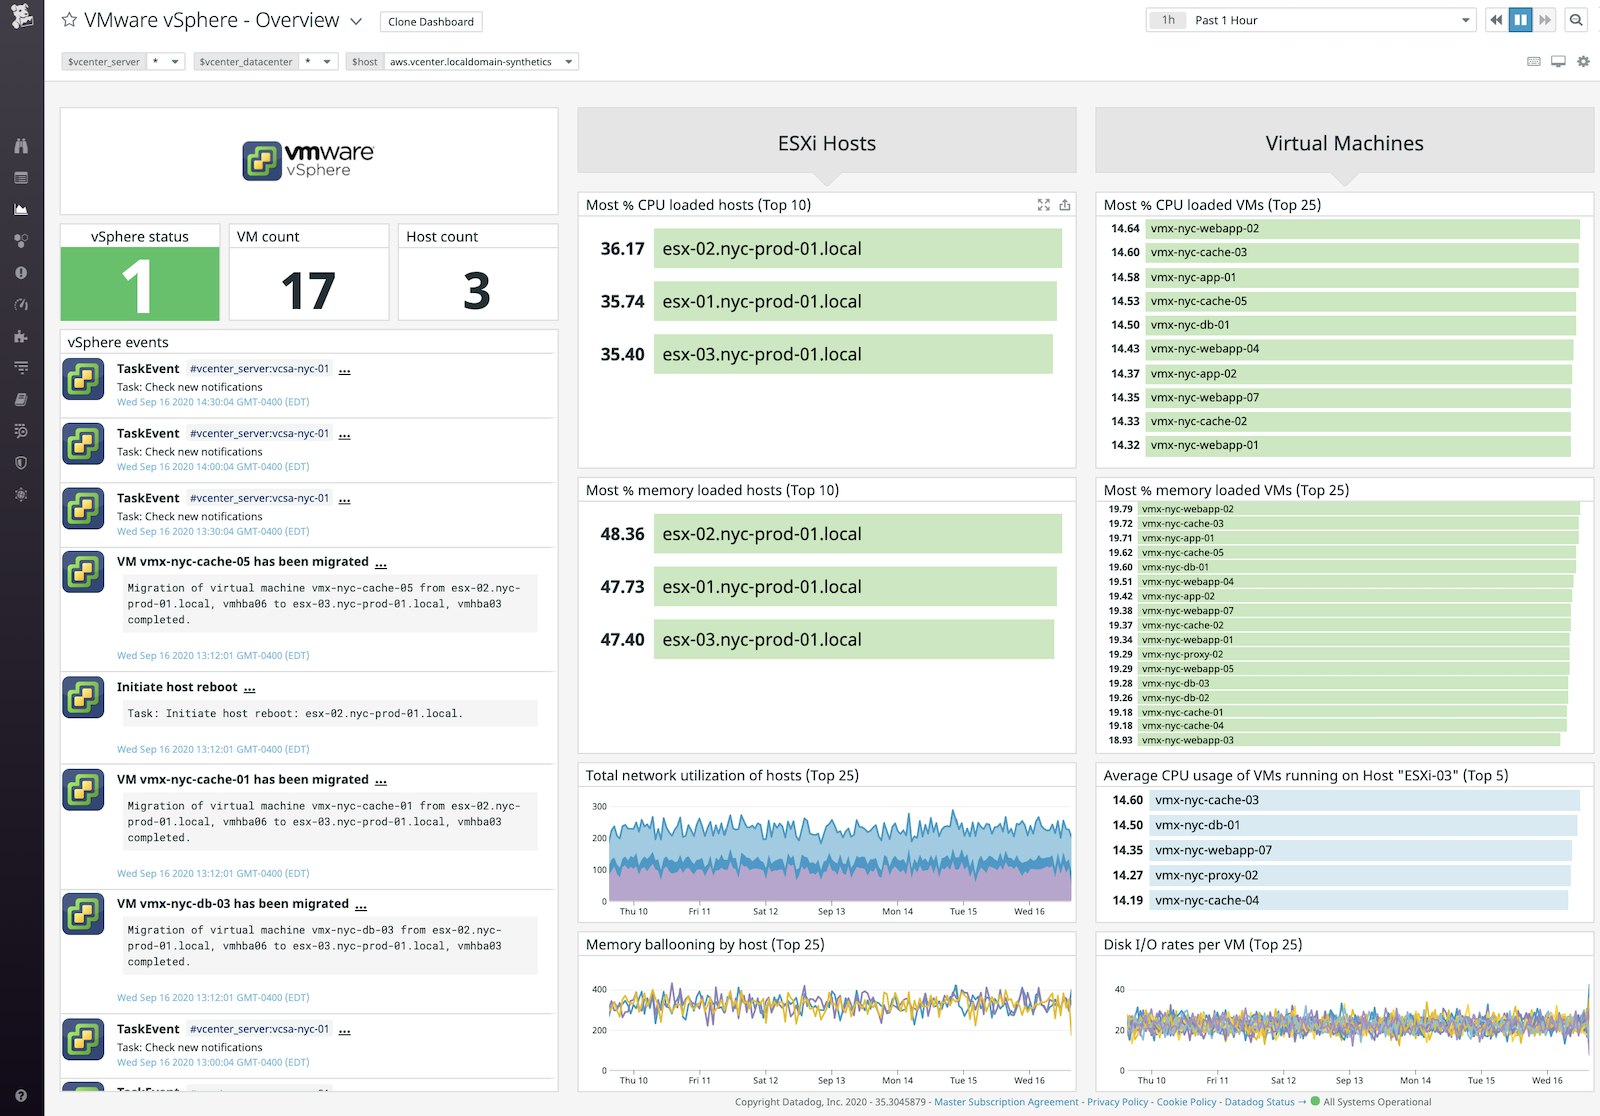
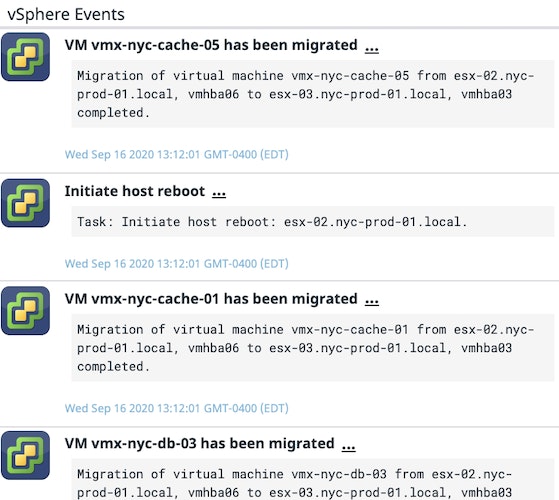
Datadog's vSphere dashboard also includes an event stream widget so you can quickly view the events and tasks that are being executed in your vSphere environment, including VM migrations and ESXi host reboots. Each event in the stream widget includes details such as the time the event or task was executed and which parts of your infrastructure were affected (e.g., the identity of the migrated VM and its destination host), providing you with deeper context into activity within your vSphere environment.
Monitor each layer of your vSphere environment with tags
Monitoring vSphere requires keeping track of metrics from each layer of your virtual environment. To help you do so, tags identify where metrics originated in your infrastructure (e.g., whether it was emitted by an ESXi host or cluster). Datadog automatically tags your vSphere metrics with identifying information like the names of VMs and ESXi hosts, as well as the cluster and data center they're running in. This means you can quickly identify overstressed parts of your infrastructure. For example, the default vSphere dashboard includes top lists that take the highest CPU and memory usage metrics, automatically tagged by ESXi host, and display them in descending order.

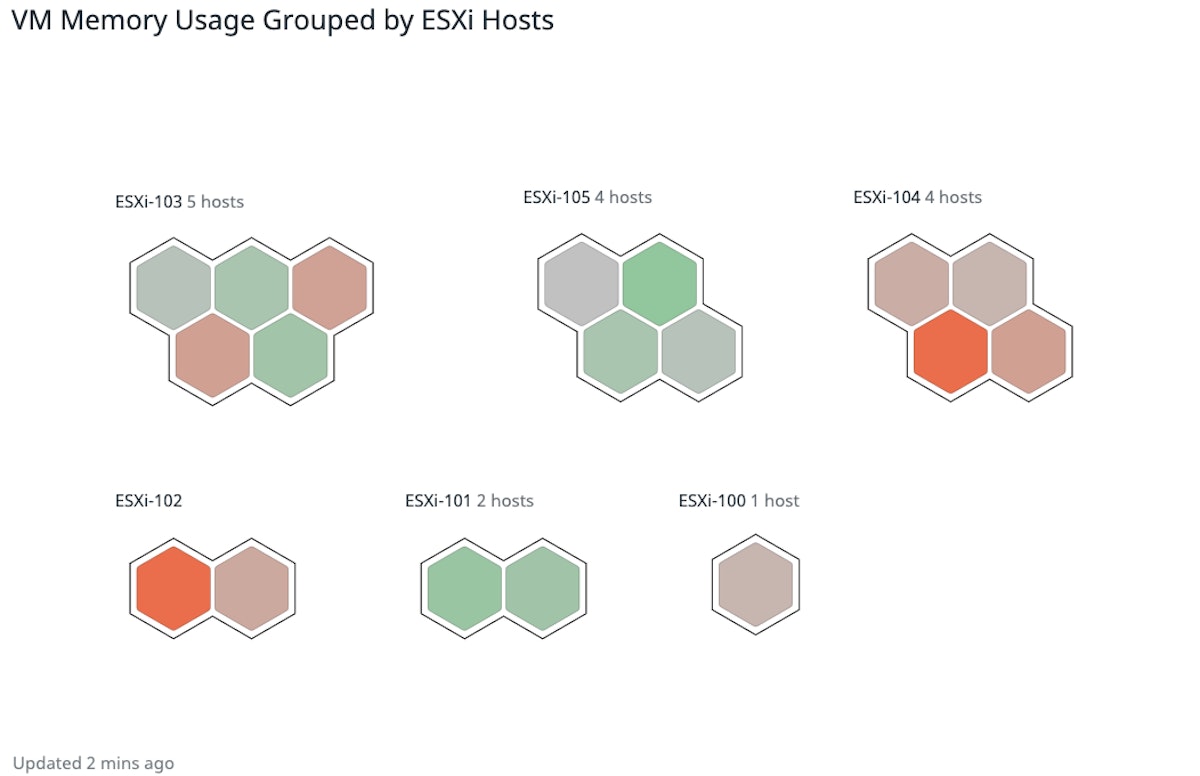
You can also use tags to organize the Host Map to visually group parts of your infrastructure for a high-level overview. For example, below we're grouping VMs together by their ESXi hosts. The VMs are color-coded based on their memory usage, making it simple to identify overloaded VMs and hosts at a glance.
You can also use tags to investigate the resource usage of VMs running on a specific ESXi host. For instance, you can search for the vsphere.cpu.usage.avg metric with the tags vsphere_host:ESXi-03and vsphere_type:vm to get a breakdown of the CPU usage of VMs running on a host named "ESXi-03." This way, you can quickly determine if a VM is overtaxing a host's CPU and whether you should migrate it to a new host.

Set alerts on vSphere metrics and detect issues early
Once you are using Datadog to collect monitoring data from your vSphere environment, you can easily set up alerts to automatically notify you of issues. For example, in Part 1 of this series, we looked at the importance of monitoring CPU readiness which, when above 5 percent, can seriously degrade VM performance. With Datadog, you can easily set up an alert across your VMs to notify you when CPU readiness on any of them surpasses the 5 percent threshold, allowing you to address the issue immediately.
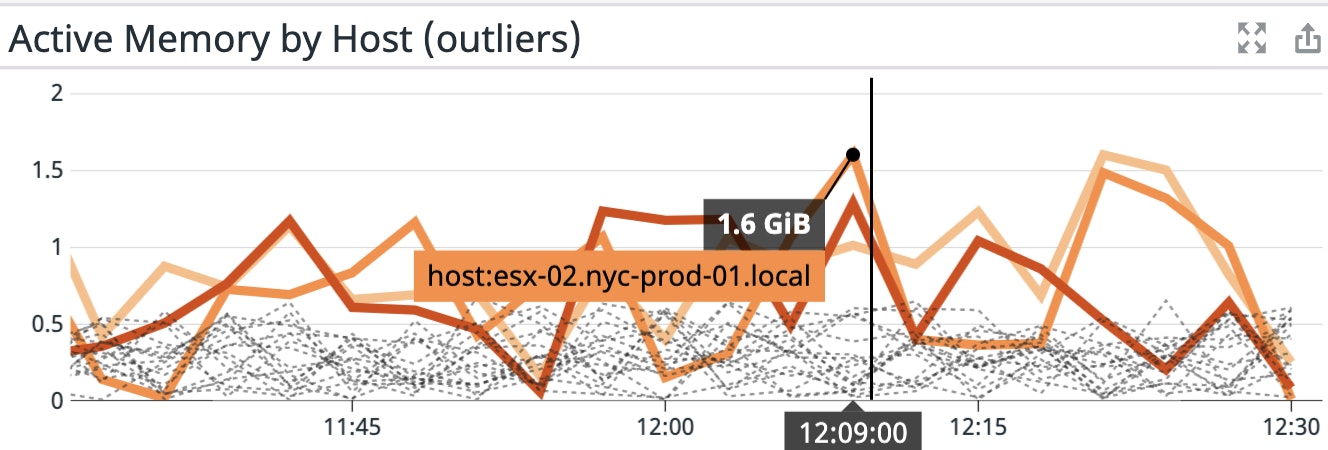
Datadog also includes dynamic alert types that can automatically detect anomalies and forecast trends, so you can be notified ahead of time of unusual performance degradation across certain parts of your infrastructure, or whether your VMs may soon begin to experience resource constraints. For example, you can use outlier detection to quickly determine if any VM in your cluster has started to use more memory than the others.
Forward vSphere logs to Datadog
In Part 2 of this series, we noted that you could send logs from your vSphere components to an external syslog endpoint for long-term retention. You can then forward all of these logs to Datadog in order to search and analyze them and troubleshoot issues in your vSphere environment in real time. In order to collect vSphere logs with Datadog, you first set up the vCenter Server and ESXi hosts to forward logs to a syslog server with a Datadog Agent installed on it. This way, you can then tail the resulting log files and forward them on to Datadog.
First, ensure that the Agent running on the syslog server has log collection enabled. Next, create a custom configuration file named something similar to <vsphere_logs>.d/conf.yaml within the Agent's conf.d directory and point it to the location of the logs you want to collect. For example, the following is a configuration that tells the Agent to collect vCenter logs saved under the file path /var/log/example_host/vcenter.log:
logs: - type: file path: "/var/log/example_host/vcenter.log" service: "vcenter" source: "vsphere"Note that custom log configuration files require that service and source parameters are set. The source tag lets you create log processing pipelines that will automatically parse ingested logs and enrich them with metadata so that you can filter, group, and search them easier for analysis. The service tag links your logs with related monitoring data so that you can seamlessly pivot between logs and relevant metrics or traces.
Any log, any time
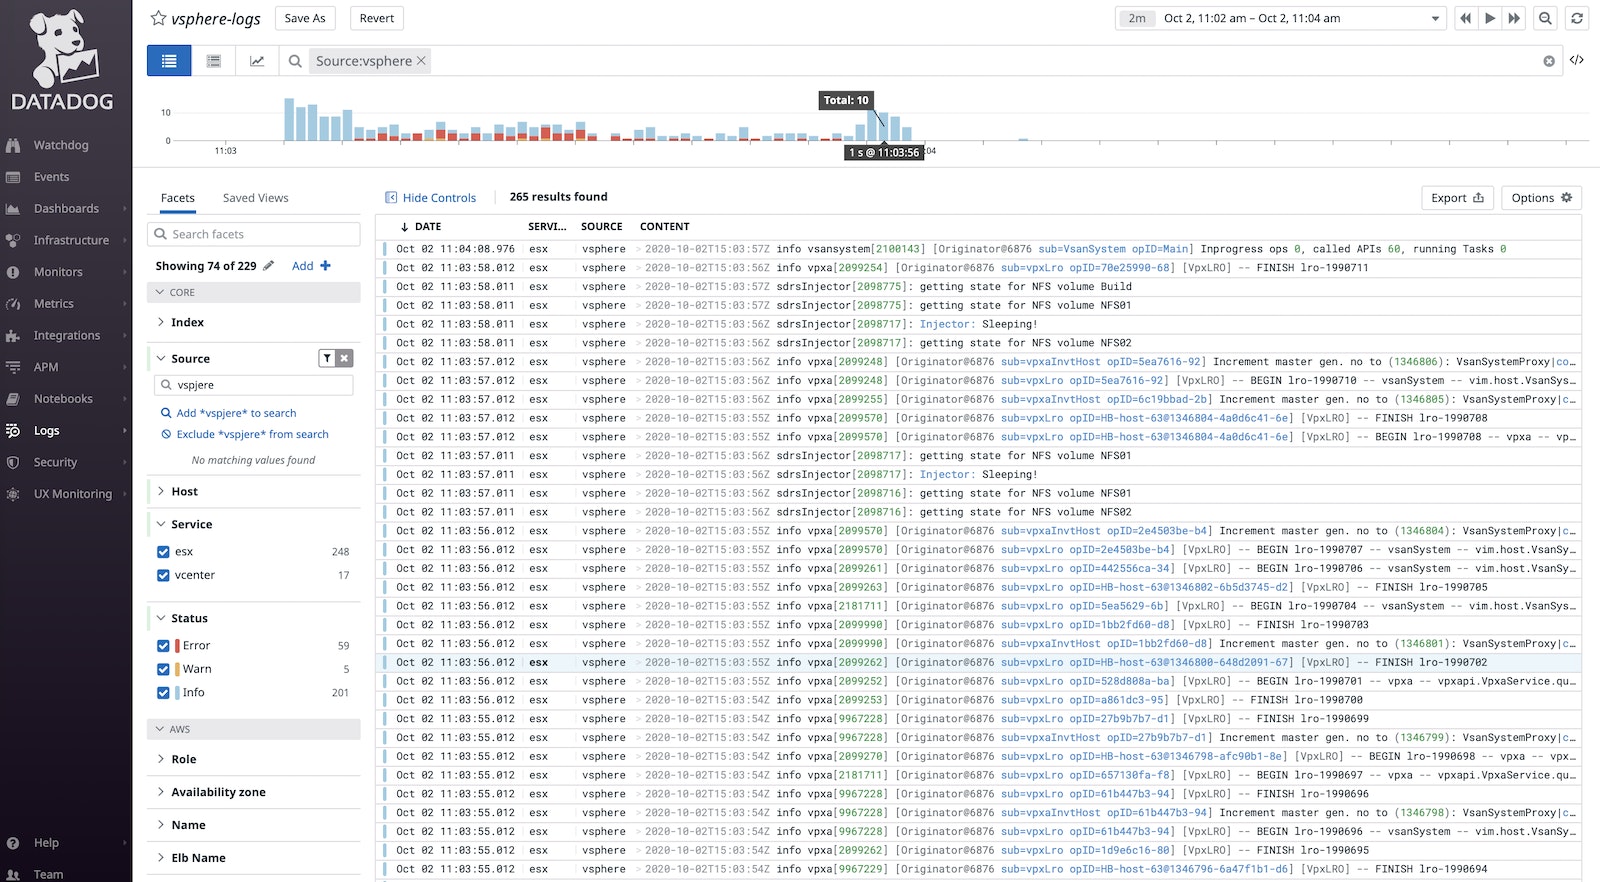
As your vSphere environment grows in size and complexity, it will produce large volumes of logs, making it a challenge to manage them and predict which ones will be necessary for troubleshooting. With Datadog's logging features, you can manage large volumes of vSphere logs quickly and easily. For instance, Datadog's log patterns automatically groups together similar logs to make large volumes of them easier to navigate and investigate by identifying what elements are appearing in a lot of logs (such as a specific host emitting a lot of errors). Creating log-based metrics enables you to identify and alert on log trends like you would metrics.
With Datadog's Logging without Limits™, you can select what logs you want to index for searching and analysis while indexing the rest in your own long-term cloud storage solution. Datadog fully processes all of your logs on ingestion, meaning that you can view a Live Tail of 100 percent of your logs and generate log-based metrics on all of your vSphere logs without needing to index them. You can then rehydrate archived logs at any time.
Monitor the applications running in your virtual environment
So far we've looked at how administrators can use Datadog to view the health and capacity of their vSphere infrastructure. Now, we'll cover how developers can use Datadog to monitor the status and performance of the applications and services running on their virtual machines by collecting:
Collect distributed traces
Datadog APM provides full visibility into the performance of your applications by collecting distributed traces.
To track application performance in your virtual environment, you'll need to install a local Datadog Agent onto each VM running applications you wish to monitor.
After installing the Agent, instrument your applications to begin collecting distributed traces from them. Datadog includes trace client libraries for Java, Python, Ruby, and more. For instructions on instrumenting applications developed in your language, visit our APM documentation.
When you instrument your applications, we recommend setting the environment variables DD_ENV, DD_VERSION, and DD_SERVICE. This propagates env, version, and service tags across performance data from your applications. Consistent tagging across applications allows you to seamlessly navigate between your applications' metrics, traces, and logs so you can easily investigate and troubleshoot.
Once your application begins sending traces, Datadog visualizes key application performance metrics for your services, including request throughput, latency, and errors. You can view flame graphs that break down individual requests as they propagate across your infrastructure to surface bottlenecks and errors.
Collect logs from VM-hosted applications
Earlier, we looked at how to forward logs from vSphere inventory objects to Datadog for centralized log management. You can also use Datadog to automatically collect the logs emitted by applications running on your VMs for alerting, correlation, and analysis. First, in each locally installed Agent's main configuration file, set the logs_enabled parameter to true. Then, follow the instructions for setting up log collection in the documentation for the language used to develop your application.
After you've set up application log collection, Datadog will automatically stream logs to the Log Explorer to make it easy to investigate and troubleshoot issues.
Monitoring your whole stack alongside vSphere
In addition to the vSphere integration, the Agent includes over 850 integrations you can configure to monitor any technology running on your VMs. This means you can extend your investigation of vSphere health and capacity issues into application performance to determine if a particular service is negatively impacting your virtual environment.
Note that by default, the Agent running your vSphere integration reports report Fully Qualified Domain Names (FQDN) for ESXi hosts and VMs, while the Agents locally installed on VMs to monitor applications report "short hostnames." To ensure that the Agent running the vSphere integration and the locally installed Agents report hostnames using the same format, Datadog recommends setting the use_guest_hostname parameter in the vSphere integration configuration file and the hostname_fqdn parameter in each locally installed Agent's main configuration file to true.
Ensuring that all Agents report the same hostnames means you can seamlessly pivot from application-level and service-level metrics and logs to related system metrics from the underlying vSphere infrastructure, giving you a single pane of glass to monitor your entire stack.
One platform, full visibility
In this post, we looked at how collecting and monitoring metrics and logs from your vSphere components with Datadog gives you full visibility into your entire environment in one unified platform. This means you can quickly understand the health and performance of your infrastructure, scale your vSphere resources appropriately, and identify and troubleshoot issues. And, with more than 850 integrations, you can easily use Datadog to start monitoring your vSphere infrastructure alongside any technologies and services you have running in your virtualized environment. To get started monitoring your vSphere hosts and VMs, see our documentation. Or start using Datadog today with a 14-day free trial.


