Alex Guo

Erica Ho

David Pointeau

Kyra Abbu

Mahip Deora

Alan Zhao
The year 2025 marked a major milestone in the Datadog integrations ecosystem as we surpassed 1,000 integrations. Along the way, we also added over 110 new technology partners and expanded coverage across the fastest growing software categories, including AI, distributed security, hybrid infrastructure, and data intelligence.
This recap highlights the most impactful integrations we released this year and how they connect to these broader technology trends.
AI observability and cost control
AI adoption accelerated throughout the enterprise, so we prioritized integrations that give teams visibility into the full AI lifecycle across usage, performance, and cost.
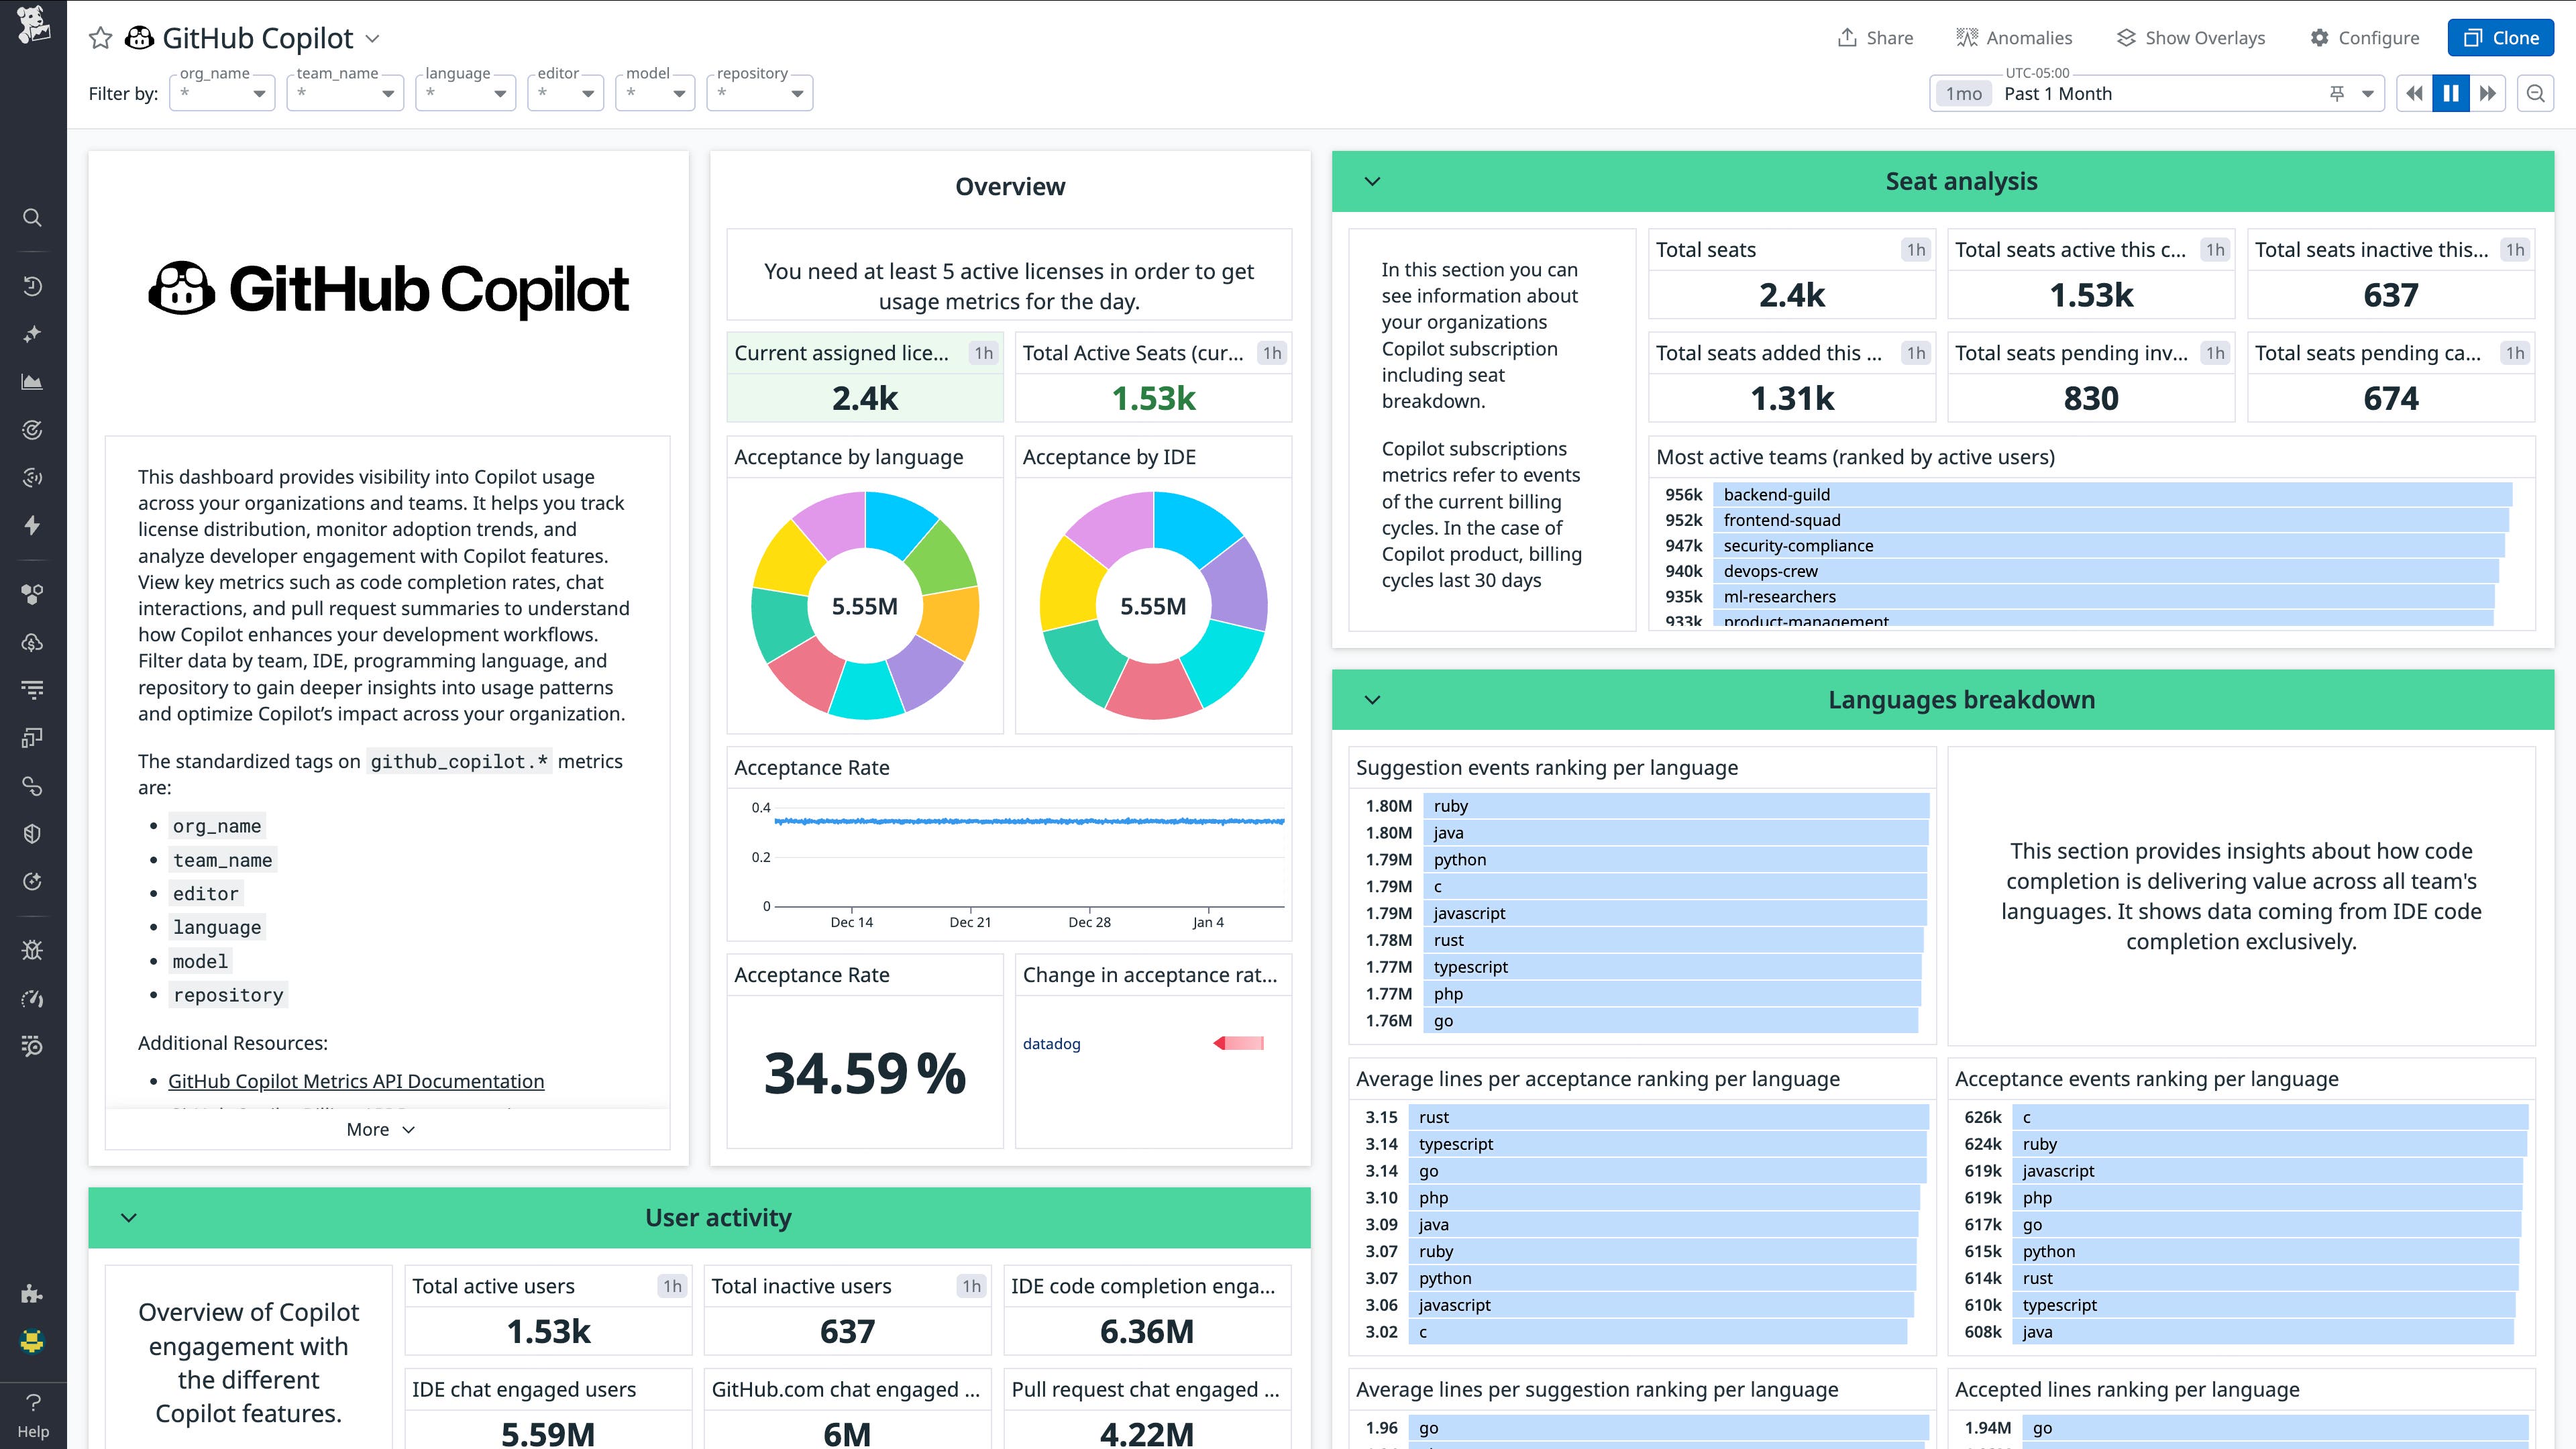
AI workflows typically start with AI-assisted coding tools. Datadog’s GitHub Copilot integration combines usage data with engineering metrics to show how AI-generated code impacts productivity and where licenses are going unused. Our Microsoft Copilot integration extends this visibility to both IDEs and Microsoft 365 applications so that teams can track adoption and engagement.
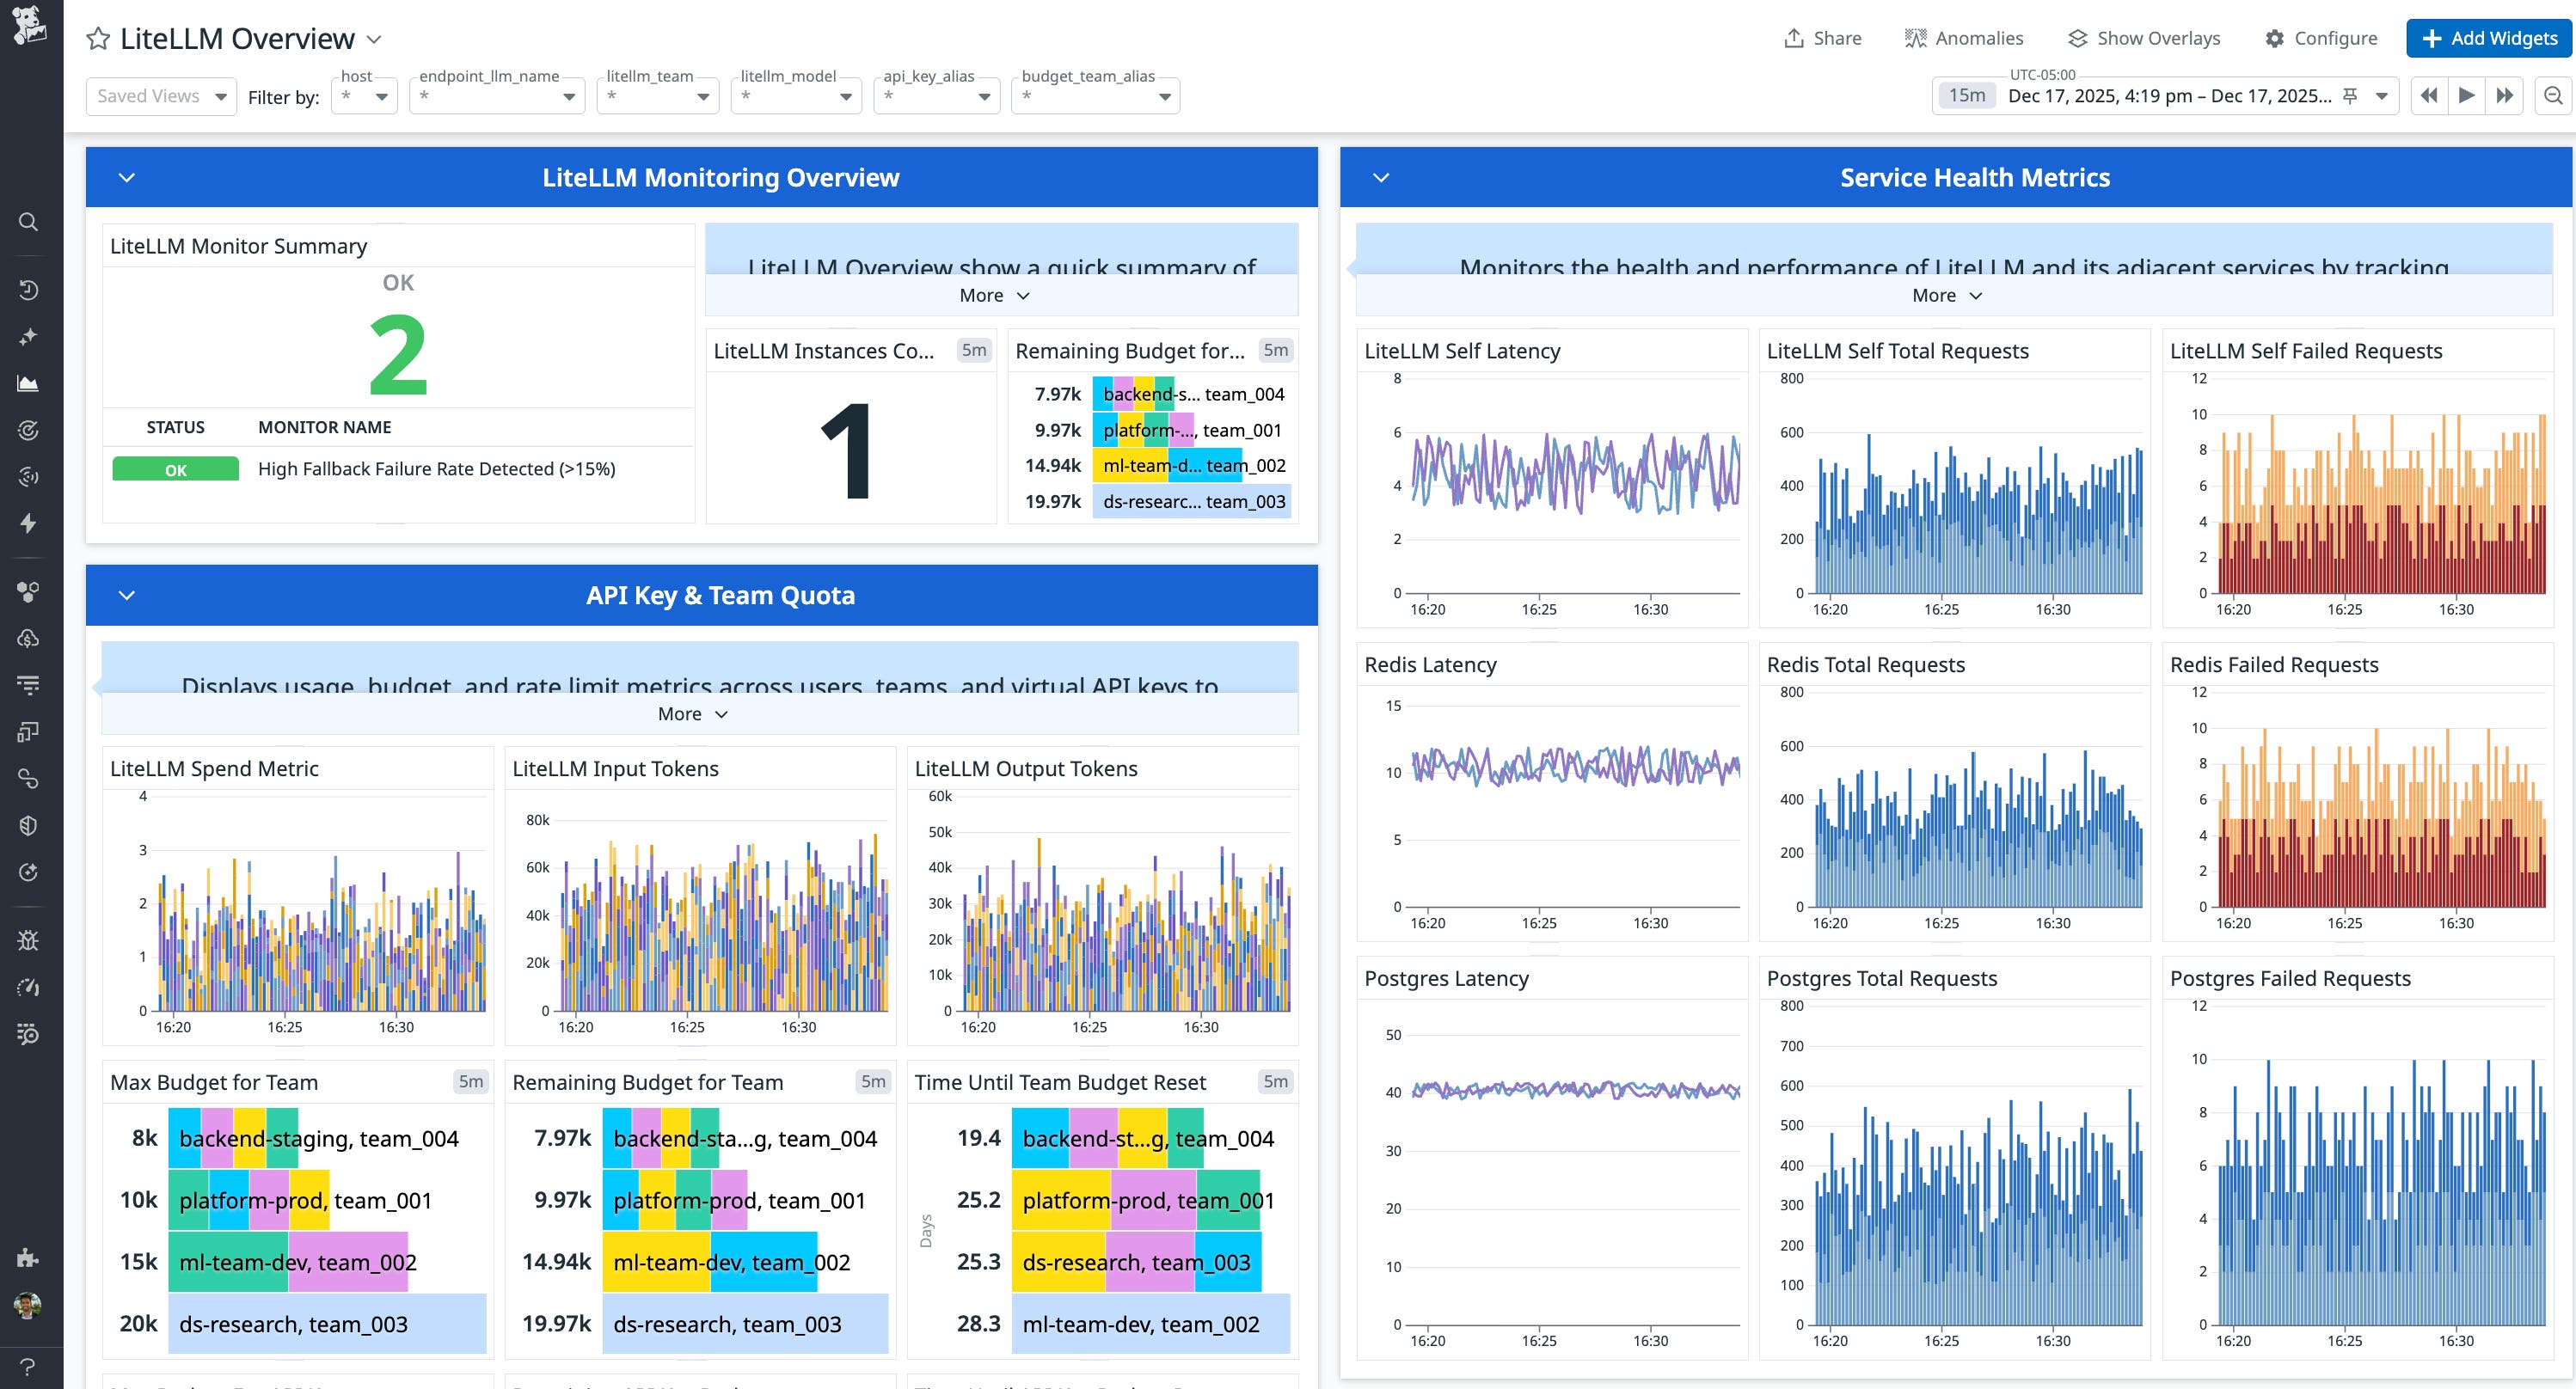
Once applications start making LLM requests, teams need visibility into request performance. They also need visibility into the AI infrastructure behind those requests, from LLM gateways to self-hosted model frameworks. Datadog’s LiteLLM integration traces every request sent to the gateway from prompt to response, including coverage of latency, token usage, and cost. BentoML adds visibility into model serving and inference pipelines, making it easier to monitor machine learning deployments at scale and troubleshoot model performance issues. Hugging Face adds visibility into self-hosted LLM model usage and API calls, helping teams track the reliability and performance of inference endpoints. Cursor expands both by showing how AI agents and coding assistants run inside development environments, helping teams understand the impact of automated workflows.
AI models perform best with fast, reliable access to data, so we expanded visibility into the systems that store and serve that data. Datadog’s Supabase integration shows how Postgres-backed vector and application data are used in AI workflows, including in query performance and storage patterns.
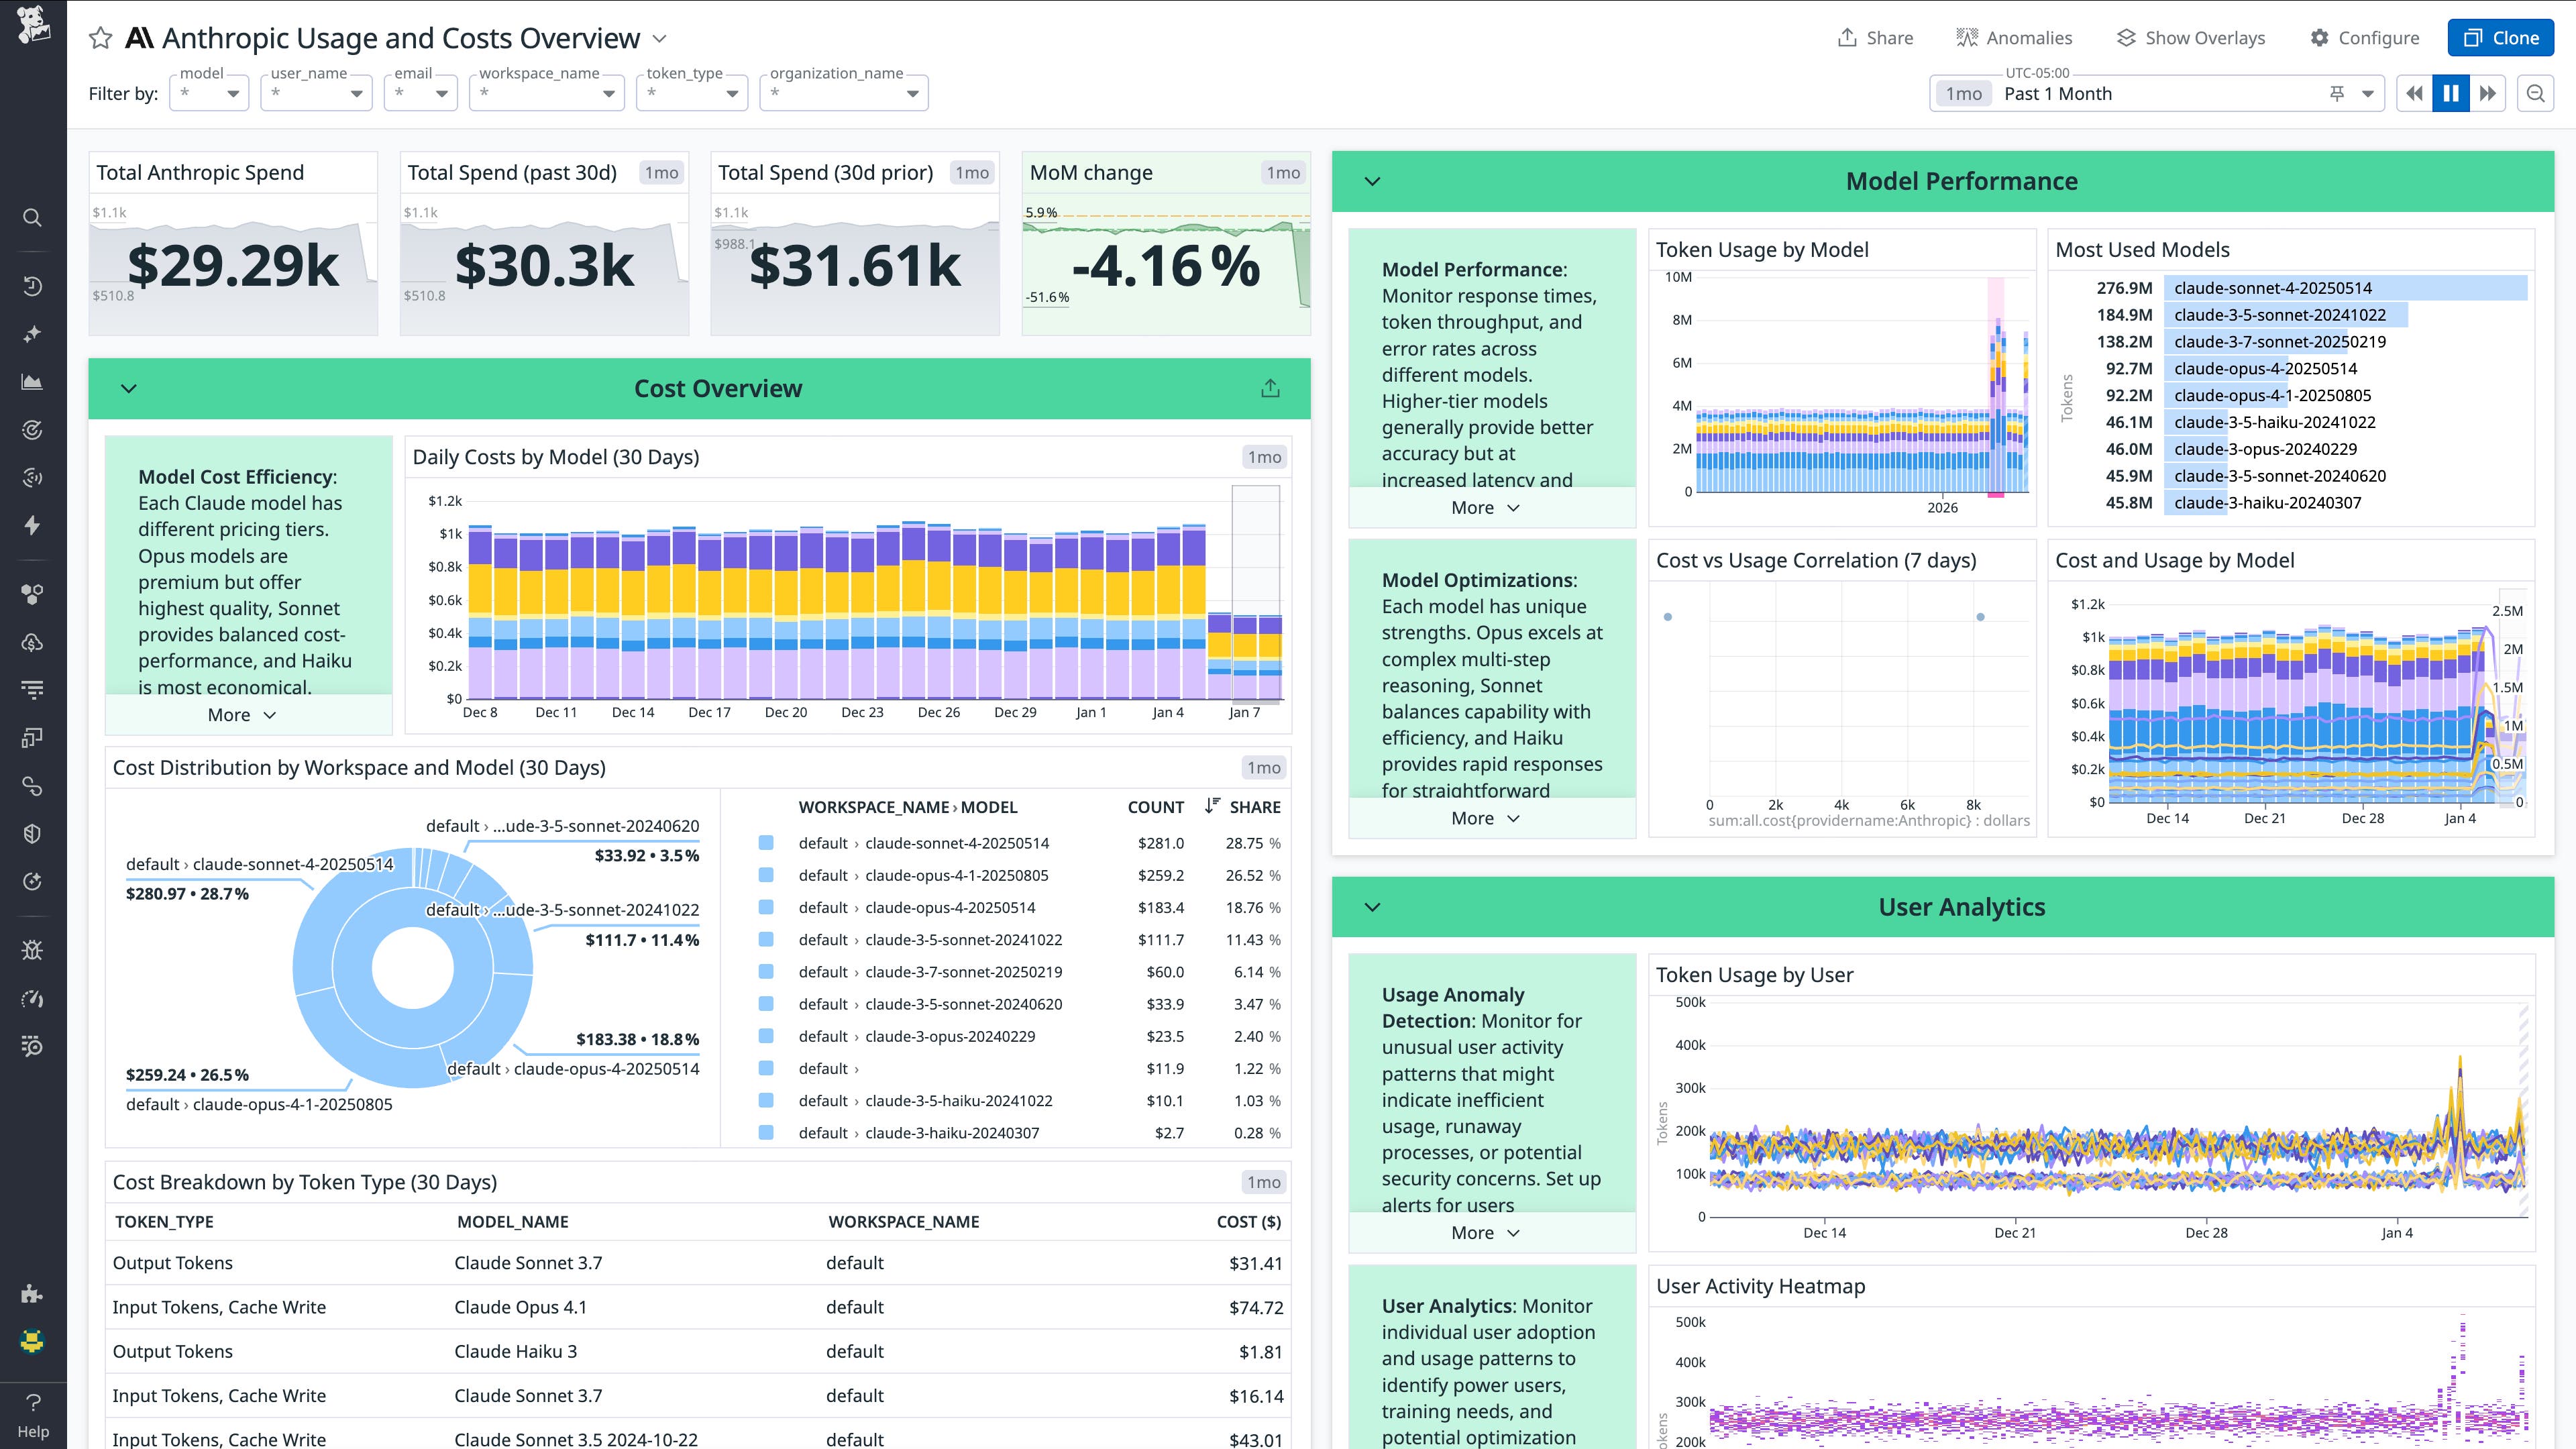
Finally, we addressed the growing need to understand how much AI actually costs. Datadog’s Cloud Cost Management now supports Anthropic and GitHub costs, giving finance and operations teams insight into usage, spend, and performance across multiple AI providers. This makes it easier to identify which workloads drive spend and how to forecast future costs.
For a deeper look into Datadog’s AI coverage, explore our full AI integrations roundup blog.
Security and threat intelligence
Security challenges grew more complex as organizations adopted more SaaS tools, remote endpoints, and cloud services. These changes created new blind spots in how threats emerge and move across distributed environments. To close these gaps, we expanded Datadog Cloud SIEM with a number of integrations that give teams visibility across every stage of an attack.
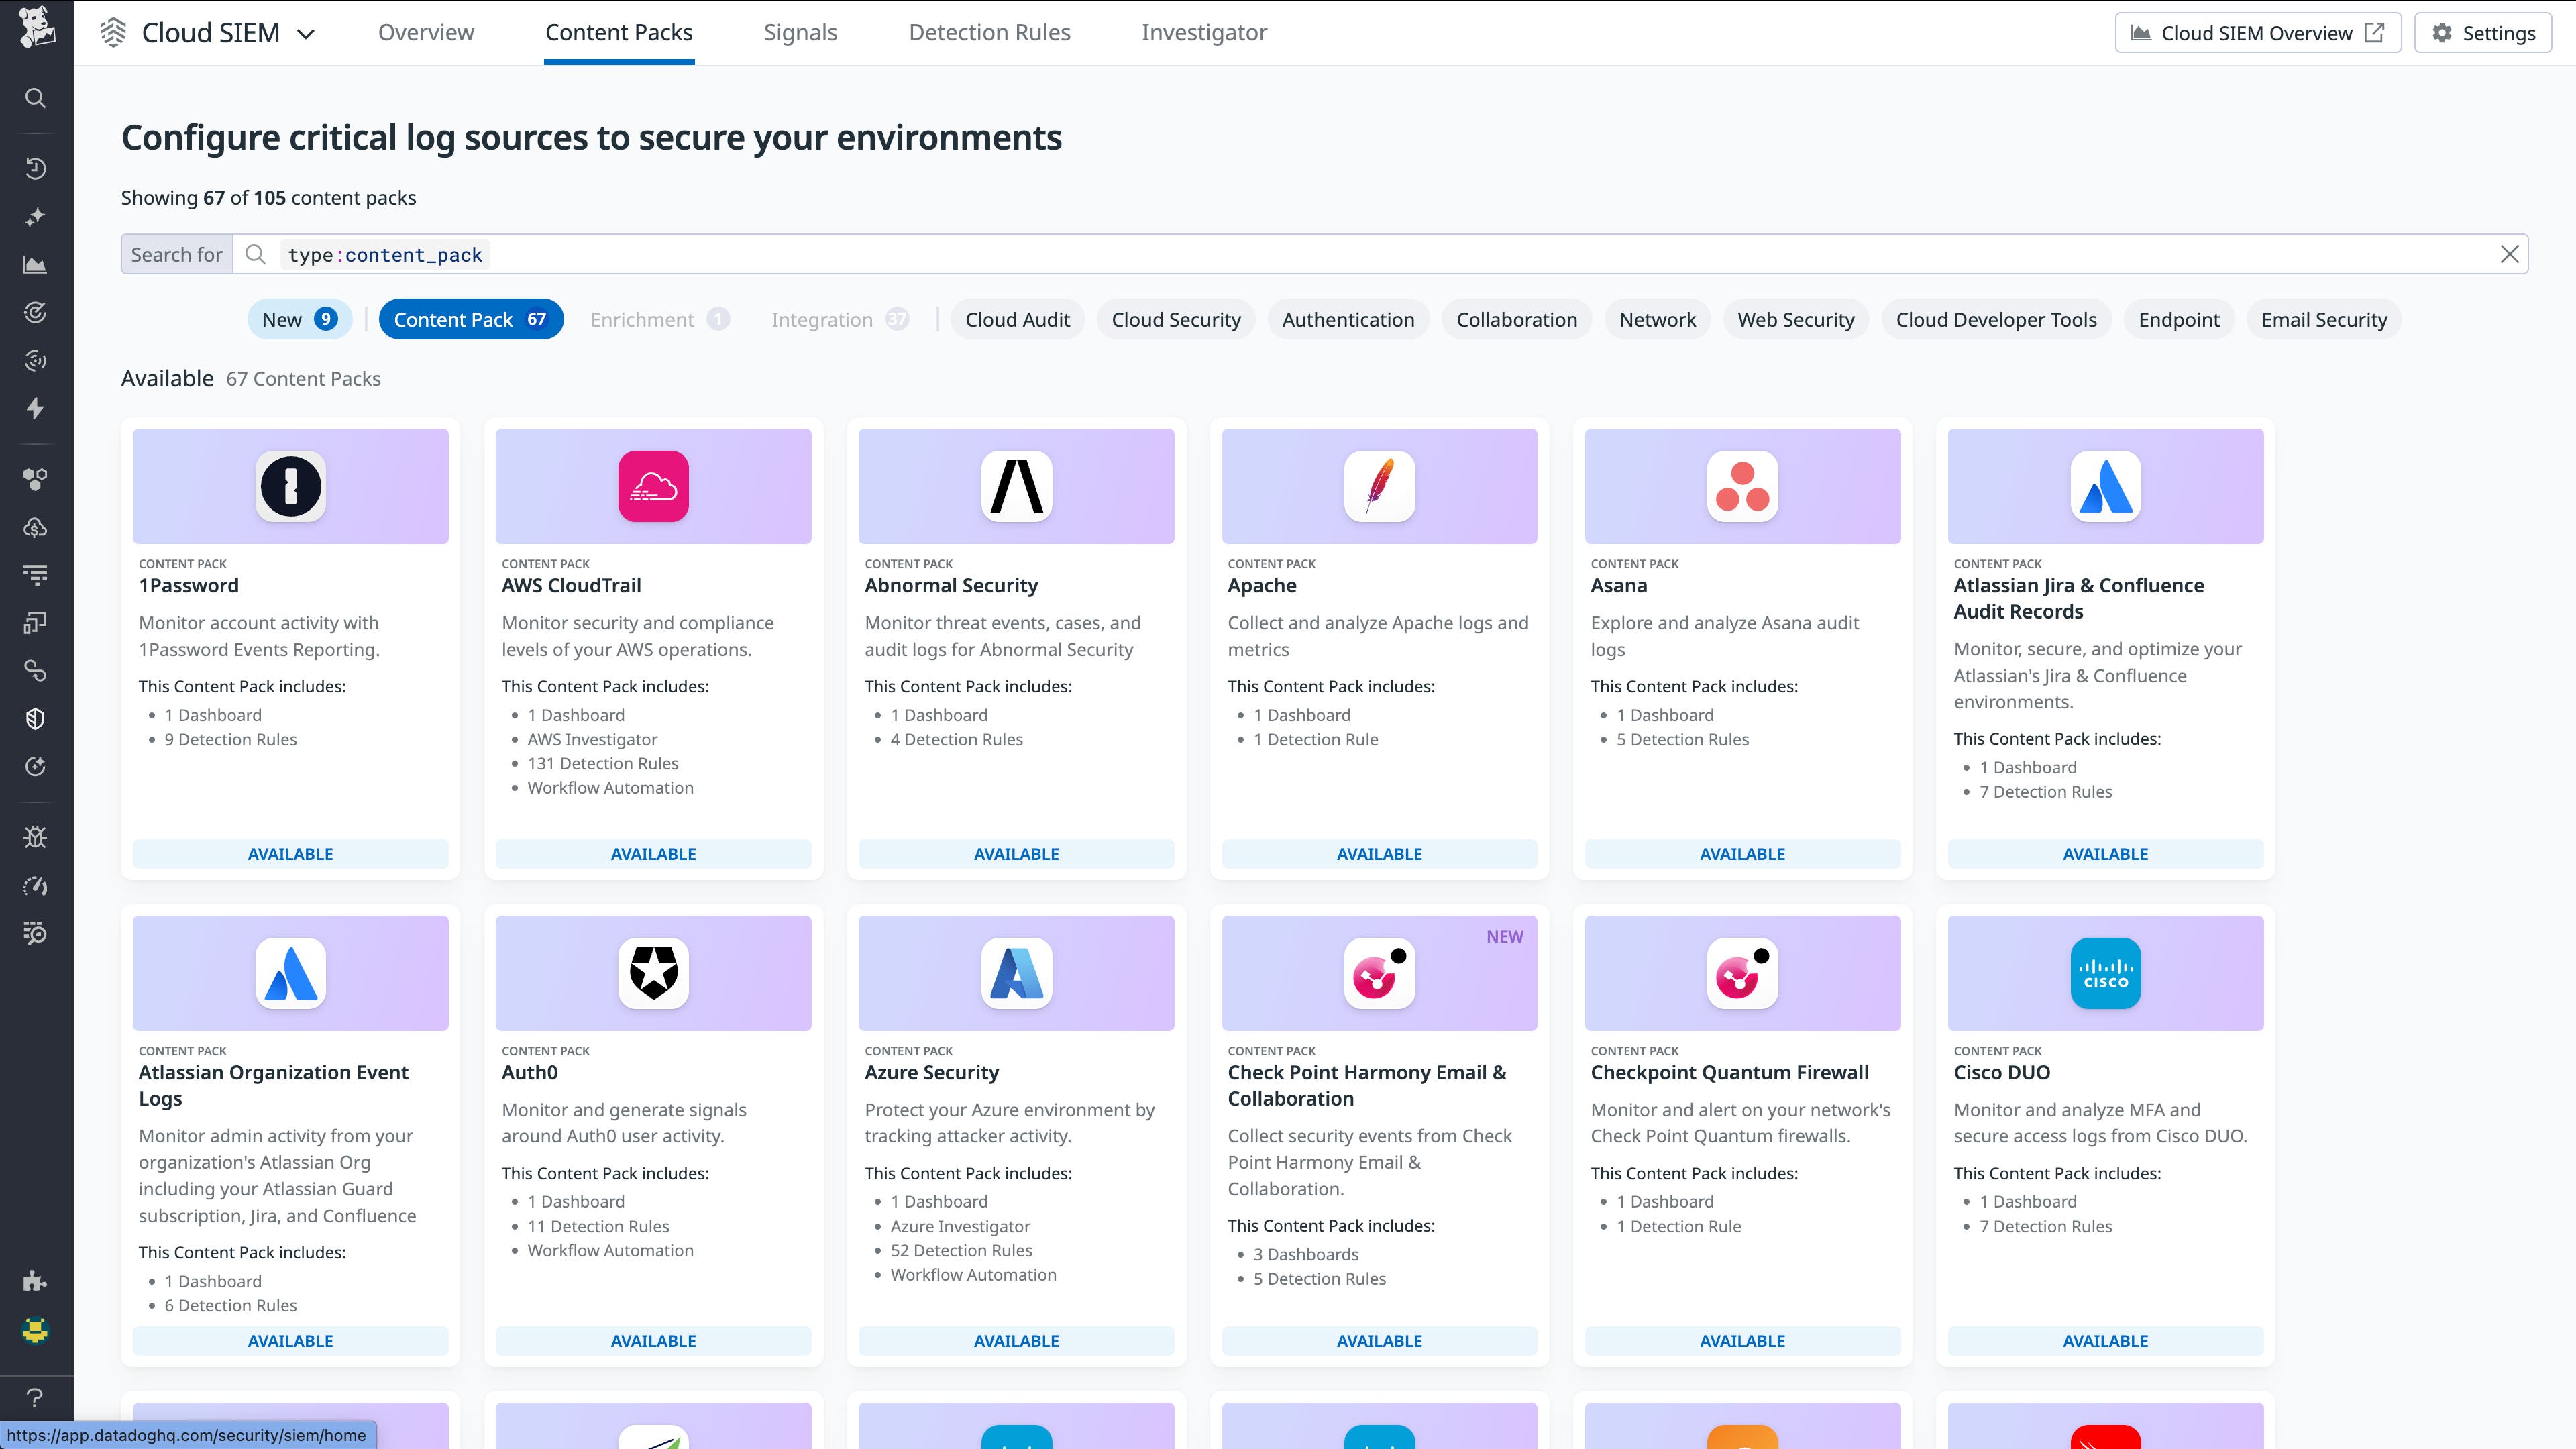
First, teams need clear visibility into risks across their cloud environment. Datadog’s Wiz integration brings cloud configuration, vulnerability, identity, and exposure data into Datadog, helping teams identify risky assets and prioritize the issues that most likely lead to real attacks. When combined with Datadog logs and Cloud SIEM detections, this context makes it easier to reduce blind spots and respond quickly to threats.
Next, teams need context into what threat actors do once they’re inside your systems. Datadog’s Falco integration adds runtime security monitoring for containers and Kubernetes, tracking system calls in hosts and Kubernetes pods. Alerts such as unexpected process execution or privilege escalations can then be correlated with metrics, logs, and traces across the stack.
Finally, many risks emerge through cloud and web access. Datadog’s Netskope integration collects transaction event logs, including accessed URLs and HTTP request details. It correlates them with Cloud SIEM events to help teams detect unusual behavior, identify potential data leaks, and respond to threats faster across SaaS, web, and private cloud environments.
Hybrid cloud and distributed systems
Growth in AI and data workloads pushed many organizations to adopt hybrid architectures spanning on-prem, cloud, and edge. These environments are powerful but complex, requiring teams to maintain constant visibility across compute, orchestration, and networking. Datadog expanded its coverage this year to help teams monitor each layer of these distributed systems.
To improve visibility into on-prem compute, we built a Proxmox integration that provides hypervisor monitoring for virtualized workloads. This capability enables teams to collect metrics on CPU, memory, and network performance across virtual machines and clusters. In turn, this makes it easier to keep environments running smoothly and detect resource bottlenecks before they impact end users.
We also expanded coverage for modern orchestration systems, giving teams deeper insight into how distributed jobs and workflows run across their environments. Datadog’s Temporal Cloud integration ingests metrics on workflow execution, task duration, and failure patterns to help improve reliability. Next, Octopus Deploy provides visibility into deployment pipelines so that teams can track release performance and identify bottlenecks. Celery, for its part, adds monitoring to distributed task queues, allowing teams to troubleshoot slow or stuck jobs and optimize throughput.
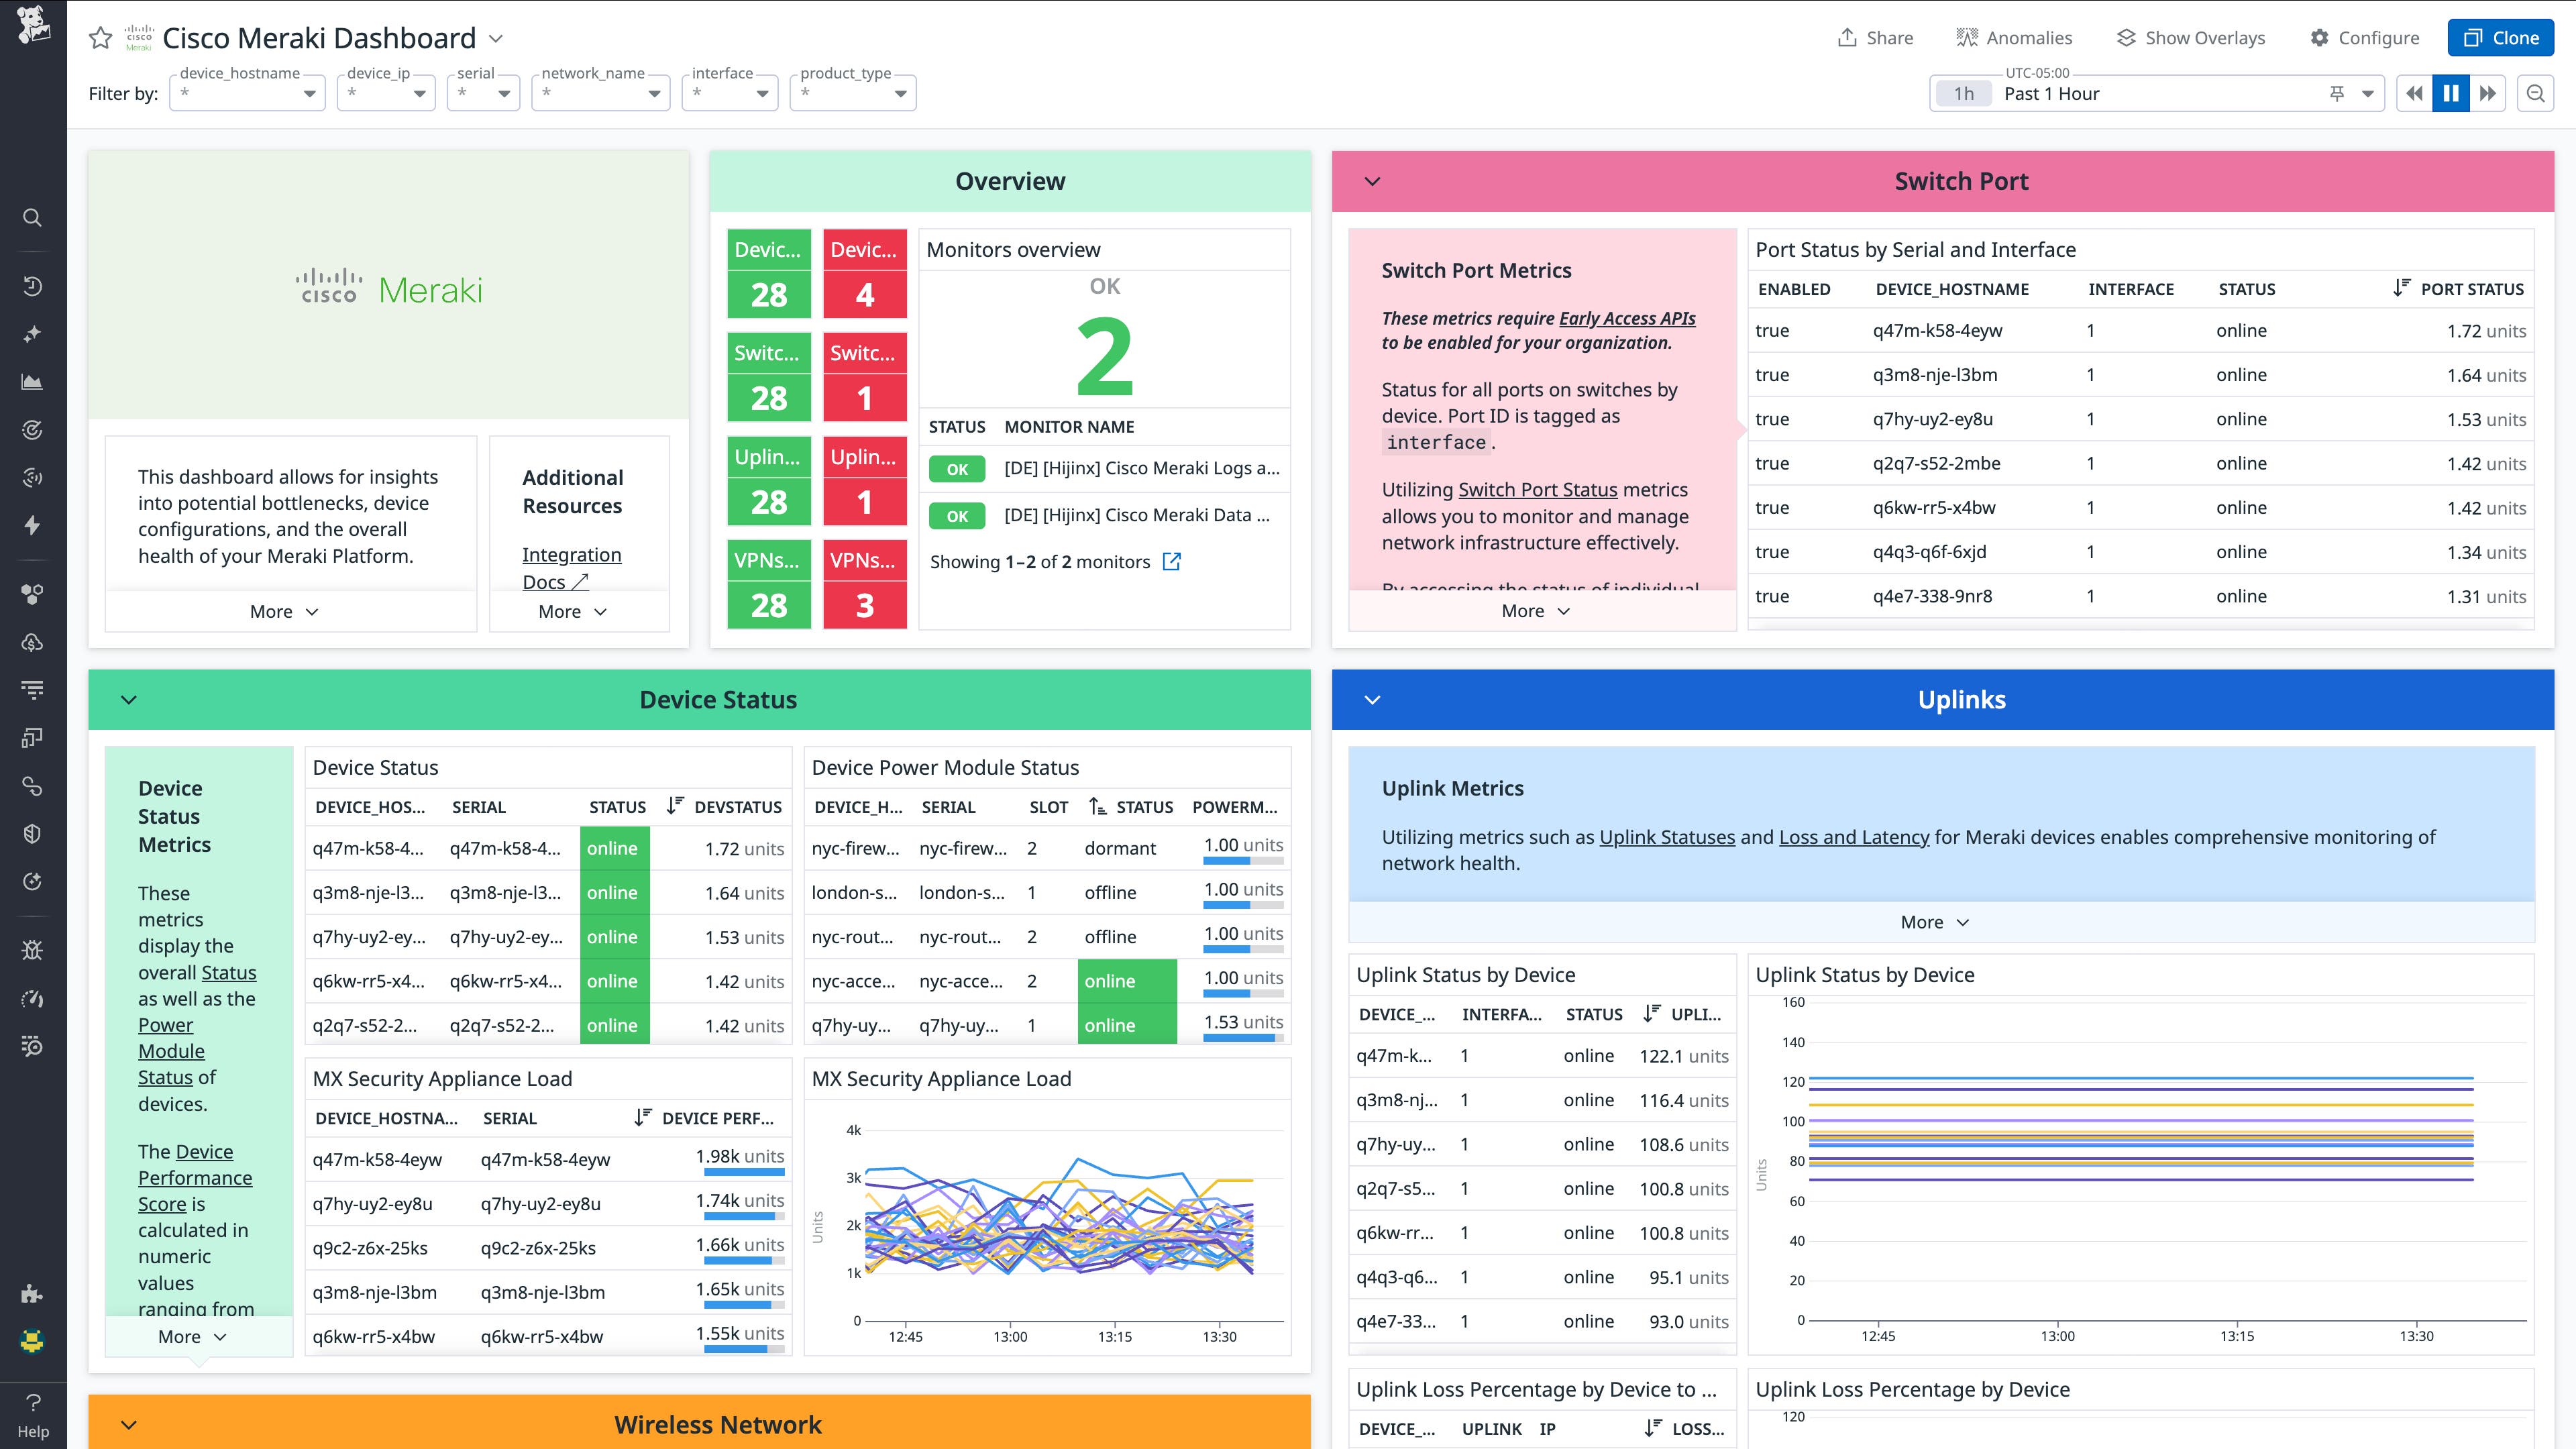
Reliable distributed systems also depend on stable networks, so we expanded Datadog Network Monitoring to cover devices across branch offices, data centers, and edge locations. Datadog’s Cisco Meraki integration helps teams monitor access points, switches, and security appliances to quickly diagnose branch-level connectivity issues. Fortinet, meanwhile, provides visibility into firewall and gateway performance to detect network degradation early. Finally, VeloCloud SD-WAN tracks link quality, traffic paths, and site availability to help keep distributed networks running smoothly.
Data and analytics visibility
Organizations are becoming more data-driven, increasingly requiring clearer insight into the performance of analytics systems and how they support business outcomes. To help address this need, we expanded integrations to give teams a complete view across BI tools, data pipelines, and digital experience platforms.
Understanding system performance often requires business context, so we expanded Datadog Reference Tables to directly import external business or ownership context from SaaS platforms like Snowflake, Salesforce, ServiceNow, and Databricks into Datadog. This helps organizations tie performance and cost data back to teams, projects, and business outcomes.
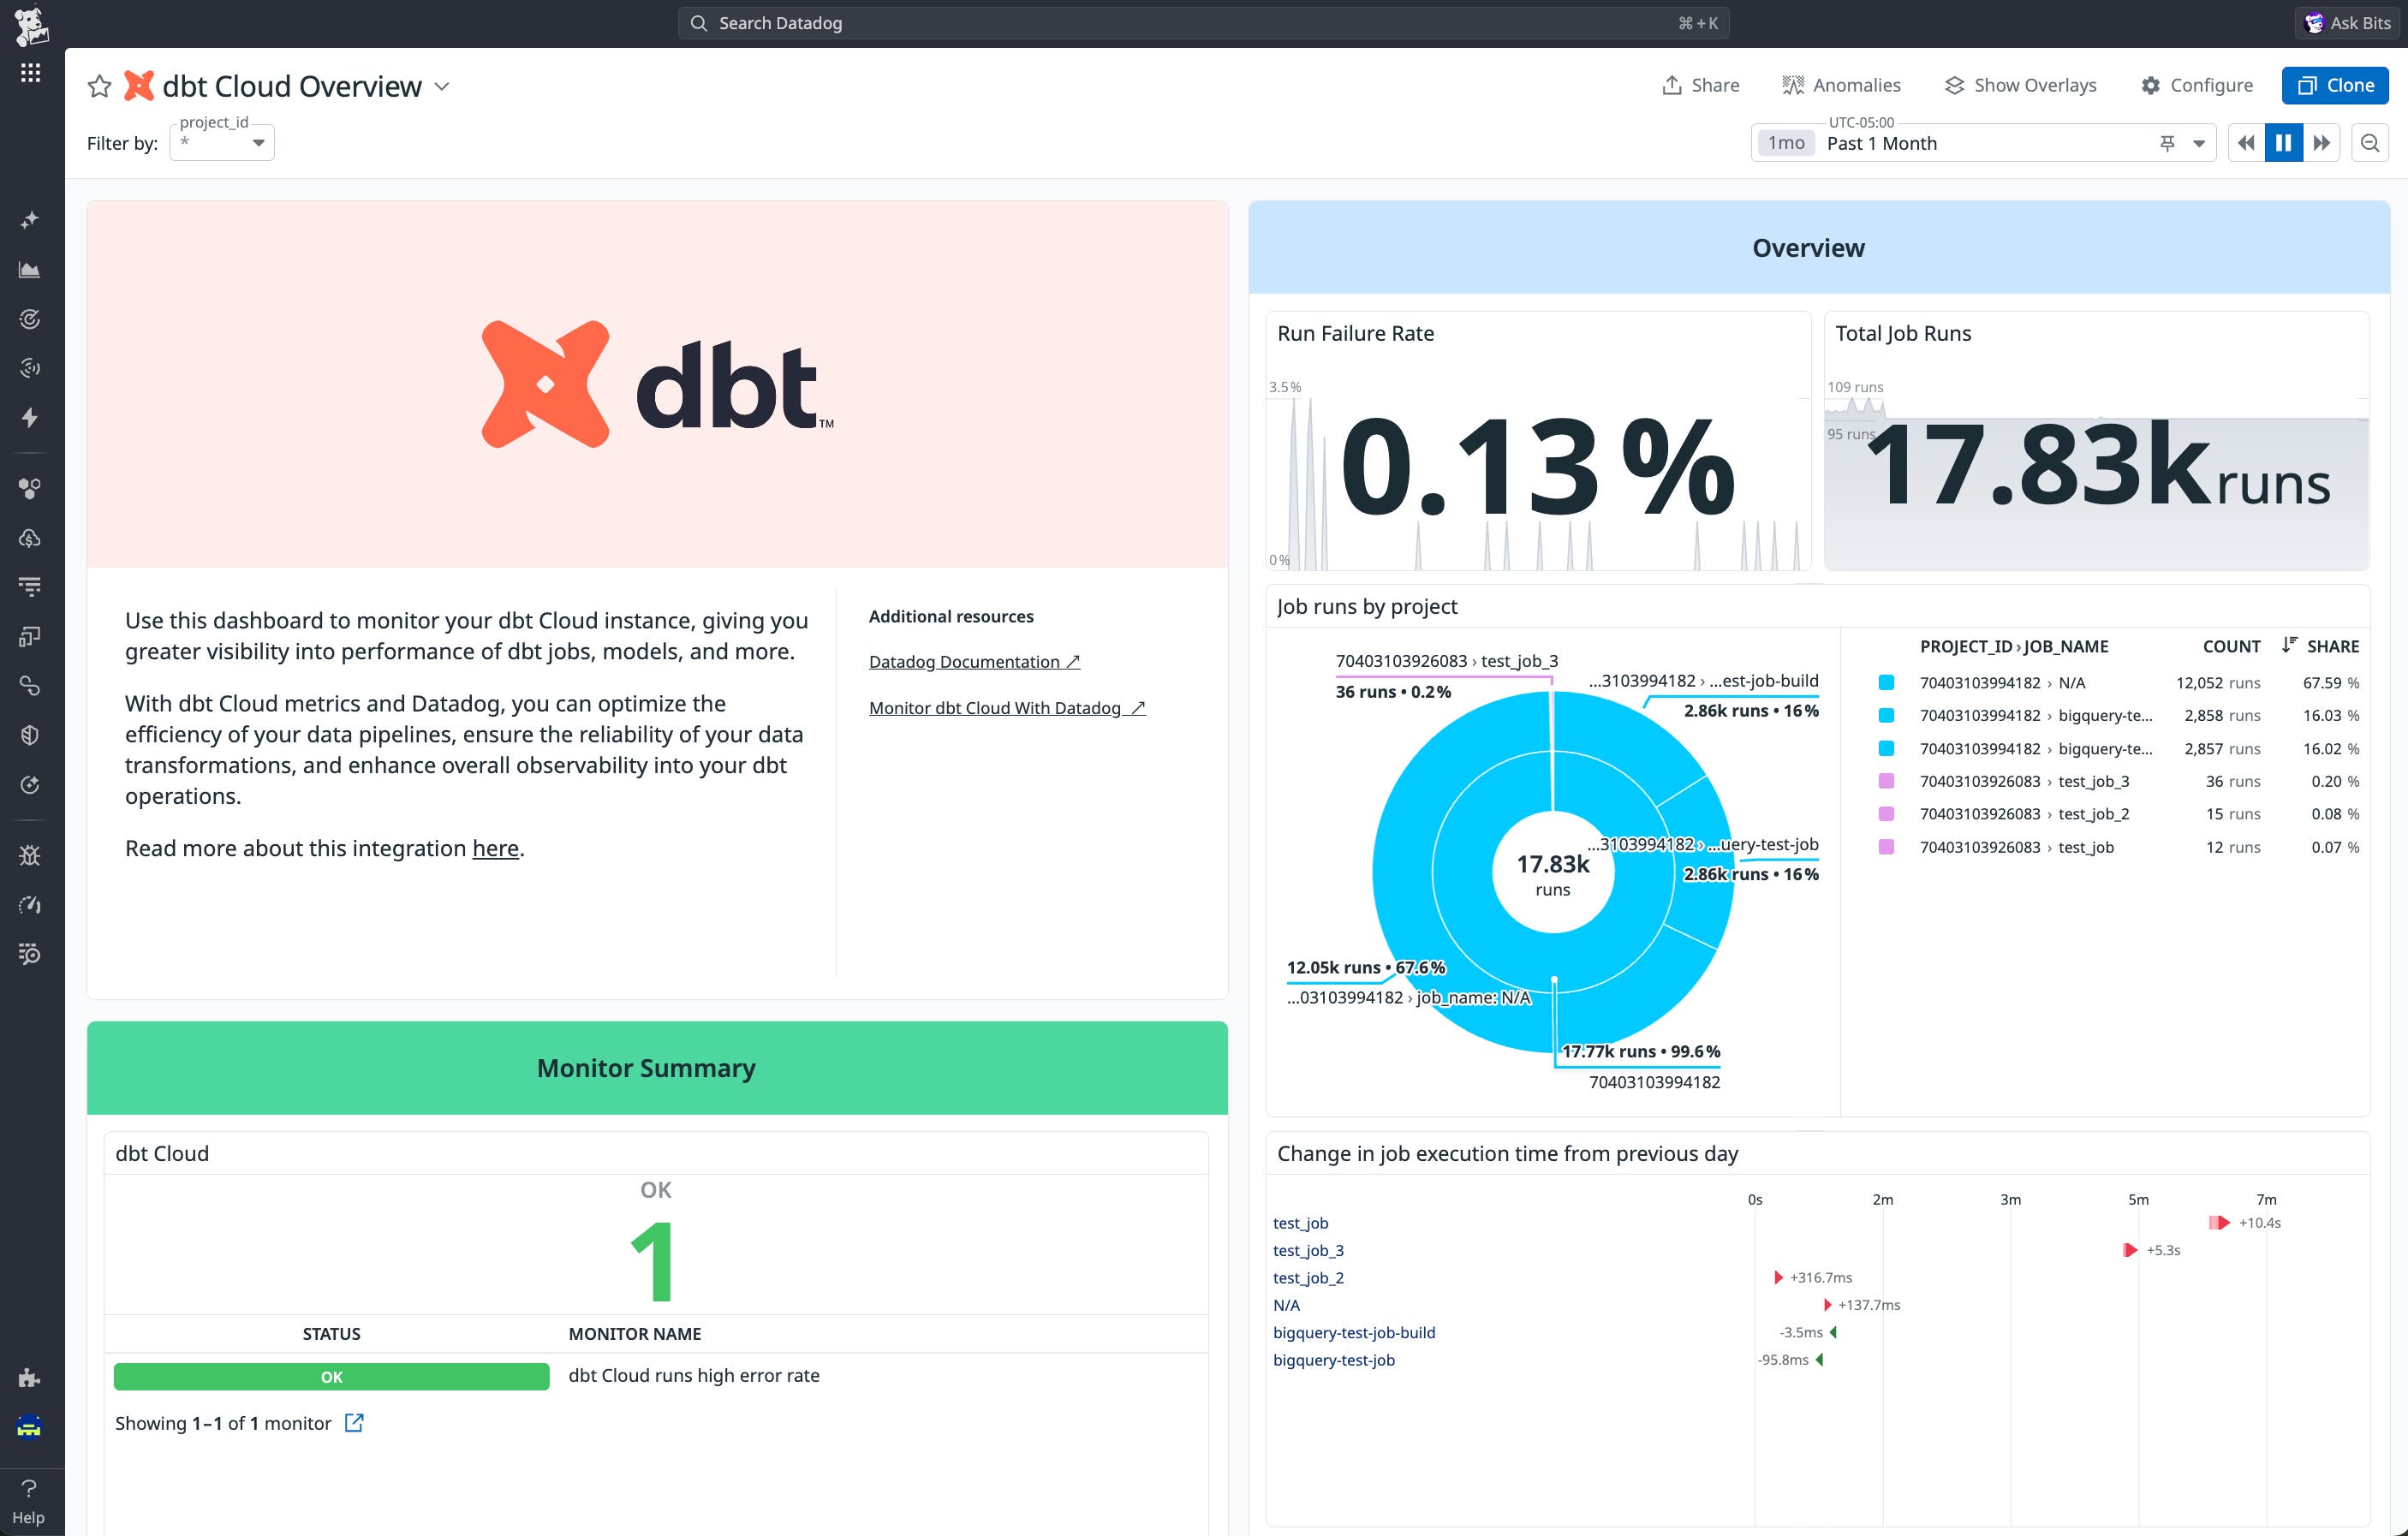
We also deepened coverage with analytics tools that transform and deliver data. Datadog’s dbt Cloud integration provides visibility into model execution times, job reliability, and transformation performance, helping teams troubleshoot slow or failing pipelines. Metabase surfaces query latency and dashboard performance metrics so that they can understand how analytics workloads behave under real user demand. Tableau adds insight into dashboard load times and extract refresh performance, helping teams ensure business users get fast, reliable access to insights.
Digital experience and marketing systems are another critical part of data workflow. Datadog’s Shopify integration shows how storefront and backend performance impact the buying experience. HubSpot CMS highlights how content performance and site health influence inbound traffic and engagement. Mailchimp brings visibility into campaign delivery and system reliability. Finally, GoDaddy surfaces web hosting and DNS performance to help teams quickly diagnose issues that impact customer-facing sites.
Datadog continues to invest in the future of observability
As technology evolves, Datadog’s mission remains the same: to give teams complete visibility across their entire stack. From AI to security and hybrid infrastructure, our platform grows with you to help you see, secure, and optimize the tools and architectures shaping the future.
If there are integrations you want us to prioritize, you can request them directly in the Datadog app through the Request an Integration button at the bottom of the search results page. If you’re interested in building an integration with Datadog, join our Technology Partner program today.
You can explore all new launches and trending categories on our Integrations page. If you don’t already have an account, you can sign up for a 14-day free trial to get started.
