Othmane Abou-Amal
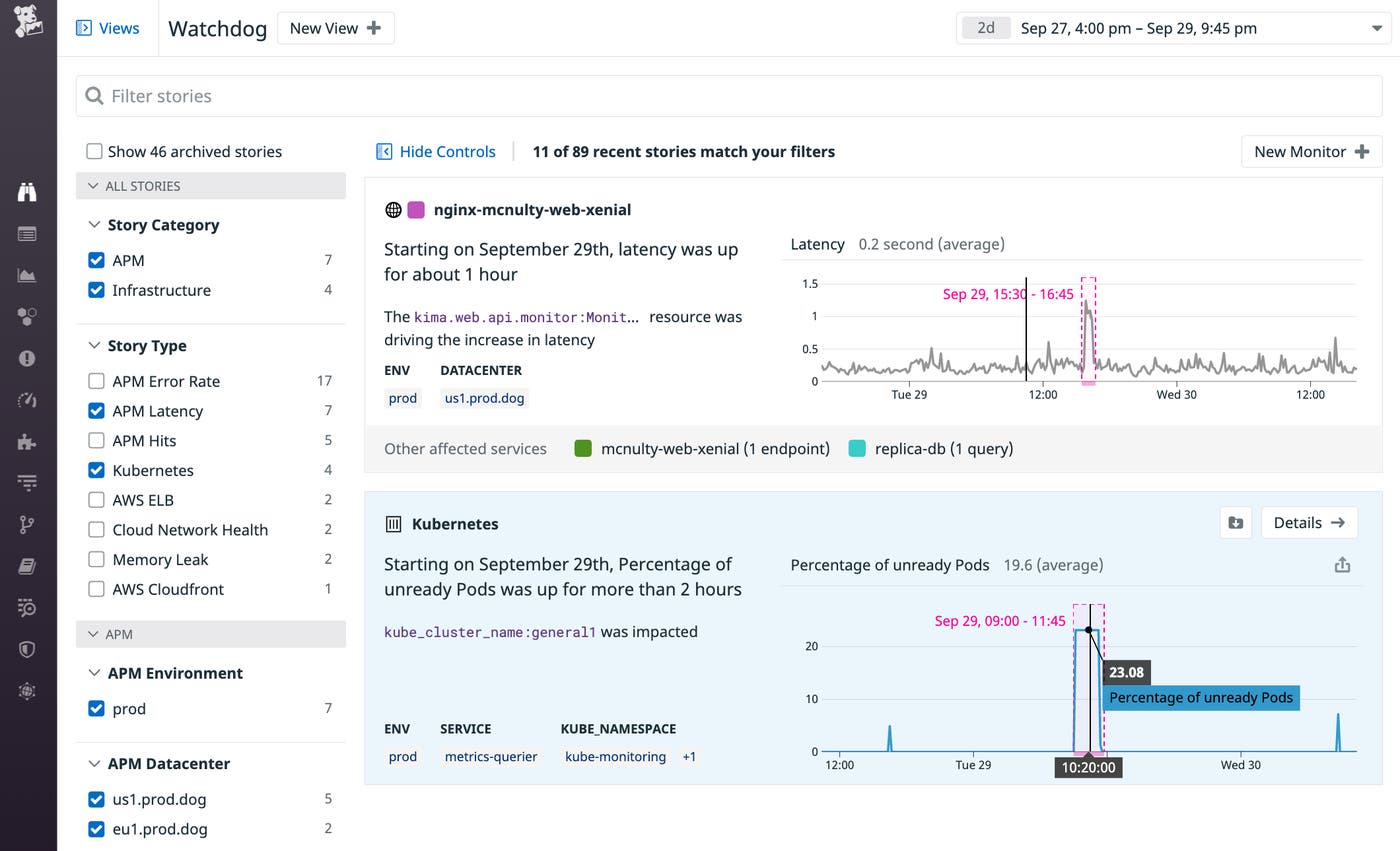
Since 2018, Watchdog has provided automatic anomaly detection to notify you of performance issues in your applications. Earlier this year, we introduced Watchdog for Infra, enhancing Watchdog to also monitor your infrastructure. We’re pleased to announce the latest enhancements to Watchdog, which now provides more visibility and greater context around the full scope of each application issue. The new Watchdog automatically groups related APM anomalies across different services into a single story and provides actionable insights for root cause analysis. Watchdog now also adds context to your alerts and automatically surfaces anomalies that occur within your Kubernetes clusters. Without any setup, you can now rely on Watchdog for even deeper visibility into your dynamic environment.
Troubleshoot APM anomalies across services
An anomaly that appears in one service can have a negative impact on services downstream. For example, if one service’s database queries get throttled, any downstream service will experience elevated latency. Some of these downstream services could eventually experience an increased error rate due to timeouts. You need to troubleshoot this not as two separate issues, but rather as one issue stemming from a single root cause.
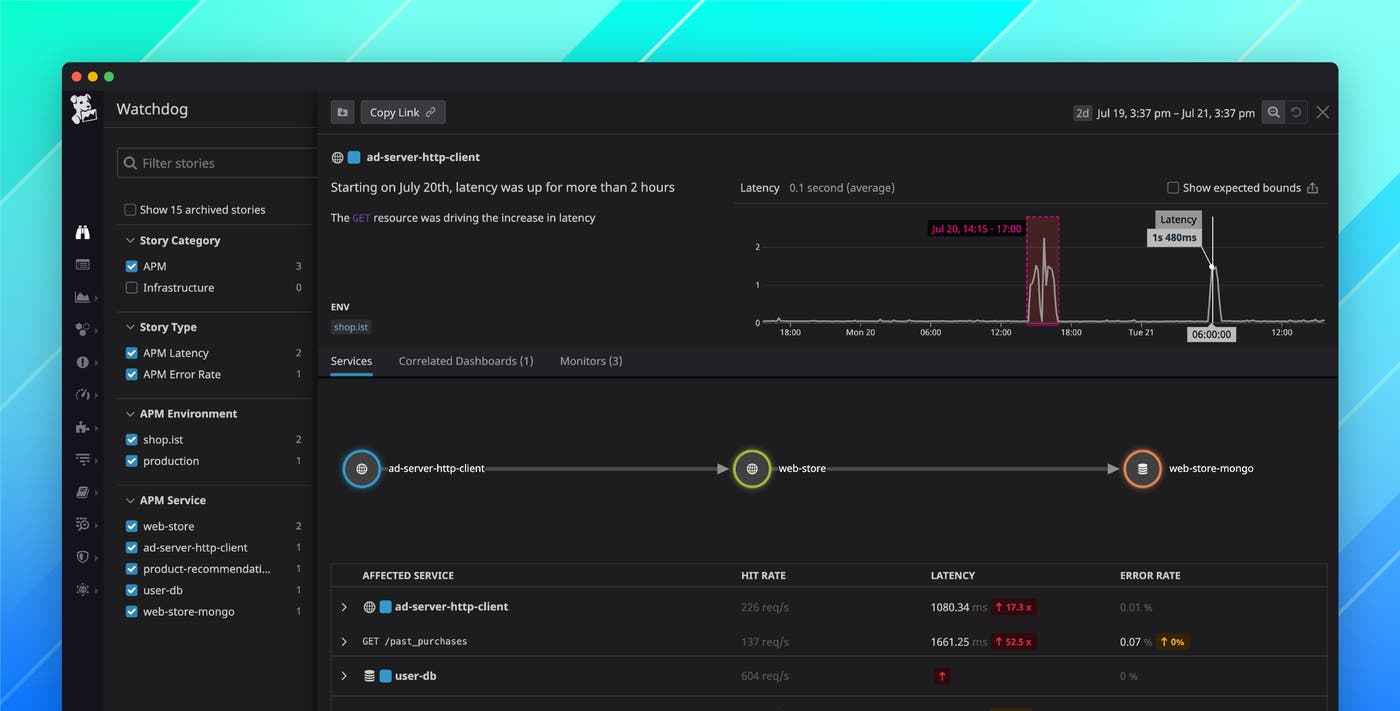
Watchdog helps you do that by automatically grouping related APM anomalies into a single story whenever it detects an issue that affects multiple services. The story includes a dependency map that shows the service where the issue originated and the downstream dependencies that were affected. This allows you to quickly understand the impact of the issue and provides insight on where to look for the root cause.
The screenshot below shows a Watchdog story, starting with a summary of the issue and a graph highlighting the anomaly. Below that, a dependency map illustrates the full scope of the problem: the issue is rooted in the ad-server-http-client service, and it also affects the downstream services web-store and web-store-mongo. Below the dependency map, a table lists the affected services and displays hit rate, latency, and error rate metrics. In this case, the data in the table indicates that latency in the downstream services also increased.
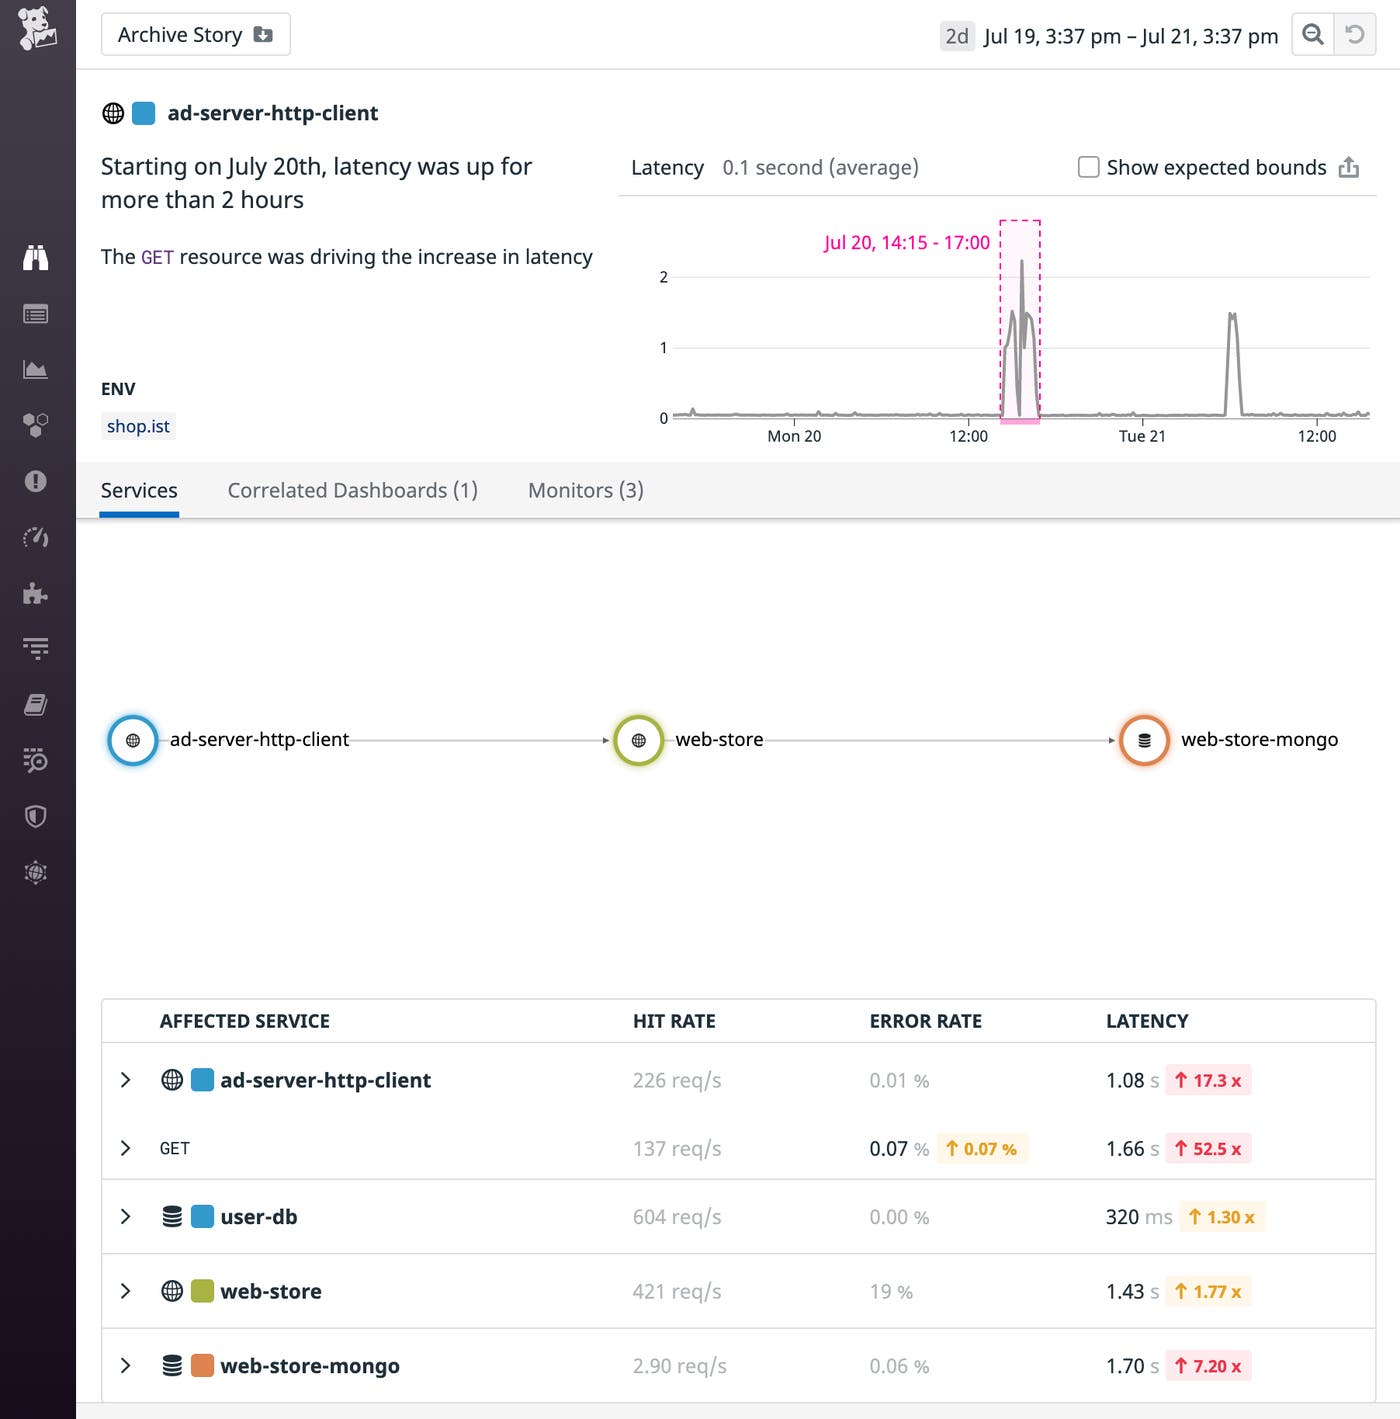
By aggregating related anomalies into a single story, Watchdog reduces noise—replacing multiple separate stories with a single rich one—and speeds up your troubleshooting process.
Correlate the story with related dashboards
Watchdog APM stories now include any correlated metrics and dashboards to help you quickly see the context of an issue. When Watchdog creates an APM story, it finds metrics and graphs within dashboards that indicate correlated anomalies. These correlated dashboards serve as a helpful resource for deeper investigation of the issue described in the story.
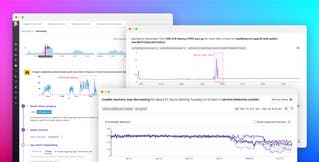
The screenshot below shows a Watchdog story that includes one correlated dashboard. Two graphs from the dashboard highlight anomalies that relate to the story’s primary anomaly—increased latency in the ApplicationController#health endpoint.
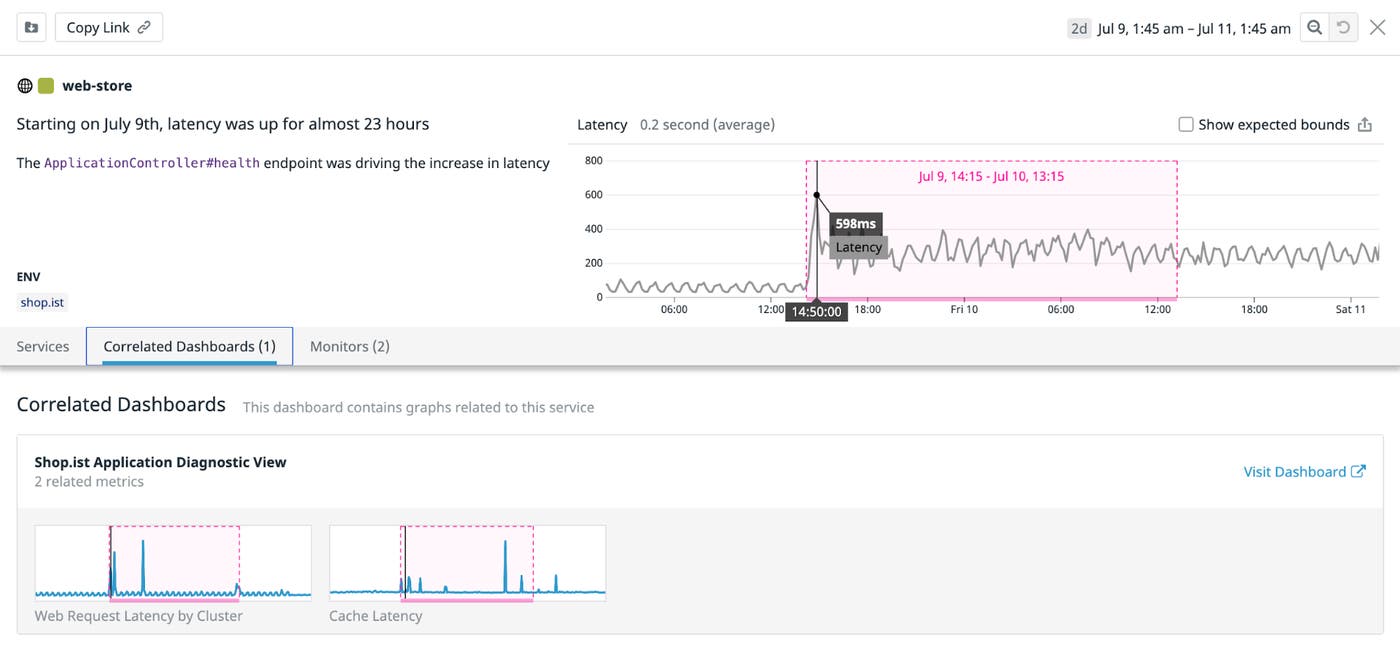
In this example, the Web Request Latency by Cluster and the Cache Latency graphs on the correlated dashboard show spikes at the same time as the anomaly highlighted in the story. You can click the Visit Dashboard link to navigate directly to the correlated dashboard to investigate further.
More context for your alerts
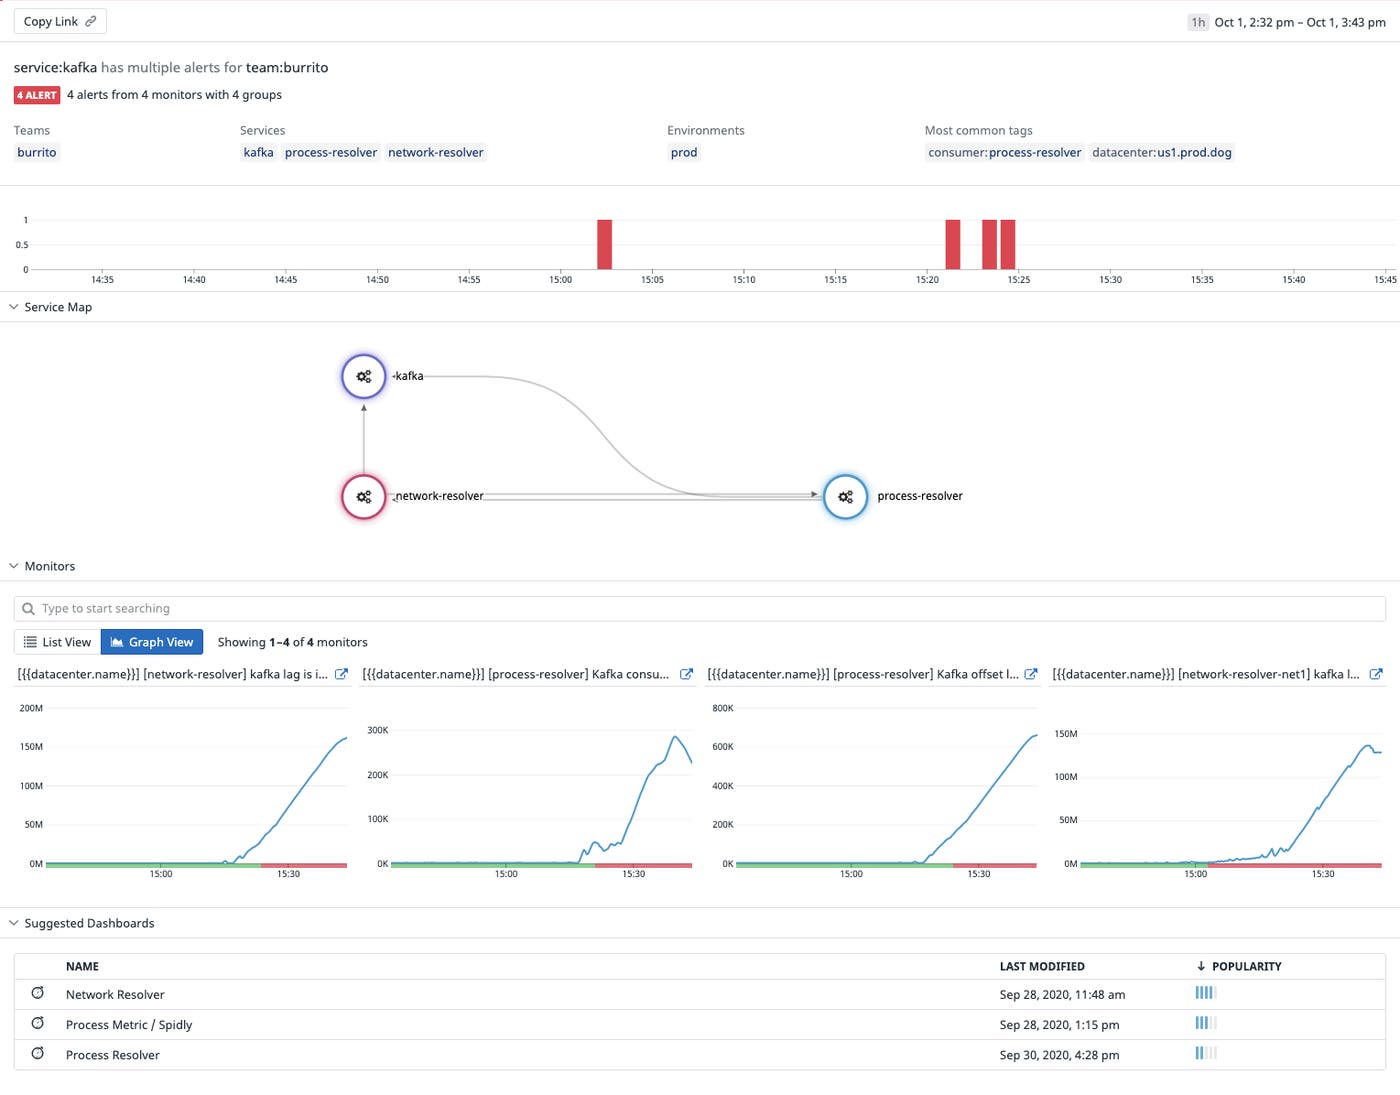
When one of your alerts triggers, Watchdog now automatically surfaces related alerts that have also triggered so you can quickly triage the situation. Watchdog finds related alerts using machine learning algorithms that have been trained on Datadog’s past incidents. Now when you view an active alert, Watchdog makes it easy to find other active alerts that can provide valuable context for your troubleshooting.

The alert in the screenshot above includes a message stating that Watchdog has found related alerts. You can click on the message to open a side panel—shown below—that presents all the related alerts, as well as a dependency map of the affected services. Now you can easily see if there are alerts firing for upstream services at the same time and know which dashboards to check for further information.
Investigate Kubernetes anomalies
Watchdog now provides enhanced visibility into the health and performance of your Kubernetes clusters. For example, you can rely on Watchdog to automatically detect increases in the cluster’s scheduling latency, and in the number of pods that are in a failed, unready, or unavailable state. An increase in any of these metrics can affect the uptime of your services and interfere with your SLOs.
In the example story shown below, Watchdog has detected a significant increase in the percentage of StatefulSet replicas that are in an unready state. To clarify the scope of the anomaly, the story also displays the relevant env, service, kube_cluster_name, and kube_namespace tags.
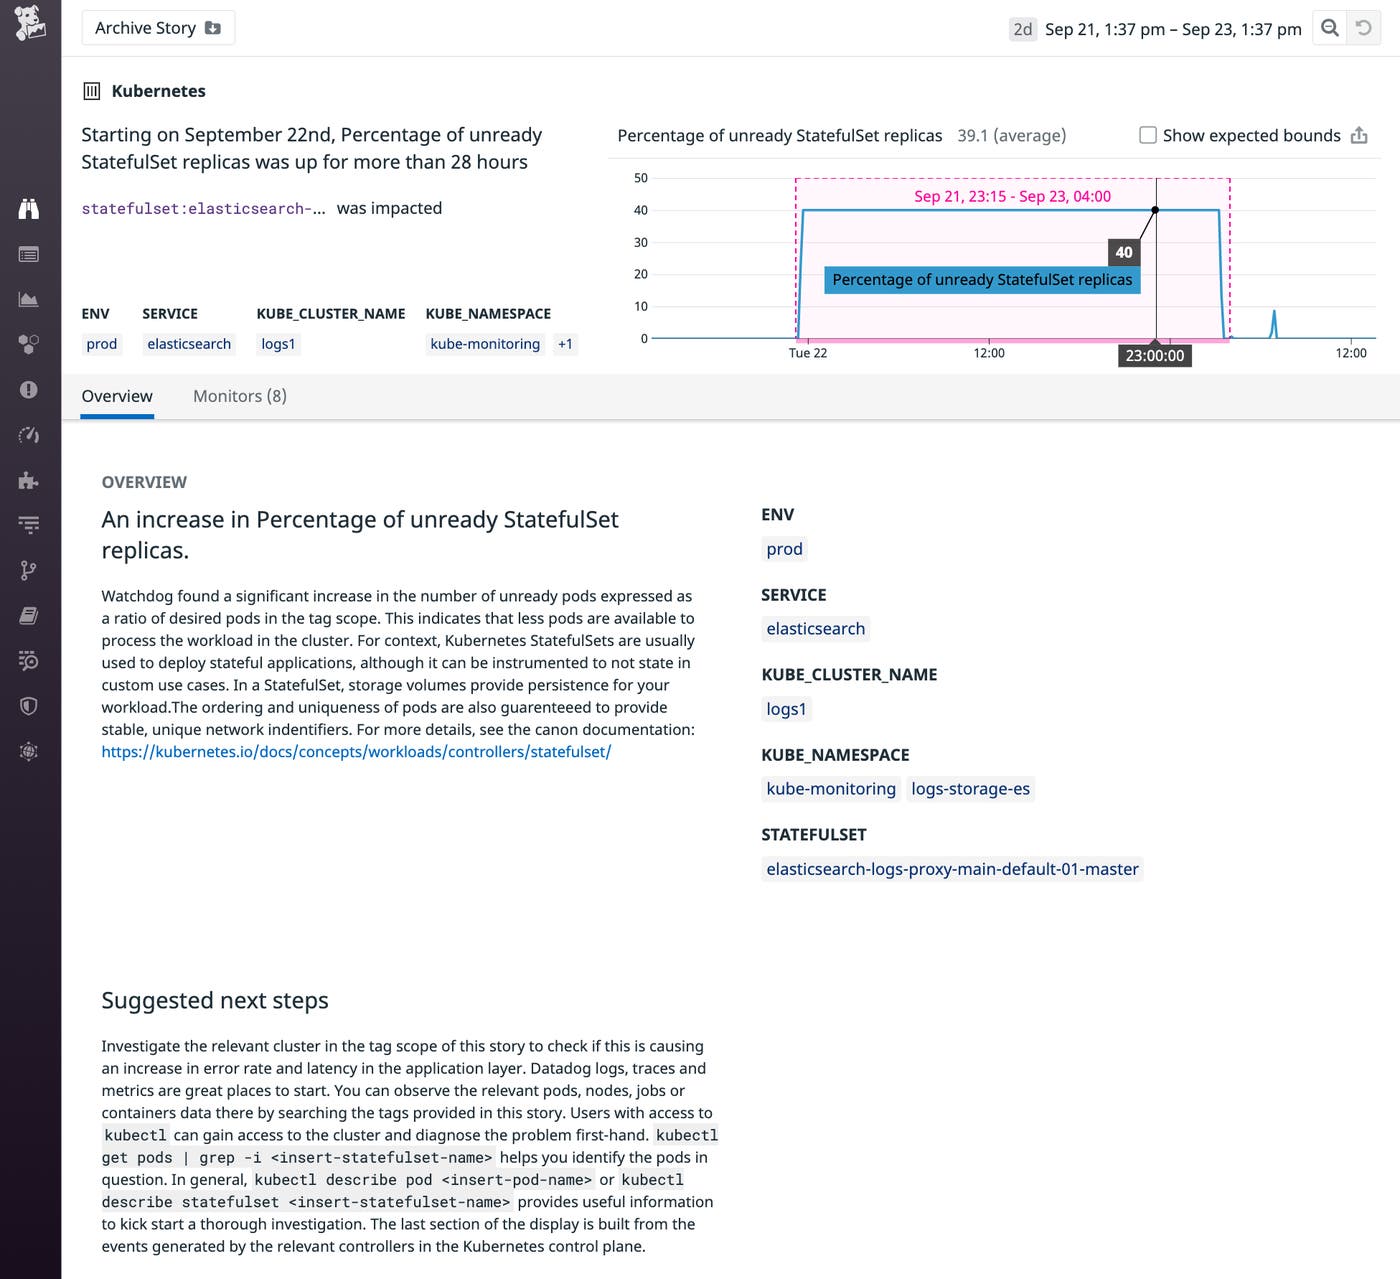
The Overview section of the story summarizes the detected anomaly—in this case an increase in the percentage of unready pods and gives you context and analysis of the issue and a link to relevant Kubernetes documentation. In the Suggested next steps section of the story, you’ll find guidance on how to troubleshoot and resolve the issue.
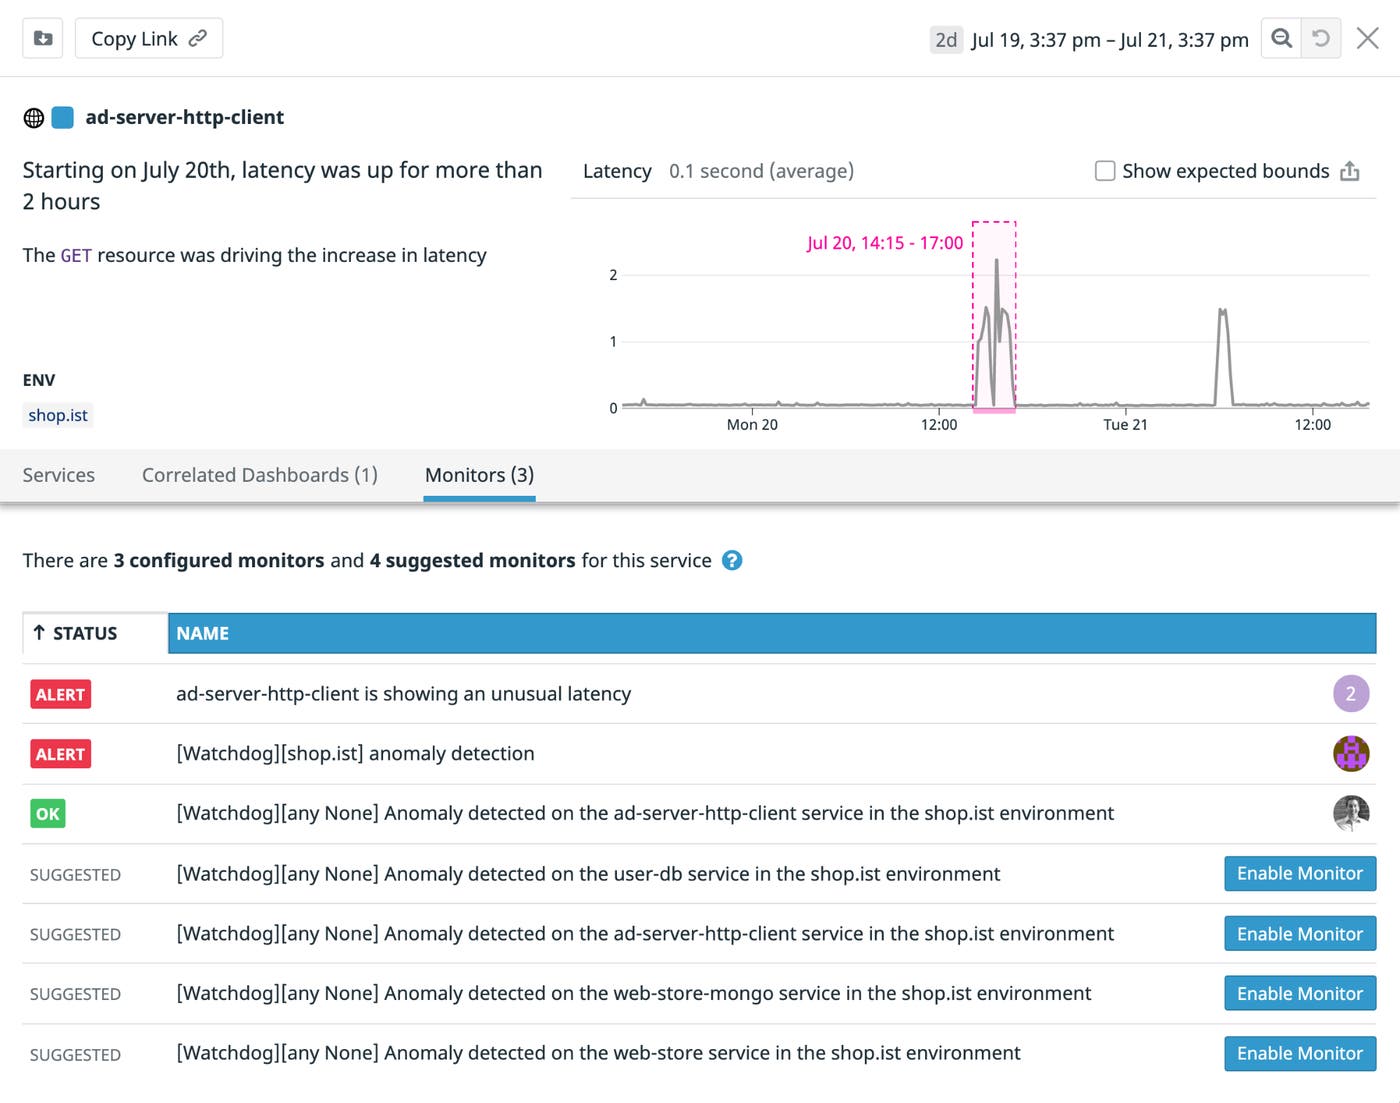
The Watchdog story also includes a list of related monitors so you can see the state of your monitors in the context of the reported issue. And Watchdog will suggest new monitors you can enable with a single click—shown in the screenshot below—to ensure that your team is notified of similar issues in the future.
Let Watchdog help you find root causes
The newest Watchdog features are now generally available. If you’re already using Watchdog, you can begin using these new features right away—no setup required. For further information about Watchdog, see our documentation. You can also check out Watchdog Insights, which speeds up your investigation workflows by suggesting possible issues in data such as traces and logs. If you’re not already using Datadog, sign up to start a free 14-day trial.
