Candace Shamieh

Scott Gerring

Brent Hronik

Rachel White
Early-stage engineering teams ship fast and learn in production. While speed is a competitive advantage, it can also lead to a high volume of noisy signals, like stack traces, timeouts, and dashboards full of red. Some of those problems can affect your users and revenue, but many don’t.
To prioritize the right issues, you need to differentiate between the exceptions that are noisy and those that are costly. You can accomplish this by connecting engineering telemetry data, like logs, traces, and user sessions, with customer feedback, which includes support tickets, chats, and qualitative reports. Connecting these signals into a single, closed feedback loop enables you to analyze them together, so you can answer the following three questions for any defect:
- Who was affected?
- Where in the journey did it happen?
- How much did it influence conversion, engagement, or revenue?
In this post, we’ll cover:
- Why closing the feedback loop matters
- Where to start
- How to identify who was impacted
- How to implement an effective feedback loop with Datadog
Why does closing the feedback loop matter?
Closing the feedback loop means taking the signals that a system generates, like performance data or failure patterns, using them to make targeted improvements, and then validating that those changes resolved the issue. By feeding what we learn back into the system and our processes, we ensure that each insight leads to a lasting improvement rather than a repeated failure.
Without a closed loop, teams tend to work on whatever is most visible: the graph that dipped, the exception that spiked, or the support ticket forwarded to Slack. However, visibility doesn’t always correlate with impact.
For example, a spike in HTTP 500 errors on logout may look alarming in graphs but typically has little impact on revenue. Conversely, a subtle 2% increase in payment timeouts is far less visible yet financially significant. If you look at error counts only, the logout errors seem more important. But if you close the loop by comparing how each issue affects the checkout funnel, the payment errors clearly become the priority.
A closed loop changes how you triage and plan, and enables you to turn each exception into a product narrative. Instead of identifying that “this error happened 10,000 times,” you can determine that “this error affected 1,200 checkouts from paying customers in the last 24 hours.” You can show how a specific type of error reduces conversion or task success, and how those metrics improve after you ship a fix. Engineering, product, and support teams can collaborate productively, discussing incidents in terms of affected customers, funnels, and revenue impact, rather than remaining in their own silos with separate dashboards and ticket queues.
To apply a simple acceptance test to your loop, ask yourself the following questions about any given defect:
- Can I measure the change in conversion for affected sessions compared to the baseline?
- Can I identify which segments, like the plan tier, device, region, or release, are the most impacted?
- Can I open a ticket that links directly to the traces or sessions that support it?
If the answer to any of these is “no,” your feedback loop is missing the data required to prioritize defects accurately.
How can I get started?
You don’t need a complex correlation model to start closing the loop. Instead, your goal is to enforce a small, shared set of semantic identifiers across your telemetry data and customer feedback so that the same fields show up in logs, traces, user sessions, product analytics, and support data.
Because Datadog libraries and most common frameworks emit many of these fields and tags automatically, you can get started without building your own schema. The primary goal is for your fields and tags to be consistently named and present.
For your first version, aim to implement the following:
- A way to identify a request, such as
trace_id - A way to identify a user or account, for example,
user.idoraccount.id - A way to identify a deployment, like
service.versionanddeployment.environment.name
You can always add more identifiers over time. The key is that whatever you decide to use—use it everywhere.
Core identifiers to standardize
Once you’re ready, you can implement a minimal set of correlation identifiers. Here are a few examples:
trace_idandspan_id: Attach these to backend logs (and any low-volume diagnostic events) so you can link them back to the specific trace and span associated with an error. Modern tracing tools propagate this context for you—often using standards like the W3C Trace Context headers—so you gain end-to-end visibility with minimal manual effort.session_idandcorrelation_id: Use session identifiers to link frontend events to a single user journey. For example, by using the Server-Timing HTTP response header, which lets servers send timing and trace metadata to the client, you can expose backend trace context to the browser. This enables your frontend monitoring tools to correlate frontend actions with backend traces.user.id,account.id, andplan.tier: Include user, account, and plan tier identifiers in logs, frontend monitoring data, and support events so you can understand impact by customer segment.service.name,deployment.environment.name, andservice.version: Use consistent service, environment, and version identifiers across logs, metrics, and traces so you can identify which deployment introduced a regression and which services are involved.
Other useful identifiers can include feature_flag, experiment_bucket, geo.country, device, browser, and app_channel.
If you’re using OpenTelemetry, many of these correlation identifiers already adhere to its semantic conventions. These conventions define standard attribute names like service.name and deployment.environment.name, and end-user attributes like enduser.id and enduser.pseudo.id. This ensures that telemetry data from different services and signal types remains consistent and interoperable.
When teams normalize key names and values in their pipelines and SDKs, the same fields are emitted everywhere. This makes it possible to filter and aggregate for analysis without ad hoc mapping and ensures that sampled sources retain the identifiers required for correlation. You can also filter non-human traffic by tagging and excluding bots and test users from product analysis.
Make error logs a reliable product signal
Converting error logs into structured key-value pairs enables them to be searched and parsed programmatically. With structured fields in place, you can easily filter logs by feature, user segment, or any other attribute you define.
If you add correlation IDs to backend logs and expose trace_id to the browser via the Server-Timing header, frontend monitoring tools can correlate directly with backend traces. Where possible, rely on OpenTelemetry-aware logging integrations and language features that automatically attach tracing context to your logs. Examples include Java’s MDC integrations in Log4j and Logback, OpenTelemetry’s logging instrumentation for Python’s standard logging module, and .NET’s log correlation helpers. Once tracing is configured, these tools pull trace and span IDs from the active trace context into each log record automatically. In many cases, enabling your language’s OpenTelemetry logging integration or using an OpenTelemetry-aware appender is enough to get trace_id and span_id populated on your logs with minimal configuration. Even if you start by using the tracer primarily to enrich logs with request context, you’re only a small step away from full APM if you choose to turn it on later.
Many languages and frameworks provide structured logging libraries that handle trace correlation for you. For example, as shown in the following Node.js snippet, Datadog’s library injects correlation identifiers into logs automatically.
// Enable Datadog tracing and log injection (must be required before other imports)require("dd-trace").init({ logInjection: true });
const express = require("express");const { createLogger, format, transports } = require("winston");const crypto = require("crypto");
const app = express();
// Base JSON logger; dd-trace injects dd.trace_id, dd.span_id, service, env, version// (JSON format is required for auto log injection)const baseLogger = createLogger({ level: "info", format: format.json(), transports: [new transports.Console()],});
function hashId(id) { return crypto .createHmac("sha256", process.env.USER_HASH_SALT) .update(String(id)) .digest("hex");}
// Attach a per-request loggerapp.use((req, _res, next) => { req.log = baseLogger; next();});
// After authentication, enrich logs with hashed user/account infoapp.use((req, _res, next) => { const user = req.user; // set by your authentication middleware
if (user) { req.log = req.log.child({ "user.id": hashId(user.id), "account.id": hashId(user.accountId), "plan.tier": user.plan, }); }
next();});
app.get("/checkout", (req, res) => { req.log.info("checkout viewed"); res.json({ ok: true });});
app.listen(process.env.PORT || 3000);You can then add user or account attributes through your logger configuration rather than manually injecting trace context into every handler.
Represent customer feedback as structured events
Customer feedback from systems like support desks and chat tools can follow the same pattern. By ingesting it as structured events, you can reuse existing identifiers so qualitative reports can be analyzed alongside telemetry data.
You can represent each ticket as a small JSON object that describes:
- Where it came from, like
sourceandkind - What it’s about, such as
topicandseverity - Which account it belongs with
account.id - Where the issue impacts users by using tags that identify the channel, platform, or region affected
Adding details like a message, timestamp, and URL that link back to the original ticketing system can also provide helpful context. The following code sample displays how you can implement this approach.
{ "source": "support_desk", "kind": "ticket", "topic": "checkout", "severity": "customer_blocking", "account.id": "acct_123", "ticket.id": "84219", "message": "Payment authorization timing out on mobile", "labels": ["mobile", "latam"], "ts": "2025-10-28T14:21:13Z", "link.url": "https://support.example.com/tickets/84219"}Because account.id matches what you send from your applications, you can connect these tickets to traces, logs, and user sessions, and quantify how many users and how much revenue a group of related tickets represents.
Keep the architecture simple and privacy-aware
A minimal reference flow can serve you well. For example, many organizations use some version of the five-stage pipeline shown in the diagram below, from edge collection to ticketing:
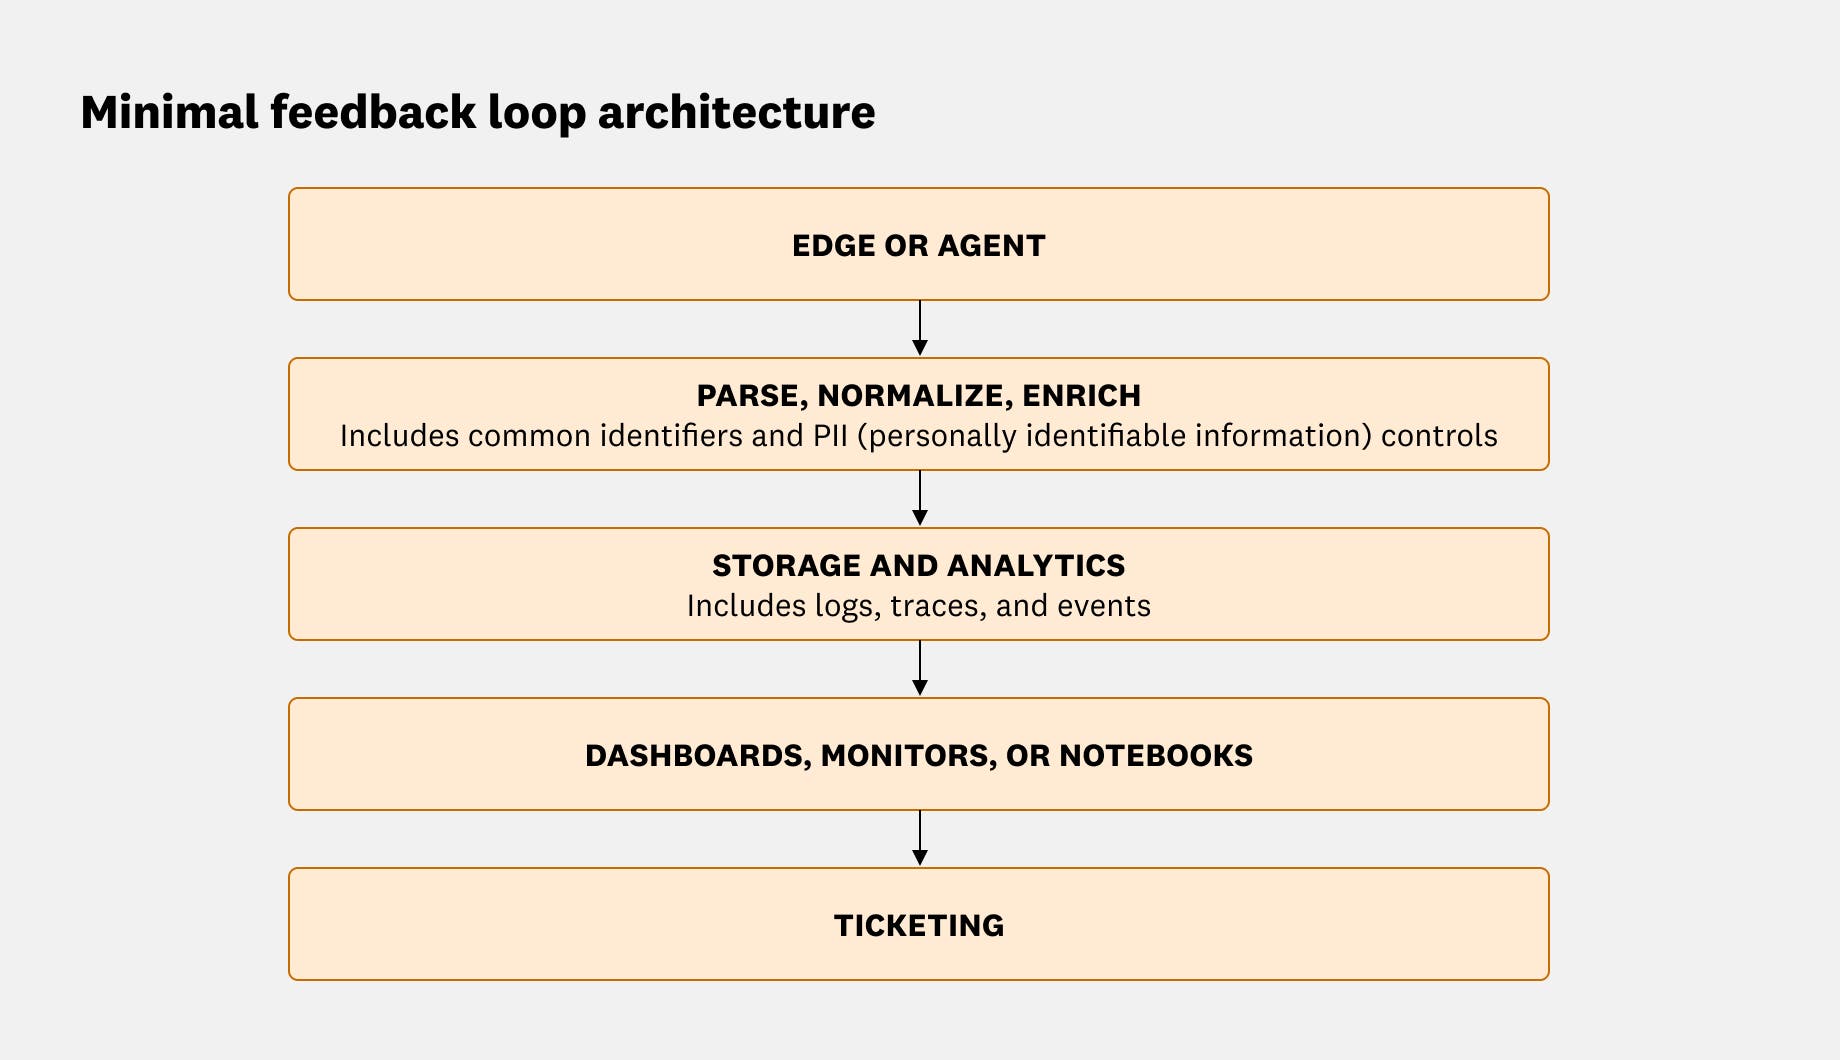
An open source telemetry pipeline, like the OpenTelemetry Collector, can parse, enrich, redact, and route events before they reach your observability backend. An architecture like this enables you to correlate errors, sessions, and customer feedback across tools without locking into any specific implementation details. As you enrich events, you can strengthen your privacy posture and enforce governance controls by performing the following actions:
- Treat your correlation identifiers, such as
user.id,account.id, andplan.tier, as a small, stable set of fields that are attached automatically. Beyond that, let developers add whatever structured fields they need for debugging and analysis. - Use pipelines or processors to detect and redact sensitive values, including email addresses and payment details, wherever they appear, rather than relying on a strict global allowlist of log fields.
- Hash or pseudonymize user and account identifiers where required, and use role-based access controls to restrict who can query events that contain sensitive attributes.
The goal is to have enough shared structure to understand how the issue affected users and business outcomes. You don’t need to model every attribute up front.
How can I identify who was impacted?
Once your correlation identifiers are in place, you can move from subjective prioritization to quantifying impact.
To get started, pick one high-impact flow (such as checkout or signup), one noisy error group, and a week or two of recent traffic. Use whatever you already have—a product analytics tool, warehouse queries, or even log aggregations—to build two cohorts: sessions that hit that error group and similar sessions that didn’t. Compare a simple funnel metric between them, like “reached payment success” or “completed onboarding.” This first comparison can give you a concrete estimate of impact, which you can later refine with better groupings and segments over time.
Group related errors into stable error groups
Individual stack traces are usually too granular to prioritize work. By grouping related exceptions together, you can analyze impact at the same level that you plan engineering work, categorized by bug, not by frame.
Each error group should answer the following questions:
- What is the representative stack trace?
- Which services and versions are affected?
- How often does this error occur, and in which environments?
Quantify impact with funnels and segments
After grouping errors, define a small set of baseline funnels and metrics that represent your core product flows, such as:
- Signup → activation → first key action, like creating a project
- Browse → add to cart → checkout → payment success
- Workspace created → first integration installed → first dashboard created
Then you can start to compare affected and unaffected sessions. For each error group, the key question is “How does conversion differ between users who encountered this error and those who did not?” To answer this, you can take the following steps:
- Create a cohort of sessions tagged with the error group, for example,
error_group_id. - Build a control cohort of similar sessions without that error, like from the same time window or the same part of the product.
- Compare funnel conversion and key engagement metrics between the two cohorts.
This helps you understand whether the error group reduces conversion or task completion, increases time on task or retries, or drives frustration signals, including rage clicks and repeated reloads. With this comparison in place, you can estimate lost conversions and, where applicable, revenue at risk by using metrics like average order value (AOV) or average revenue per user (ARPU).
Next, segment the impact by attributes such as:
plan.tier, like free, pro, or enterprisegeo.countryorregiondevice,browser, orosservice.versionorreleasefeature_flagorexperiment_bucket
This can reveal which customers require proactive outreach, which environments or releases should be rolled back or hotfixed first, and whether an issue is an edge case or a systemic problem.
Alert on product impact, not just error volume
Finally, tune your operational workflows so alerts trigger when user experience is degraded, not just when a counter is high.
Instead of configuring an alert to notify when the payment_authorization_timeout error occurs more than 500 times in 5 minutes, consider defining alerts in the following ways:
- If checkout conversion for sessions tagged with the
checkout_gateway_timeouterror group drops more than 1 percentage point in an hour (like from 30% to 29%). - If more than 0.5% of signed-in sessions experience an unhandled frontend exception on the dashboard view.
To make this impact-based approach to alerting sustainable, define service level objectives (SLOs) on user-centric service level indicators (SLIs). For example, you can track the percentage of sessions that complete checkout without an error, the percentage of API requests that are completed without a server error or retry, and the percentage of page views that have a load time under a defined threshold.
You can also attach an error budget, such as 99.5% error-free sessions per 30 days, and use SLO burn alerts to catch regressions early.
Implement a feedback loop quickly with Datadog
If you’re already sending basic telemetry data to Datadog, you don’t need to engage in a large migration effort. Most aspects of this feedback loop are available by default, and you can begin correlating signals as soon as you enable products like Datadog Log Management, Application Performance Monitoring (APM), and Real User Monitoring (RUM). Over time, you can layer in additional correlation identifiers and workflows.
Use Error Tracking to create stable error groups
Teams can enable Error Tracking to consolidate similar exceptions into issues across backend, web, and mobile applications. This helps you cut through noisy stack traces and focus on the issues that affect user experience.
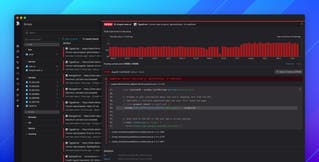
In the screenshot below, you can view how Error Tracking groups stack traces into a single issue and defines the impacted services, releases, related traces, and when applicable, RUM sessions, so you can focus on the defects that affect users.
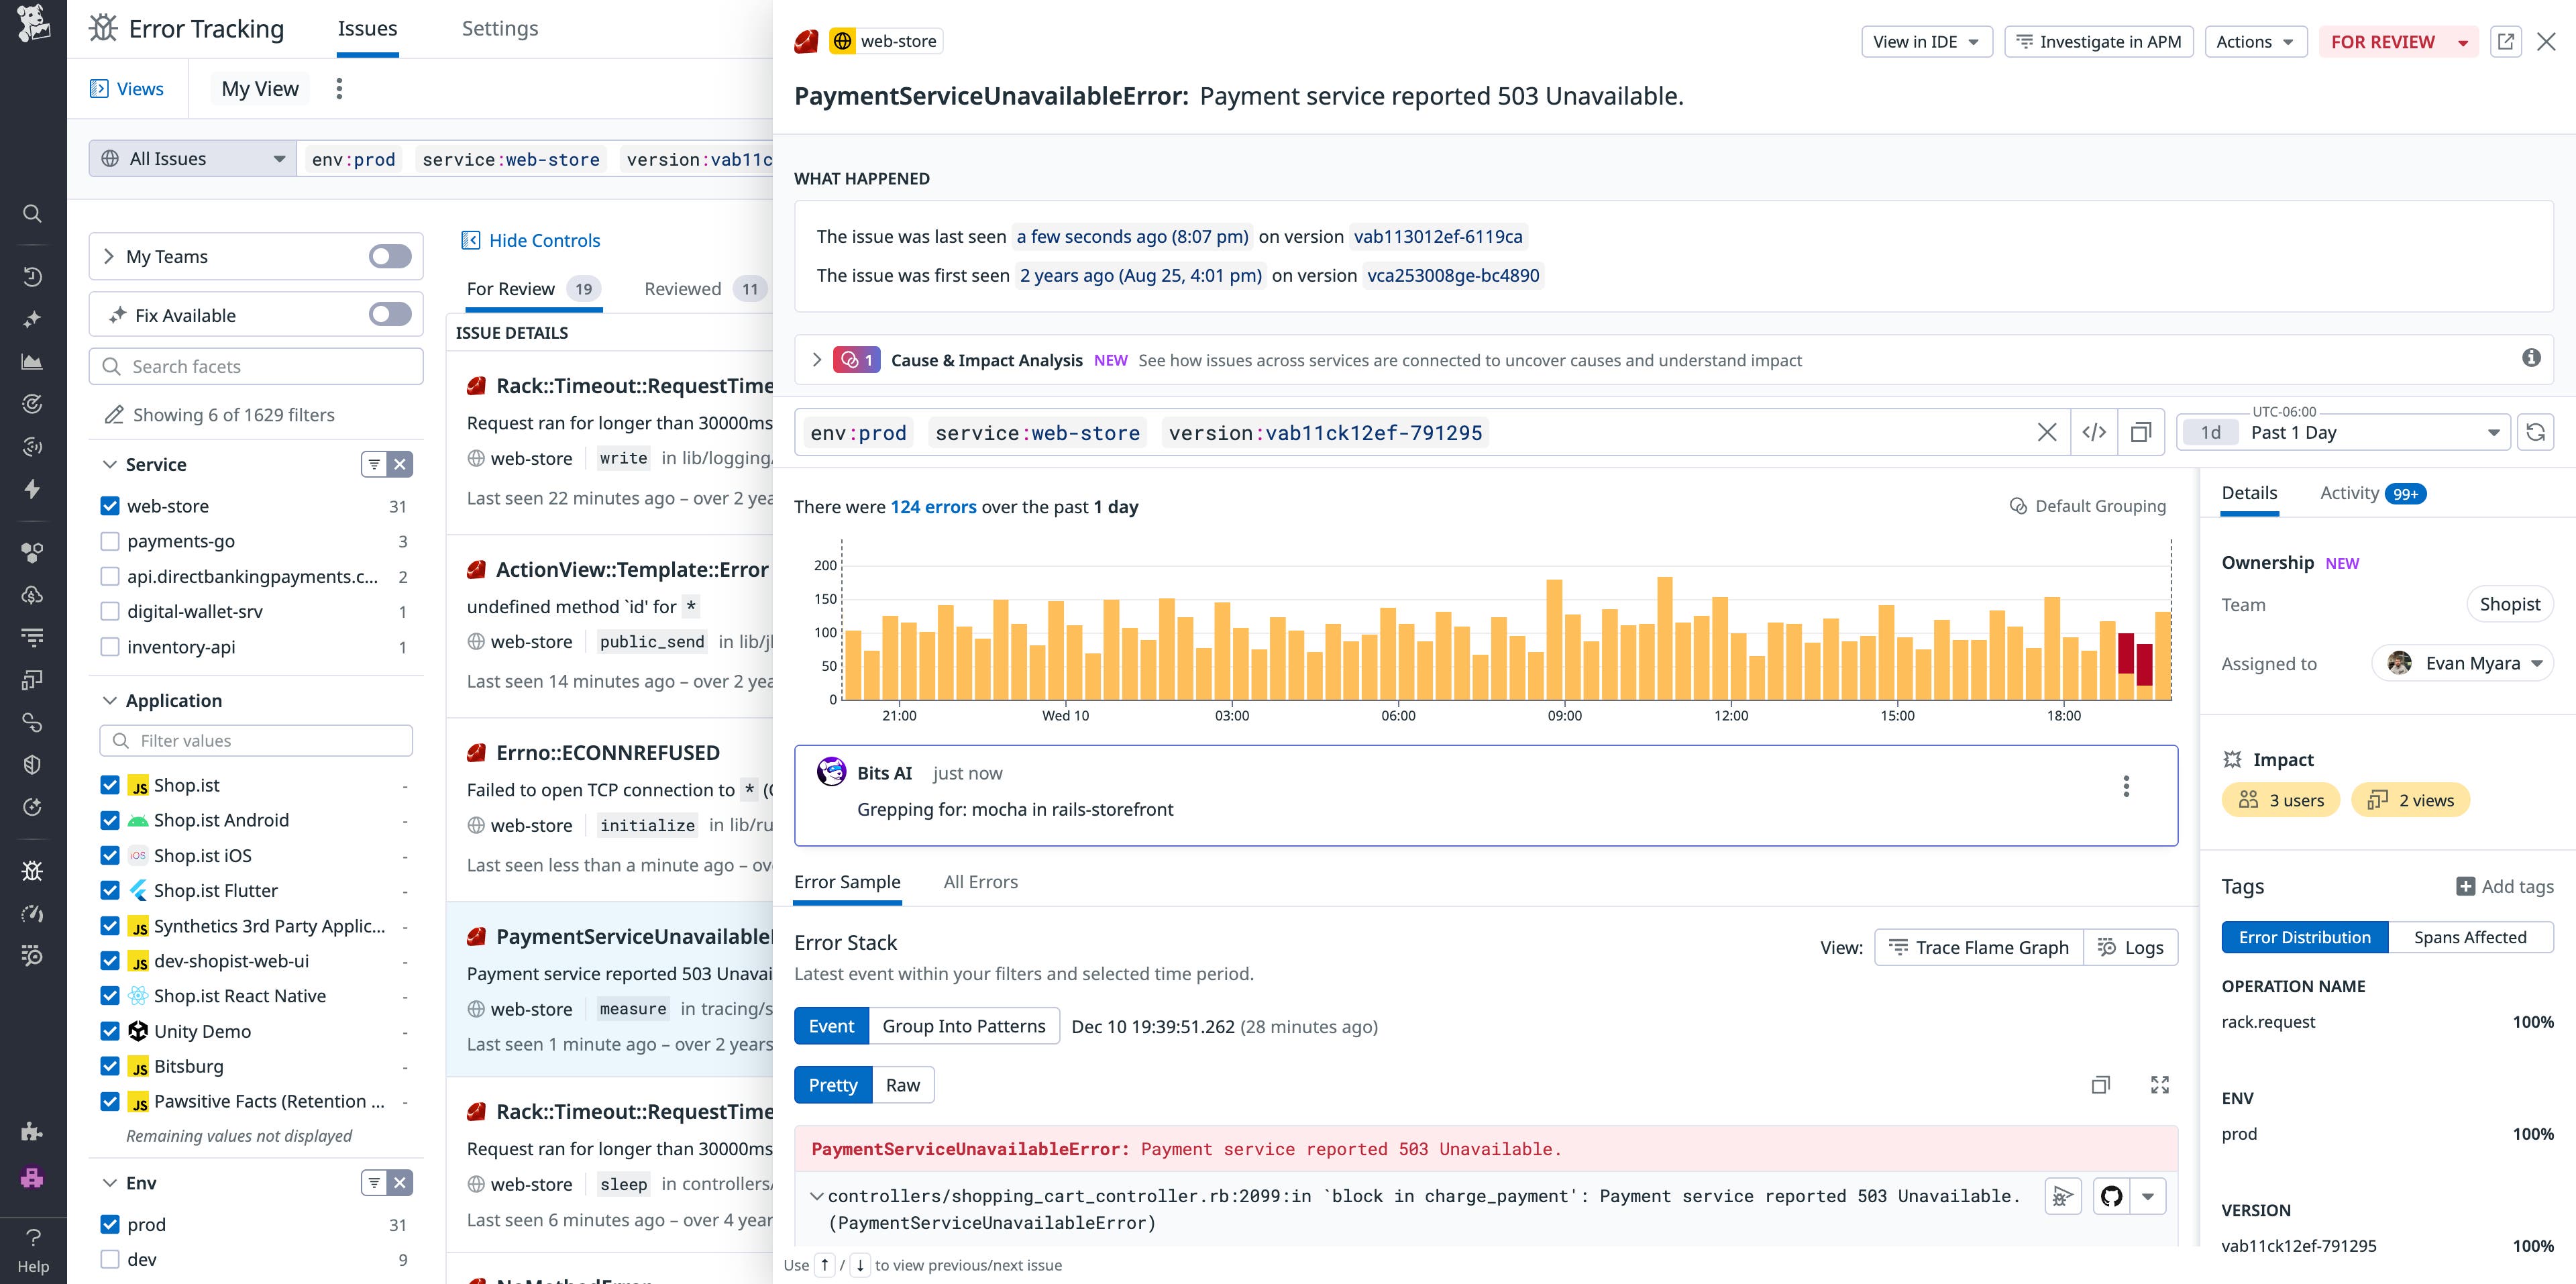
You can also segment by correlation identifiers such as account.id, plan.tier, and service.version so you understand who is impacted.
Standardize and enrich telemetry with Log Management and APM
With Log Management, you can parse and enrich logs so they carry the correlation identifiers required for analysis without you having to index everything or redesign your schema. Using Log Pipelines, processors, and global context, you can:
- Parse unstructured log messages into structured attributes, like
account.idandservice.version - Normalize key names and values so services use identical identifiers and formats, e.g.
user.id, instead of a mix ofuser.idanduser_id - Inject correlation identifiers to logs, traces, RUM sessions, and product analytics—such as
trace_id,session_id, andservice.version—so cross-navigation between signals is automatic and consistent
When you pair this functionality with APM, trace context propagation ensures that trace_id, span_id, and service.name are populated end to end. You’ll obtain a single trace that logs, RUM, and dashboards can reference.
If you instrument with OpenTelemetry, Datadog can ingest your OTel traces, metrics, and logs while preserving the semantic conventions you already use. Attributes such as service.name, deployment.environment.name, and other end-user identifiers will show up in Datadog as tags, while correlation identifiers can populate across logs, traces, RUM, and product analytics.
Connect frontend journeys with backend work by using RUM and Session Replay
RUM and Session Replay provide visibility into user behavior, including frontend errors, Core Web Vitals, and video-like replays of user interactions.
Because RUM can correlate with APM traces and logs via shared correlation identifiers, teams can perform the following actions:
- Navigate from a frontend error to the exact backend trace that handled the request.
- Review what users did before and after an error.
- Pivot from a support ticket to a session replay and associated traces. For example, a support engineer can look up a customer’s session replay by user or account ID, watch exactly what happened in the UI, review the backend trace for the failing request, and then expand the view to see all sessions that hit the same error group. When they escalate the ticket, the product or on-call engineer receives a clear narrative from the user’s perspective, so they can pinpoint which frontend error occurred and which backend services and releases were involved.
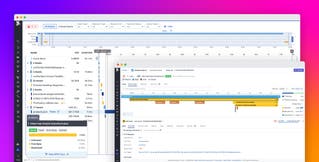
In the screenshot below, you can review how RUM lets you filter by affected sessions, view a session replay, and analyze related backend traces for a specific user journey.
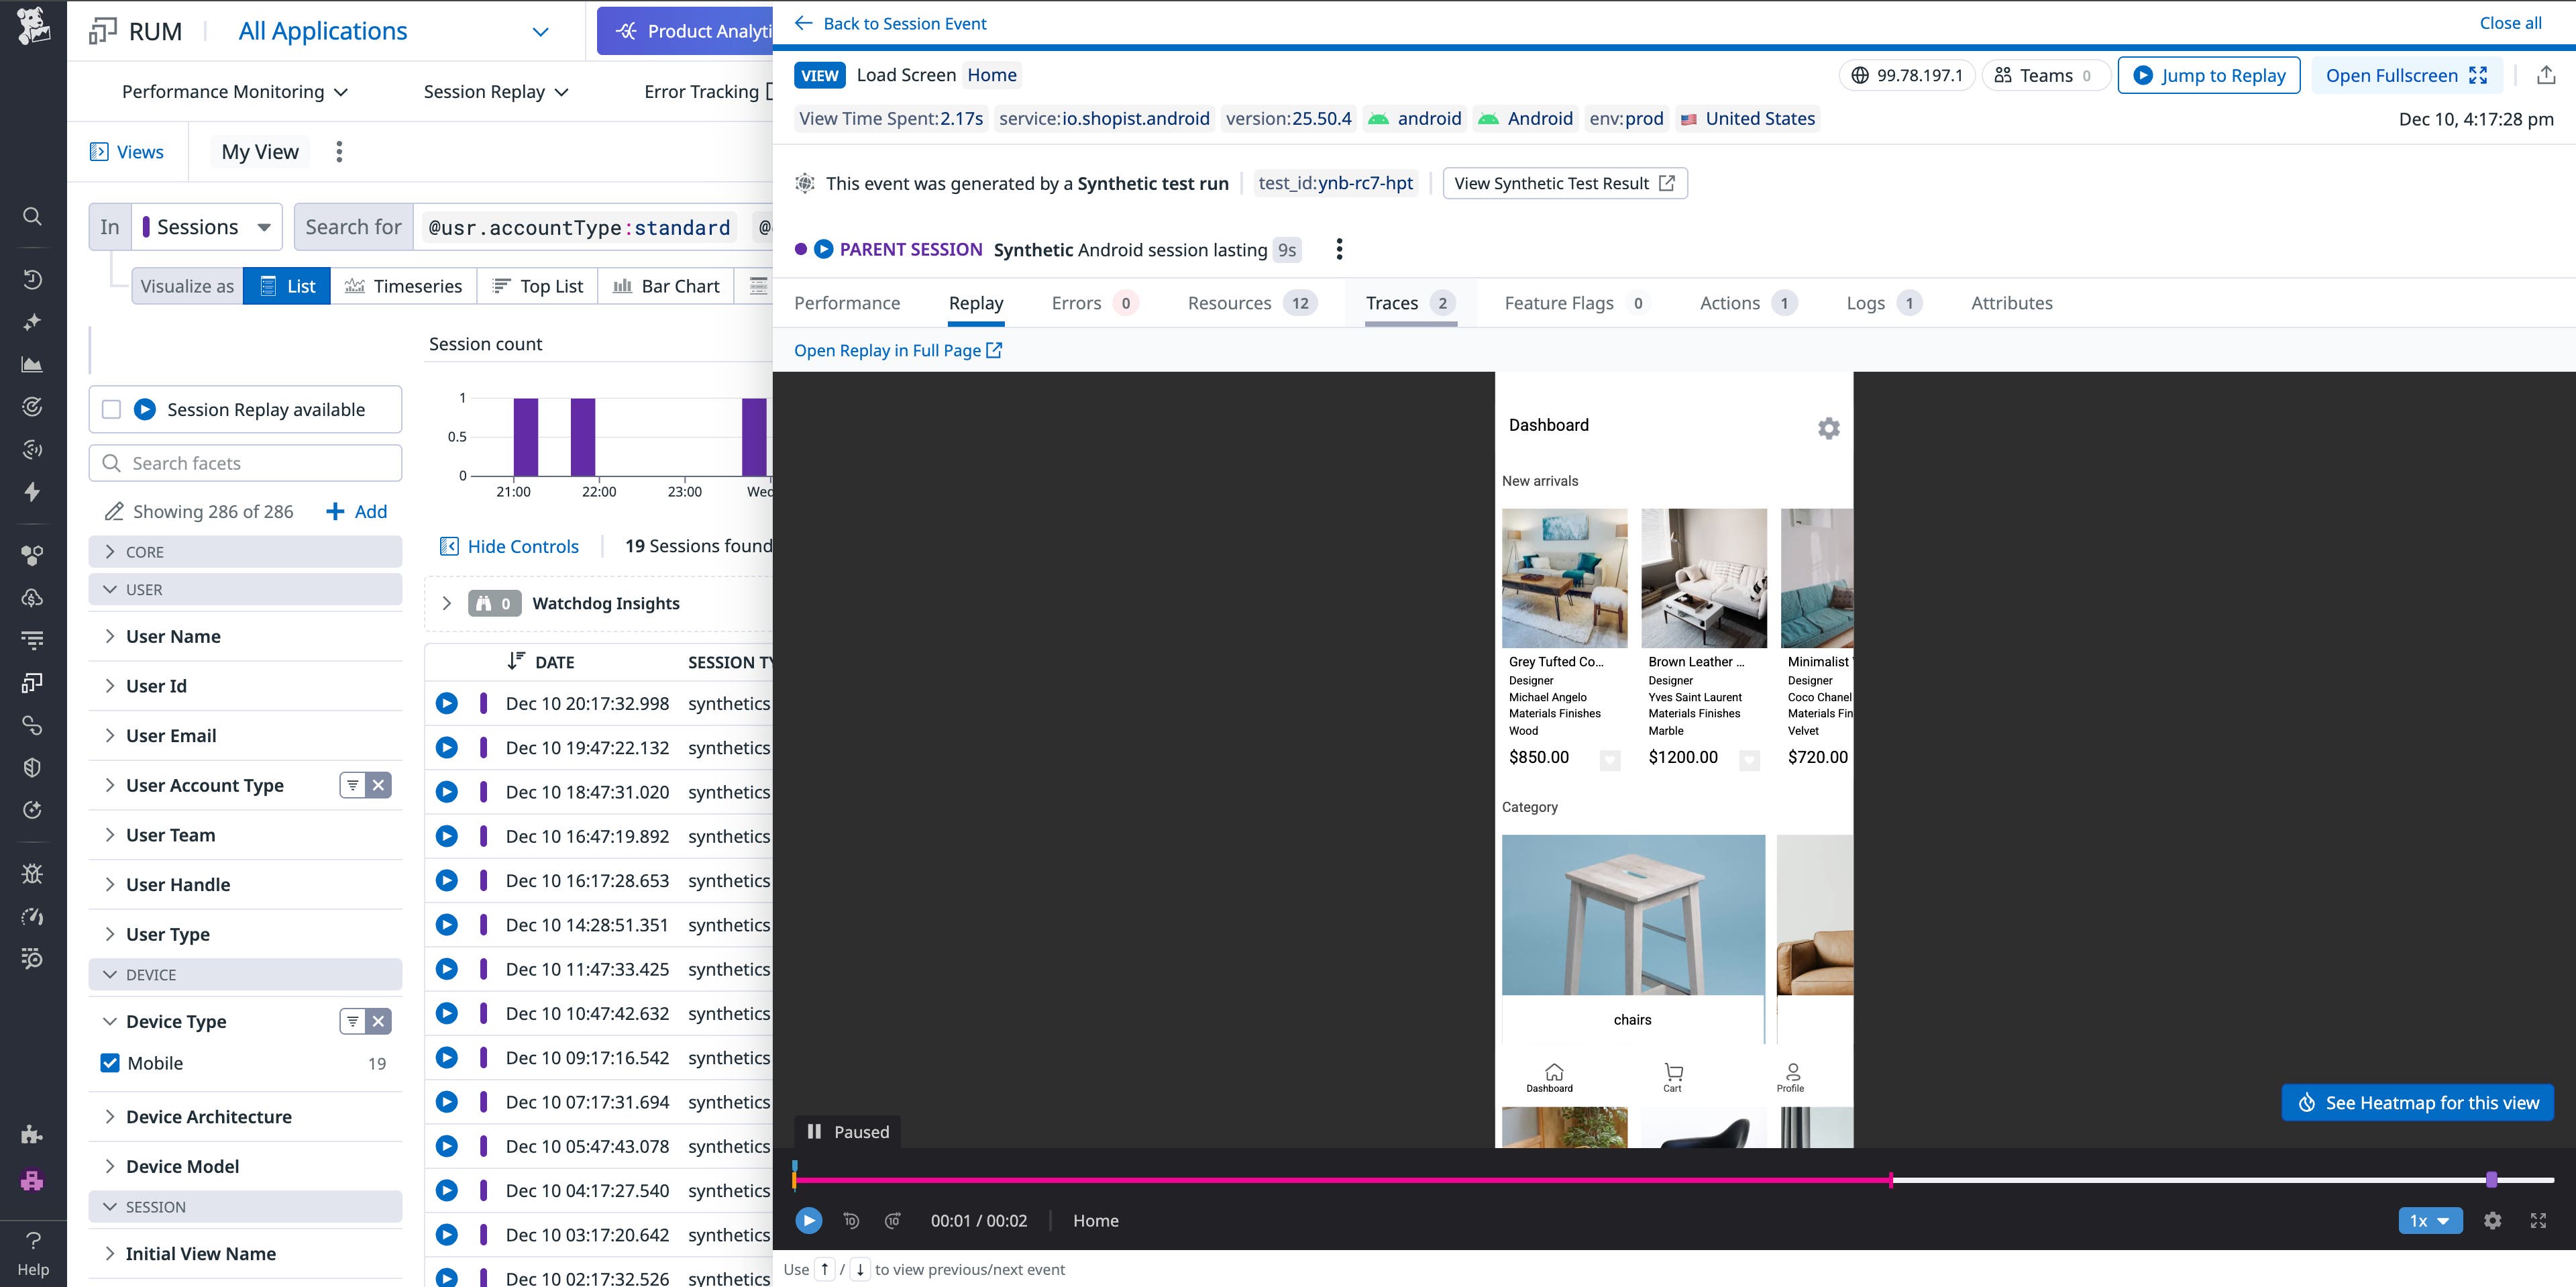
This gives engineers, product managers, and support teams a shared view of what an incident looked like for real users.
Quantify product impact with Product Analytics
With Product Analytics, you can define funnels and cohorts that use the same underlying events as RUM to quantify an issue’s impact. You can build funnels for key journeys, like signup, onboarding, checkout, or upgrade; filter and segment by plan tier, geography, device, or release version; and compare conversion between sessions that did and did not encounter a given error group.
In the following screenshot, the checkout funnel is filtered to sessions where customers used an unsupported browser. The blue bar on the left shows all of the customers that viewed their cart in that cohort, and the stacked bar on the right shows that 41.6% clicked “checkout,” while 58.4% dropped off. This makes the conversion and churn impact of the unsupported-browser error visible in a single view.
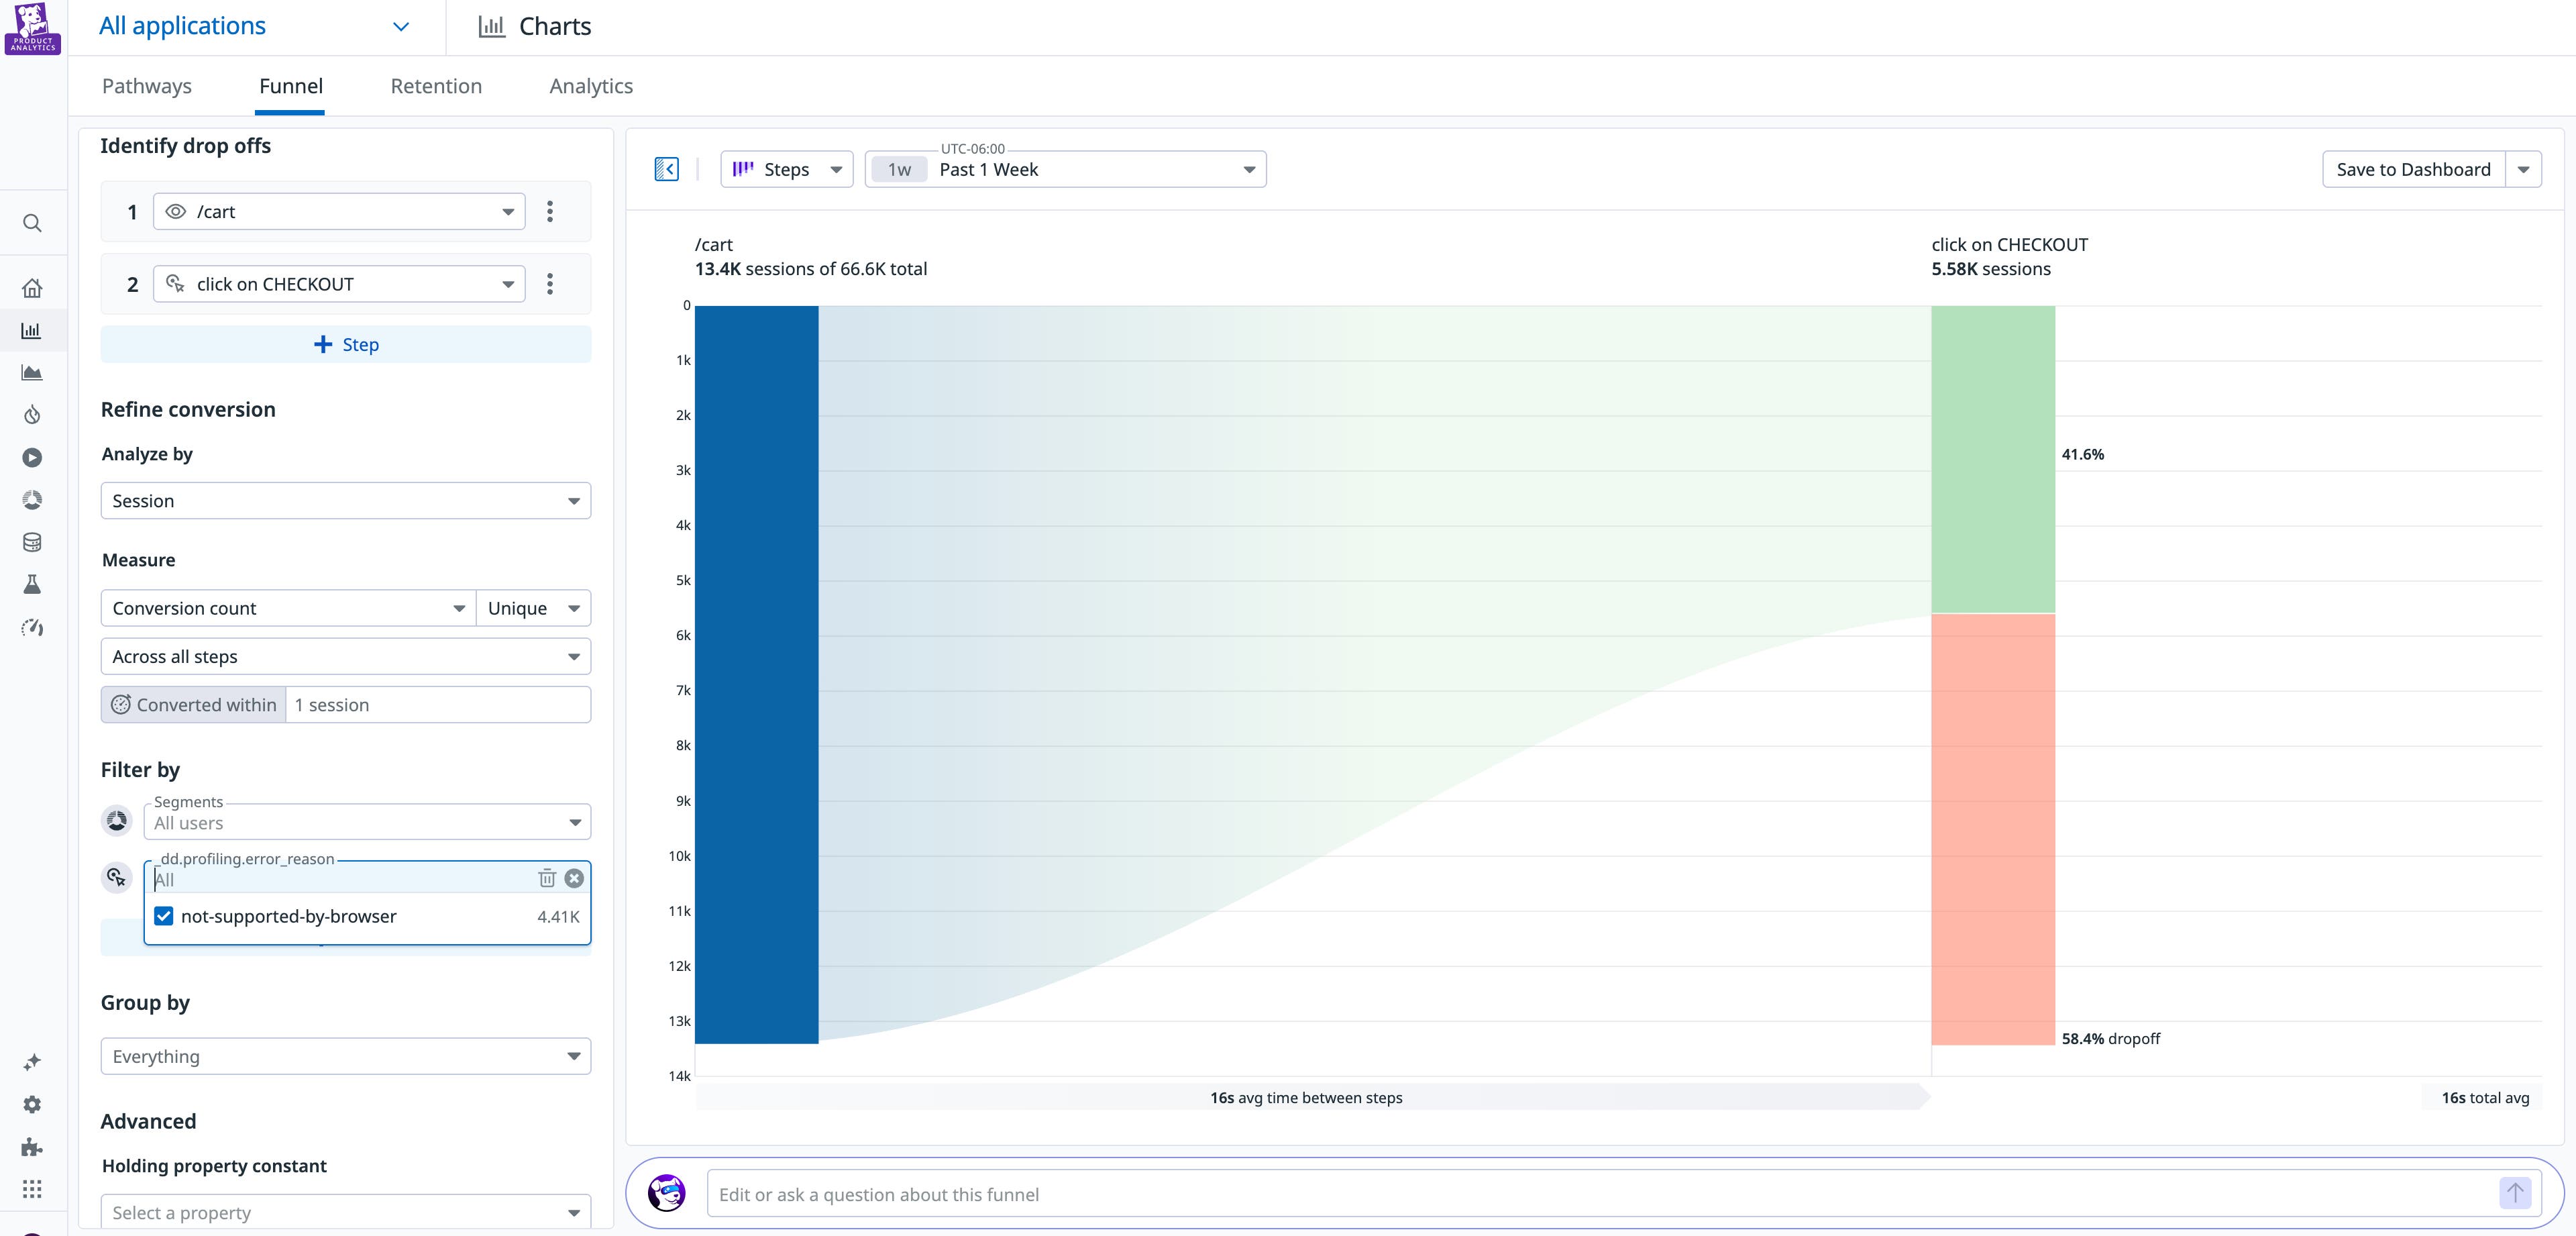
Product Analytics also provides a built-in statistical engine to perform comparisons automatically. It calculates confidence intervals, highlights statistically significant changes, and helps you understand which effects are detectable with your current traffic volume. For day-to-day questions, like whether a checkout error is truly moving conversion for a segment, you don’t need to run custom SQL or involve a data scientist every time.
Because Product Analytics runs on top of the same correlation identifiers you’ve already standardized, you can link conversion changes directly to traces, logs, and session replays.
Codify the loop with customer feedback and shared views
Once the data is flowing, you can embed this feedback loop into your daily workflows. You can connect support systems via Datadog integrations, like Zendesk, to ingest tickets and chats as events. When you tag those events with correlation identifiers, qualitative signals appear alongside your telemetry data. You can filter dashboards to show customer accounts with open tickets; navigate from a ticket to traces, logs, and session replays; and quantify how many sessions or users are associated with a group of related tickets.
Dashboards can show funnels, segment-level impact, and error budgets, with widgets that link directly to traces, logs, and session replays. Notebooks can document impact analyses step by step through cohorts, with-versus-without comparisons, and representative examples so that investigations are reproducible and shareable.
Monitors can be defined directly on impact metrics, so alerts trigger when user experience or revenue risk crosses a threshold. For example, you can filter by checkout conversion for sessions tagged with a specific error group instead of raw error counts. You can base SLOs on user-centric SLIs like sessions without errors or successful checkouts, creating clear error budgets that tie reliability work back to customer outcomes.
Turn incidents into product insight with Datadog
For early-stage teams, every incident is both a risk and an opportunity. When you close the loop between engineering telemetry data and customer feedback, engineering time flows toward defects that measurably harm user experience and revenue, and product and support teams can tell evidence-backed stories to customers and stakeholders. Each outage or regression also leaves behind a deeper understanding of how people actually use your product—not just a quieter dashboard.
Visit the Error Tracking, Log Management, APM, RUM, and Product Analytics documentation to learn more about how you can close the feedback loop with Datadog. New to Datadog and don’t already have an account? Sign up for a 14-day free trial.


