Kai Xin Tai
Since AWS Lambda was launched in 2014, serverless has transformed the way applications are built, deployed, and managed. By abstracting away the underlying infrastructure, developers are able to shift operational responsibilities to the cloud provider and focus on solving customer problems. At the same time, serverless applications face new challenges for monitoring—instead of system-level data from hosts, you need insights into function-level performance and usage, like cold starts, throttles, and concurrency. To provide comprehensive visibility into the performance of your serverless functions, Datadog APM natively supports distributed tracing for AWS serverless services.
APM reimagined for serverless
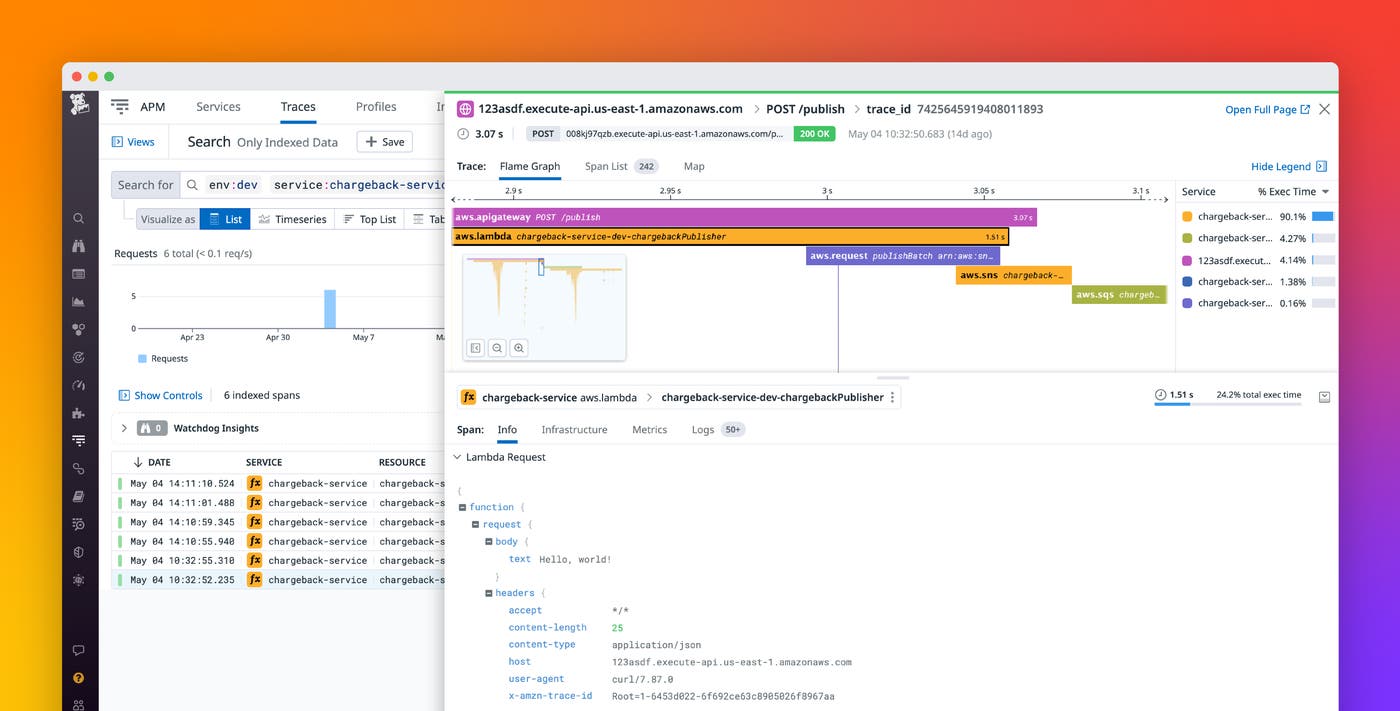
In serverless-first architectures, we know that performance—down to the millisecond—matters for your end-user experience and business objectives. So, we developed a lightweight solution that embraces the nuances of serverless and delivers the deep performance insights you need. Datadog’s Lambda extension makes it simple and cost-effective to collect detailed monitoring data from your serverless environment. Our extension collects diagnostic data as your Lambda function is invoked—and pushes enhanced Lambda metrics, logs, and traces completely asynchronously to Datadog APM. Since the extension runs in a separate process, it will typically continue to run during function failures and timeouts, enabling you to better troubleshoot exactly what went wrong.
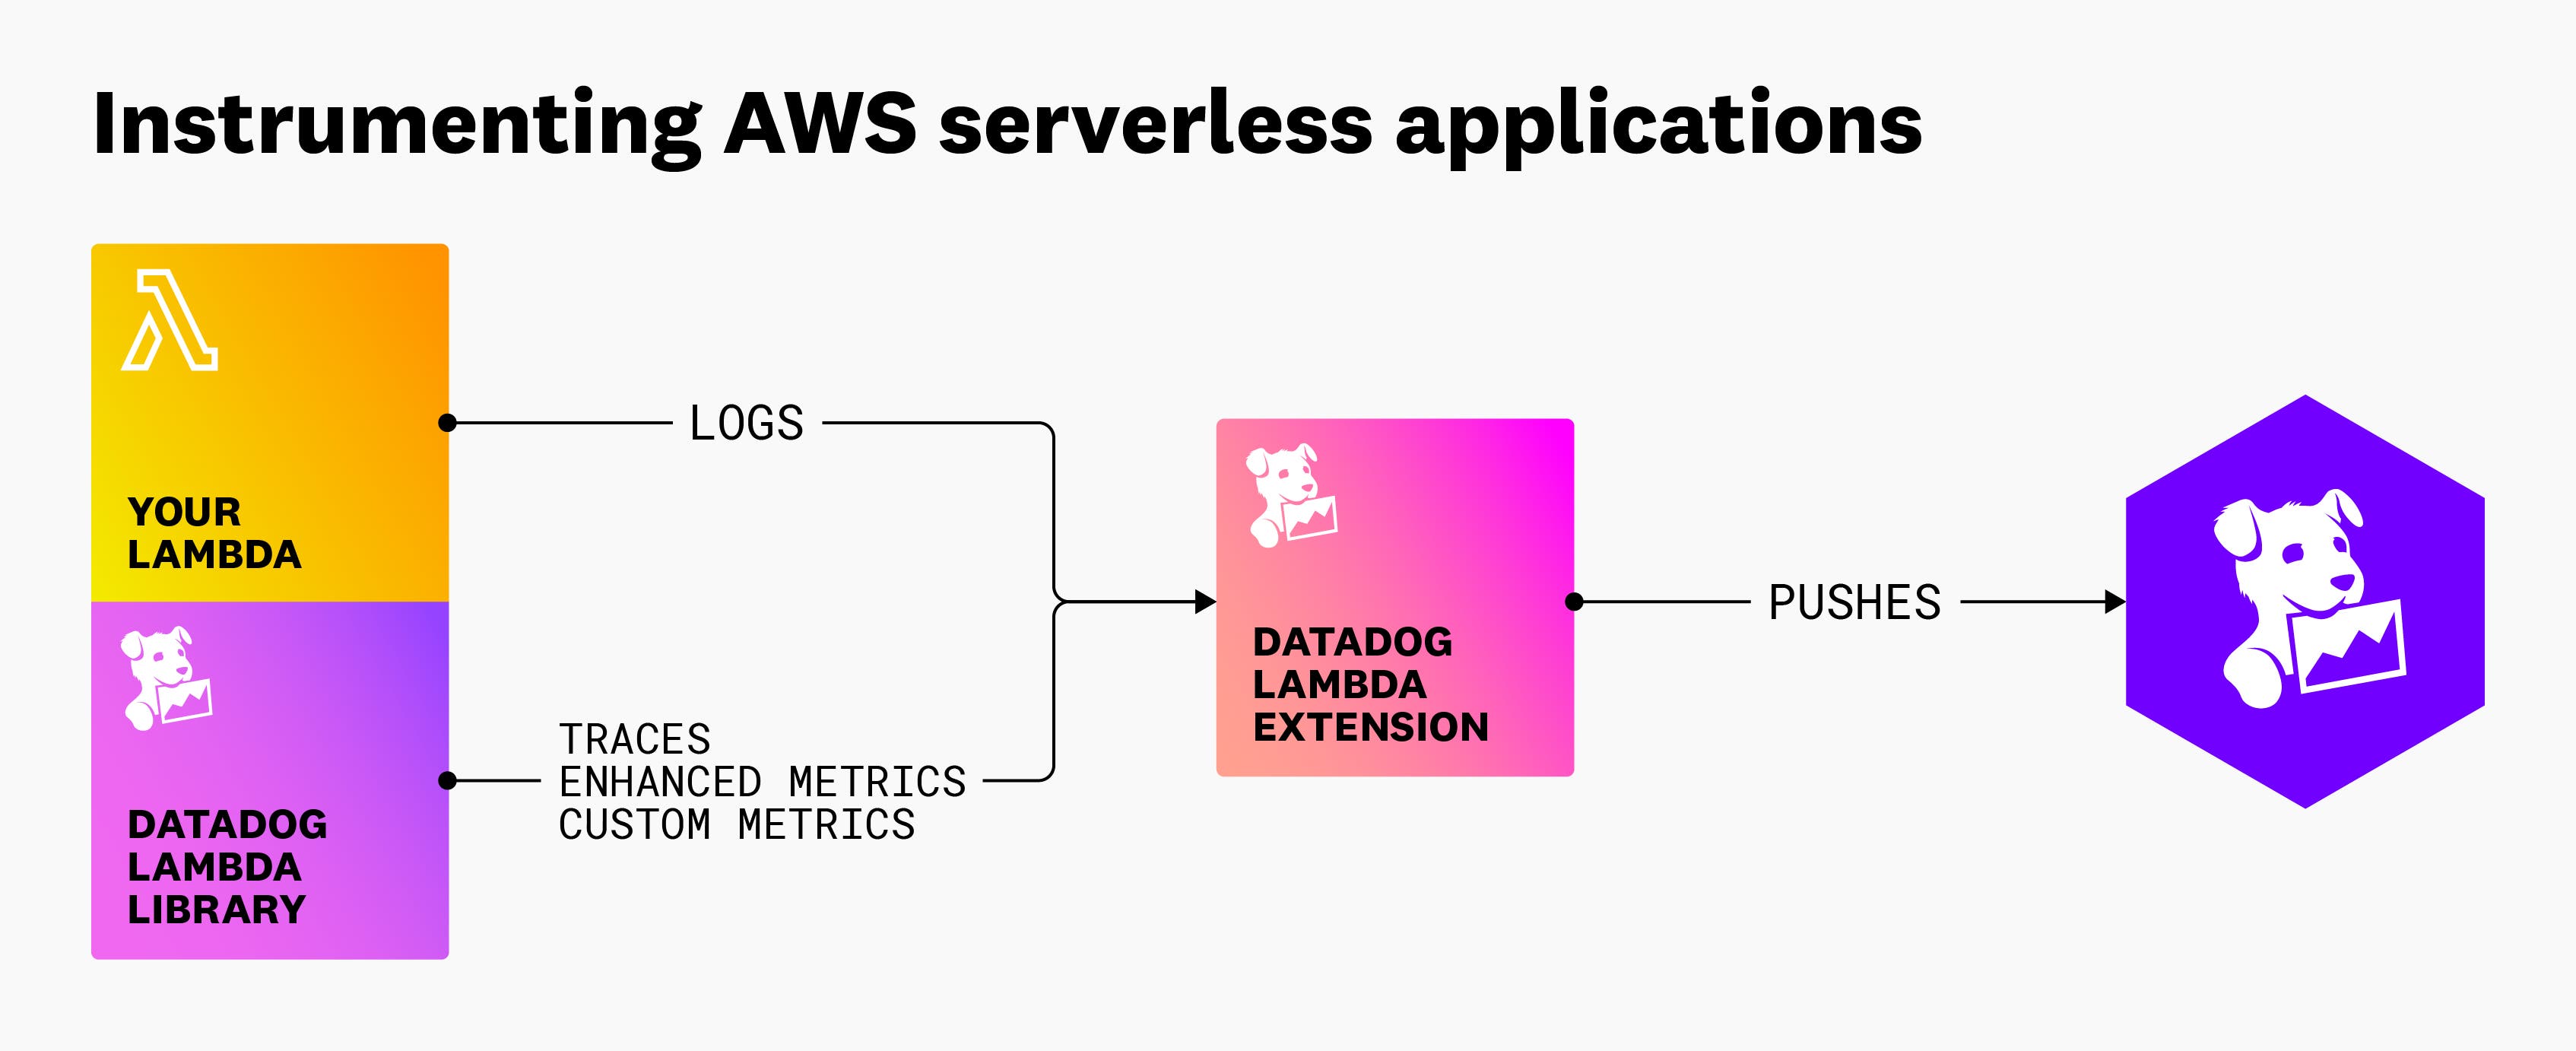
The Lambda extension offers powerful tracing capabilities for your serverless applications, including:
- Seamless integration with managed services like AWS API Gateway, AWS SNS, AWS SQS, Amazon EventBridge, and Amazon Kinesis
- The ability to capture Lambda authorizers, request and response payloads, and load times
- Automatic generation of spans for loading files
- The ability to identify cold starts for Lambda functions
With APM, you can leverage the extension’s capabilities to get end-to-end visibility into requests that flow across Lambda functions, hosts, containers, and other infrastructure components—and zero in on errors and slowdowns to see how they impact your end-user experience. For instance, APM can help you determine if cold starts during peak traffic hours (or other issues that arise during your serverless workflows) are causing users to prematurely leave your website. Or, you can use APM to capture traces of background jobs—such as data processing or file indexing—and set up monitors to alert you when requests to downstream resources fail.
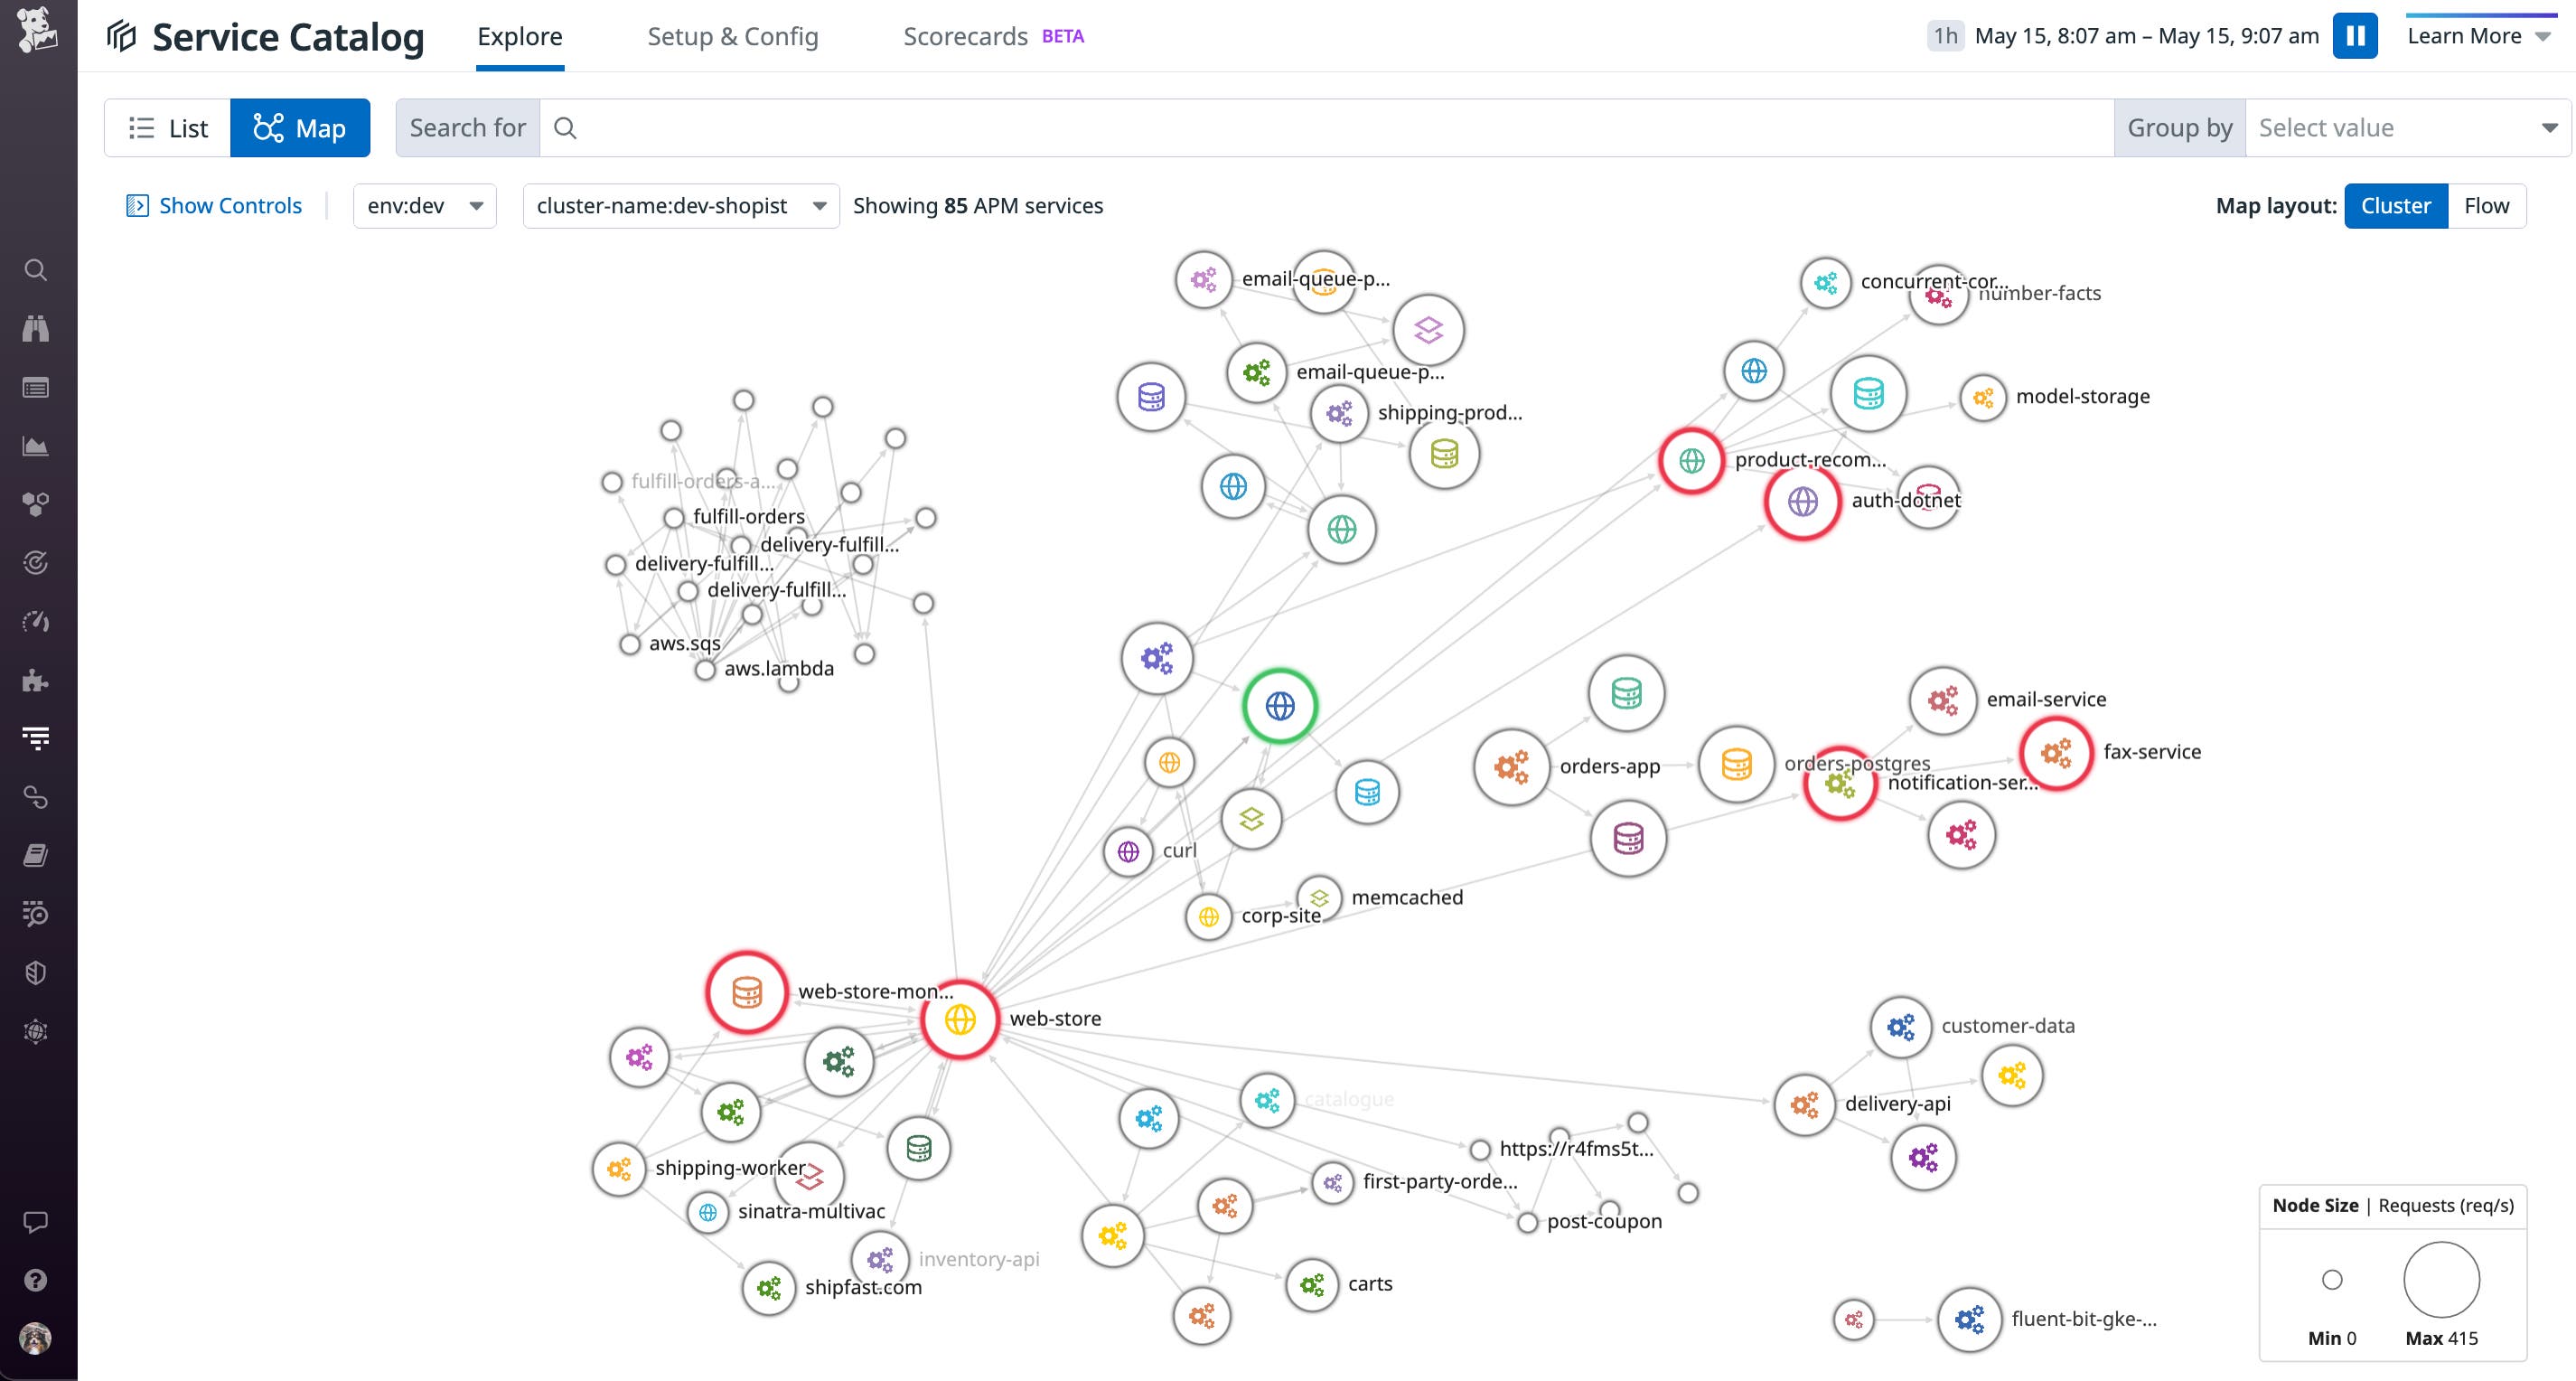
Native tracing with APM builds on the insights you get from our other monitoring features—including the Serverless view and the Service Map—to provide a comprehensive, context-rich picture of the usage and performance of your serverless functions.
Instrument your AWS Lambda functions
To get started, make sure you’re running the latest version of Datadog’s Lambda extension. We recommend using the Datadog CLI because it modifies existing Lambda configurations without requiring a new deployment. After installing and configuring your CLI client with the necessary AWS and Datadog credentials, you can then instrument your Lambda function by running the following command:
datadog-ci lambda instrument -f <FUNCTION_NAME> -f <ANOTHER_FUNCTION_NAME> -r <AWS_REGION> -v <LAYER_VERSION> -e <EXTENSION_VERSION>In addition to our dedicated CLI, Datadog provides other installation methods to match your environment, including via the Serverless Framework, AWS SAM, and AWS CDK. Check out our documentation to learn how to instrument your functions by using one of these tools.
Capture request traces, then drill down to investigate issues
Datadog visualizes the full lifespan of all your requests, regardless of where they travel. So whether a request begins on a VM and triggers a serverless function that writes data to an Amazon DynamoDB table, or flows across multiple microservices, Datadog captures it all to help you track critical business transactions and understand how performance issues impact end-user experience.
When it comes to observability, metrics tell us what is happening while traces and logs help us paint a picture of why it is happening. As an example, let’s say you’re running an e-commerce site, and as part of the checkout flow, your application makes a request to a Lambda function that validates coupon codes. When the coupon validation service exhibits a spike in maximum request latency (aws.lambda.duration.maximum), APM helps you pinpoint bottlenecks, so you can effectively resolve the issue at hand.
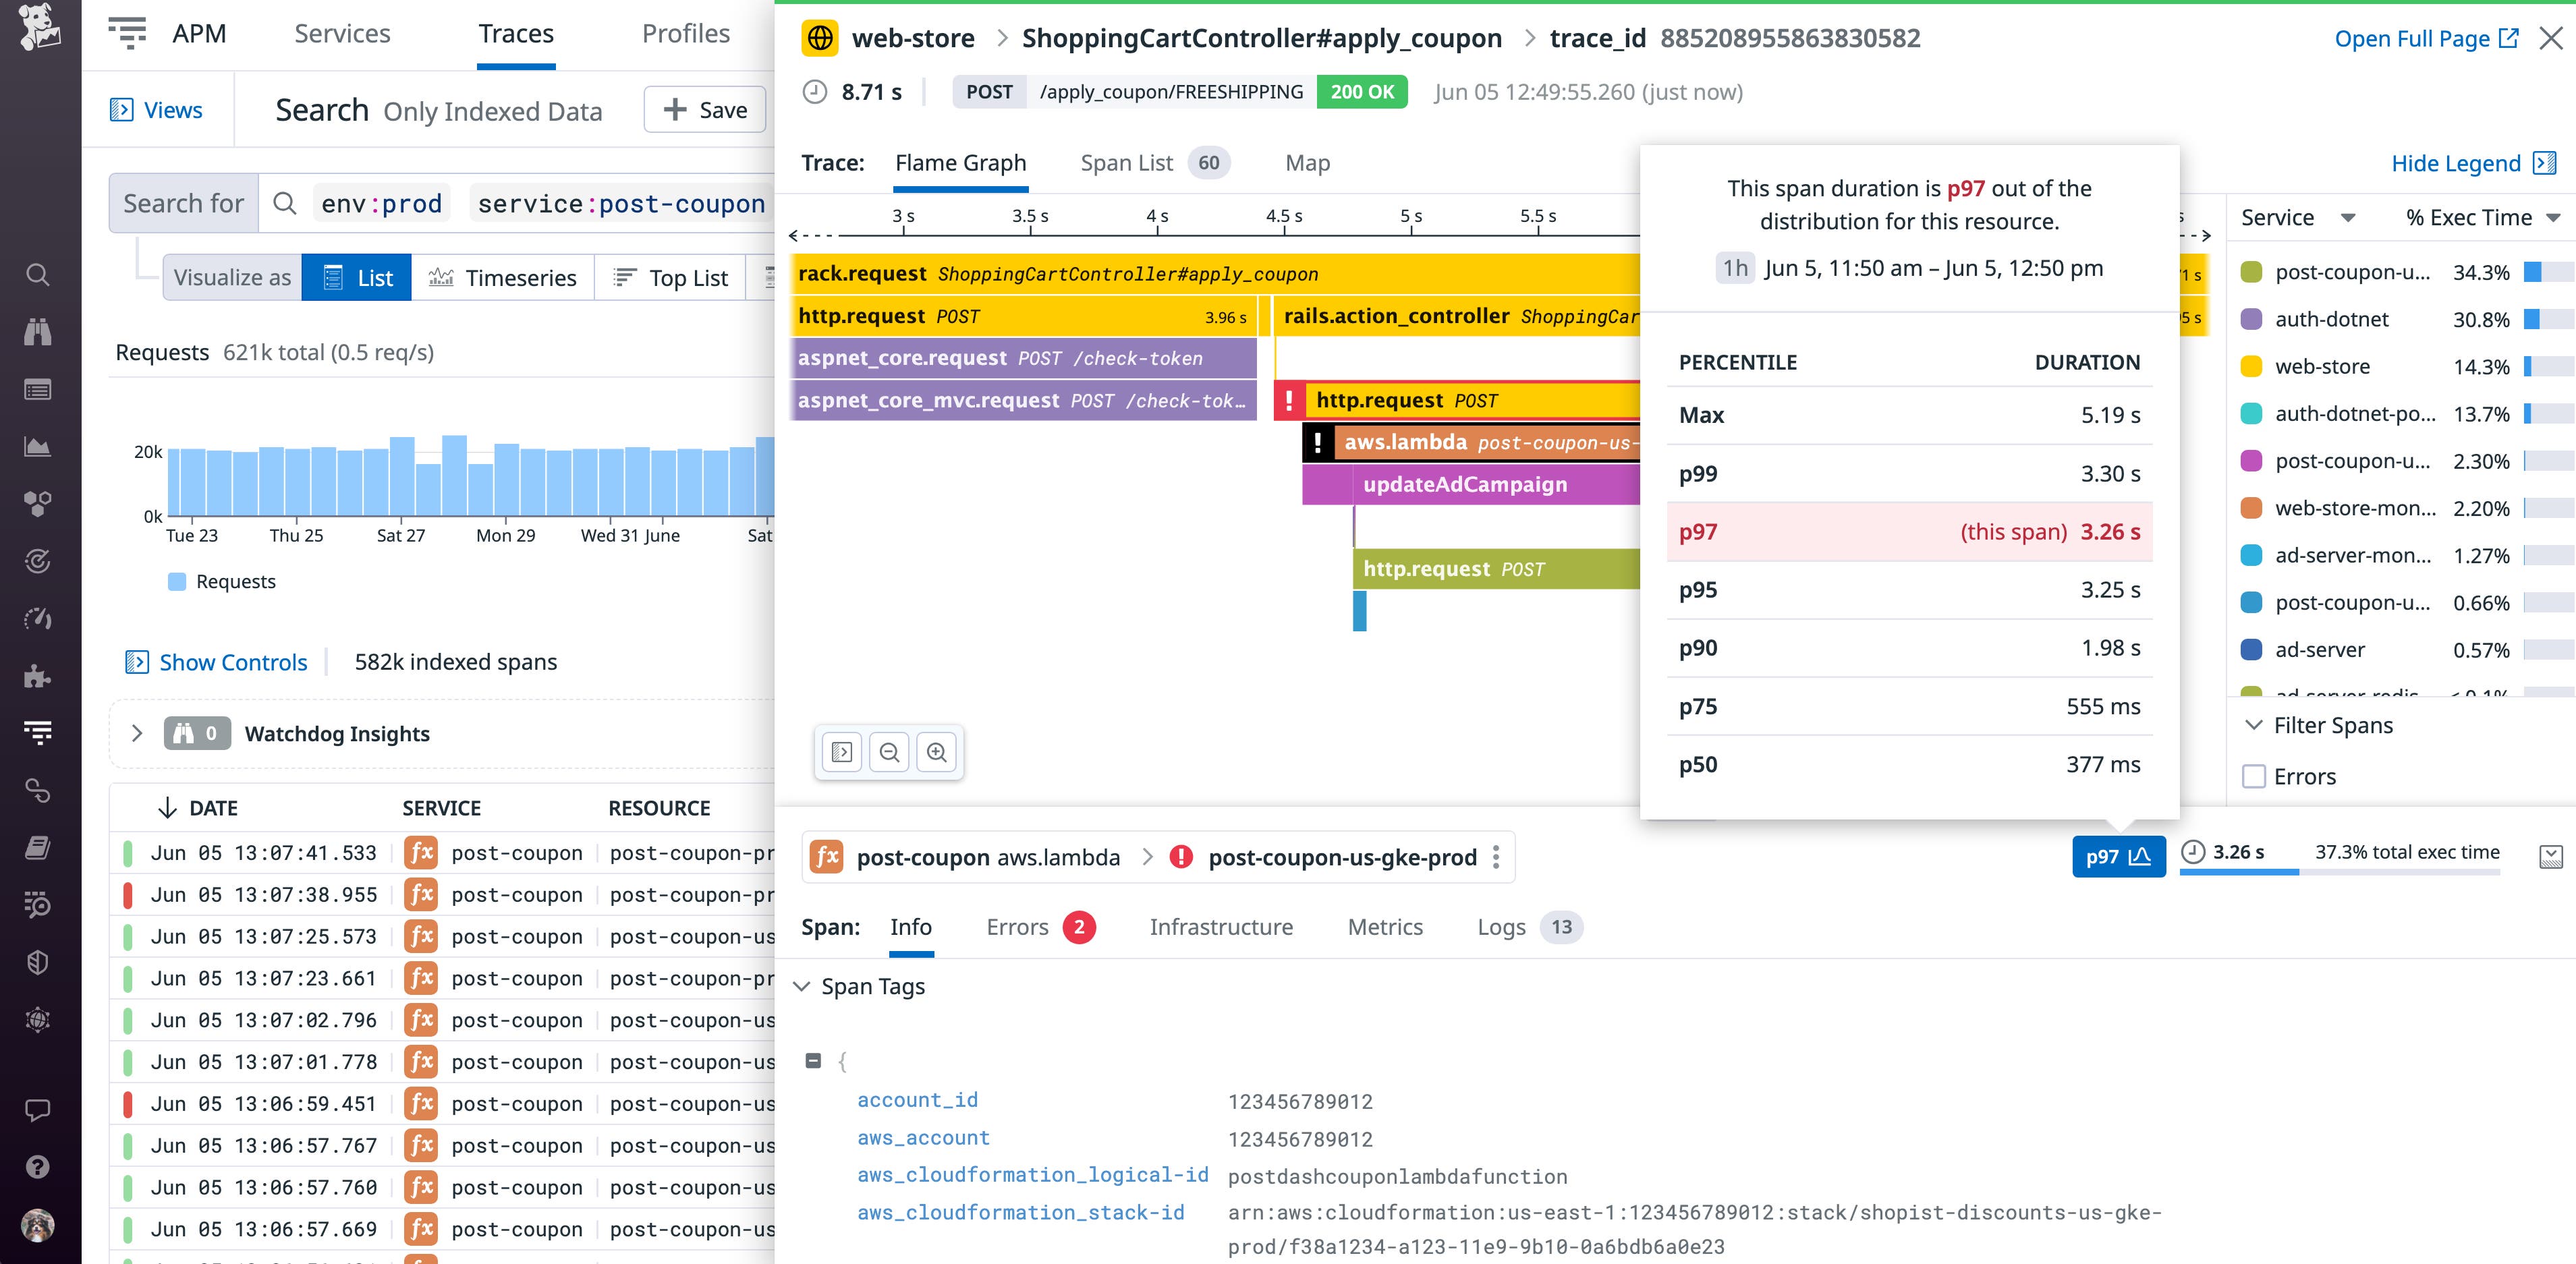
In the trace above, we can quickly identify a particularly slow span at the bottom involving the loading of an in-memory coupon database. By hovering over the duration distribution for this resource, we can see that this span is significantly slower than its average duration of 377ms. If you need further context for troubleshooting, you can click on the Logs tab to pivot to the associated logs generated during this request. Under tags in the Info tab, you can also find Lambda request and response payloads that can deliver valuable insight into missing parameters and context surrounding errorful status codes. To determine the root cause of an error, you can navigate to Error Tracking via the Errors tab to review all associated stack traces and more. With your traces, metrics, and logs all in one place, you can get end-to-end visibility across your entire serverless infrastructure—without having to switch contexts or tools.
Slice and dice trace data across any dimension
Investigating errors and bottlenecks during critical periods, such as outages, can be challenging and time-consuming. Datadog’s ingestion controls allow you to quickly search and filter by high-cardinality dimensions, or tags, to find the needle-in-the-haystack trace you need—without using a custom query language. In addition to any custom tags you’ve configured, Datadog applies tags to your traces based on automatically detected AWS metadata—such as the function name, region, and service—so you can drill down by attributes that matter to your business.
For instance, by filtering down traces by customer ID and inspecting one in more detail, you can track an individual customer’s journey and determine the impact of a performance issue on your business. By looking at the trace below, we can see that this user encountered a 5xx error on the payments page and was unable to check out, resulting in a direct loss of revenue for the business.
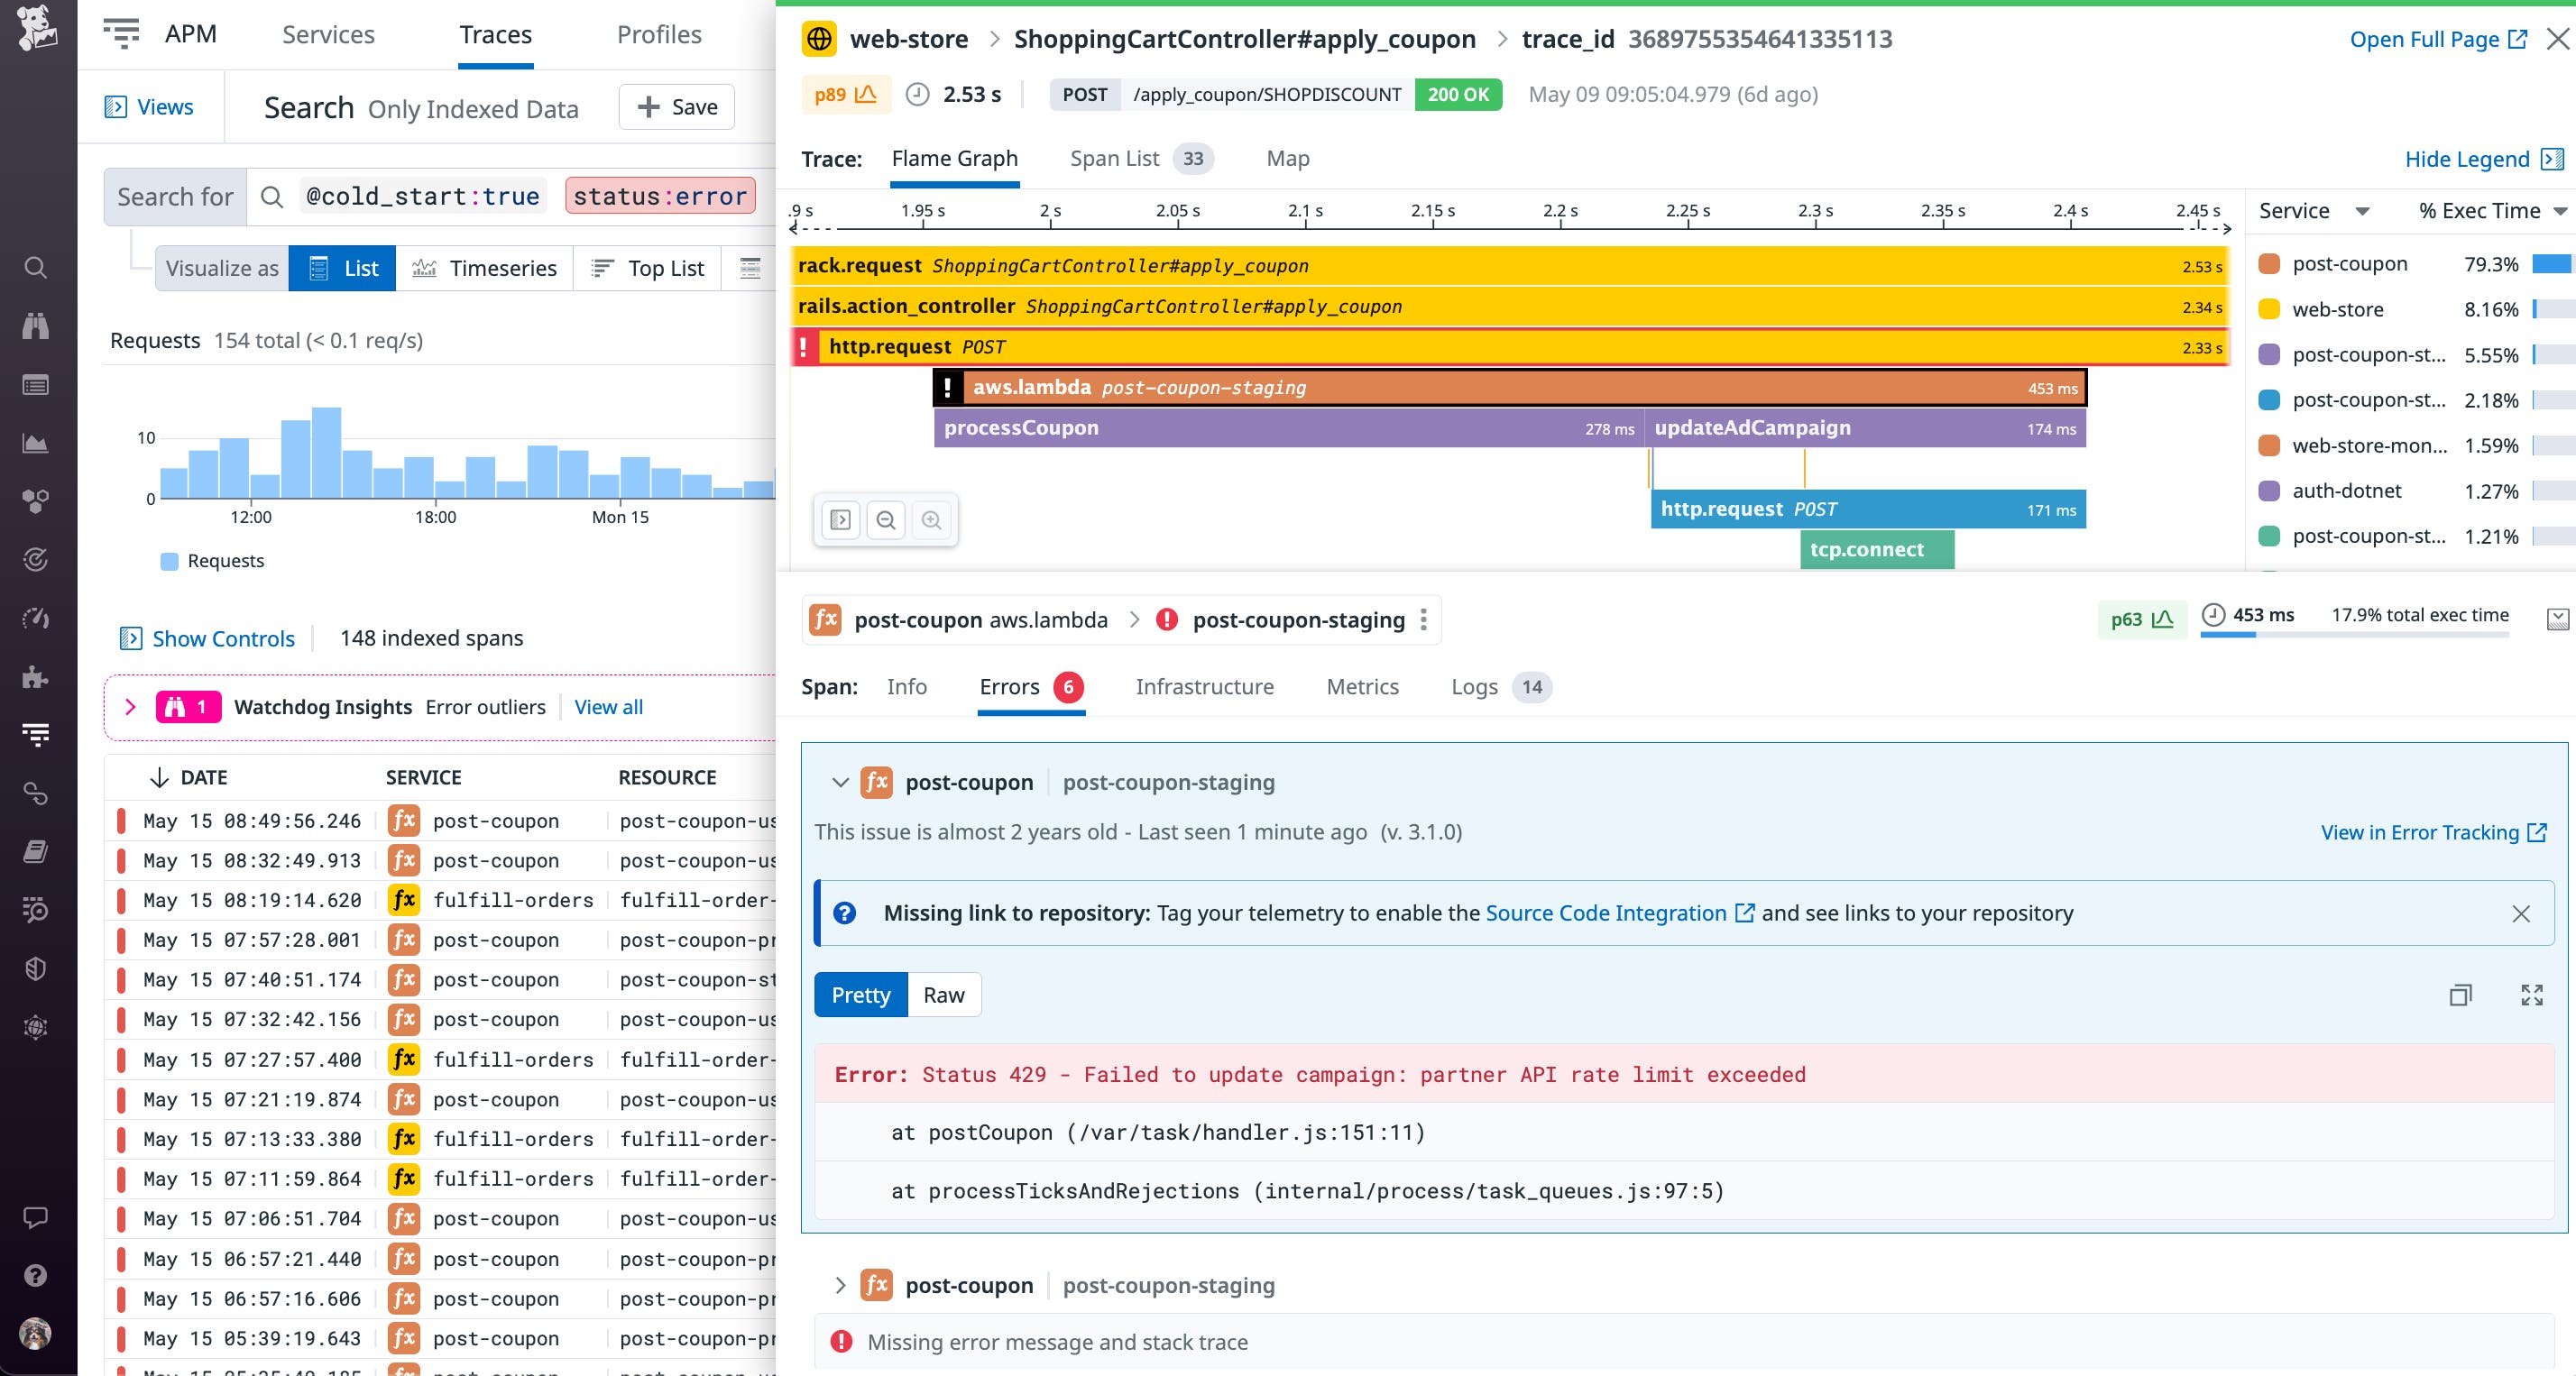
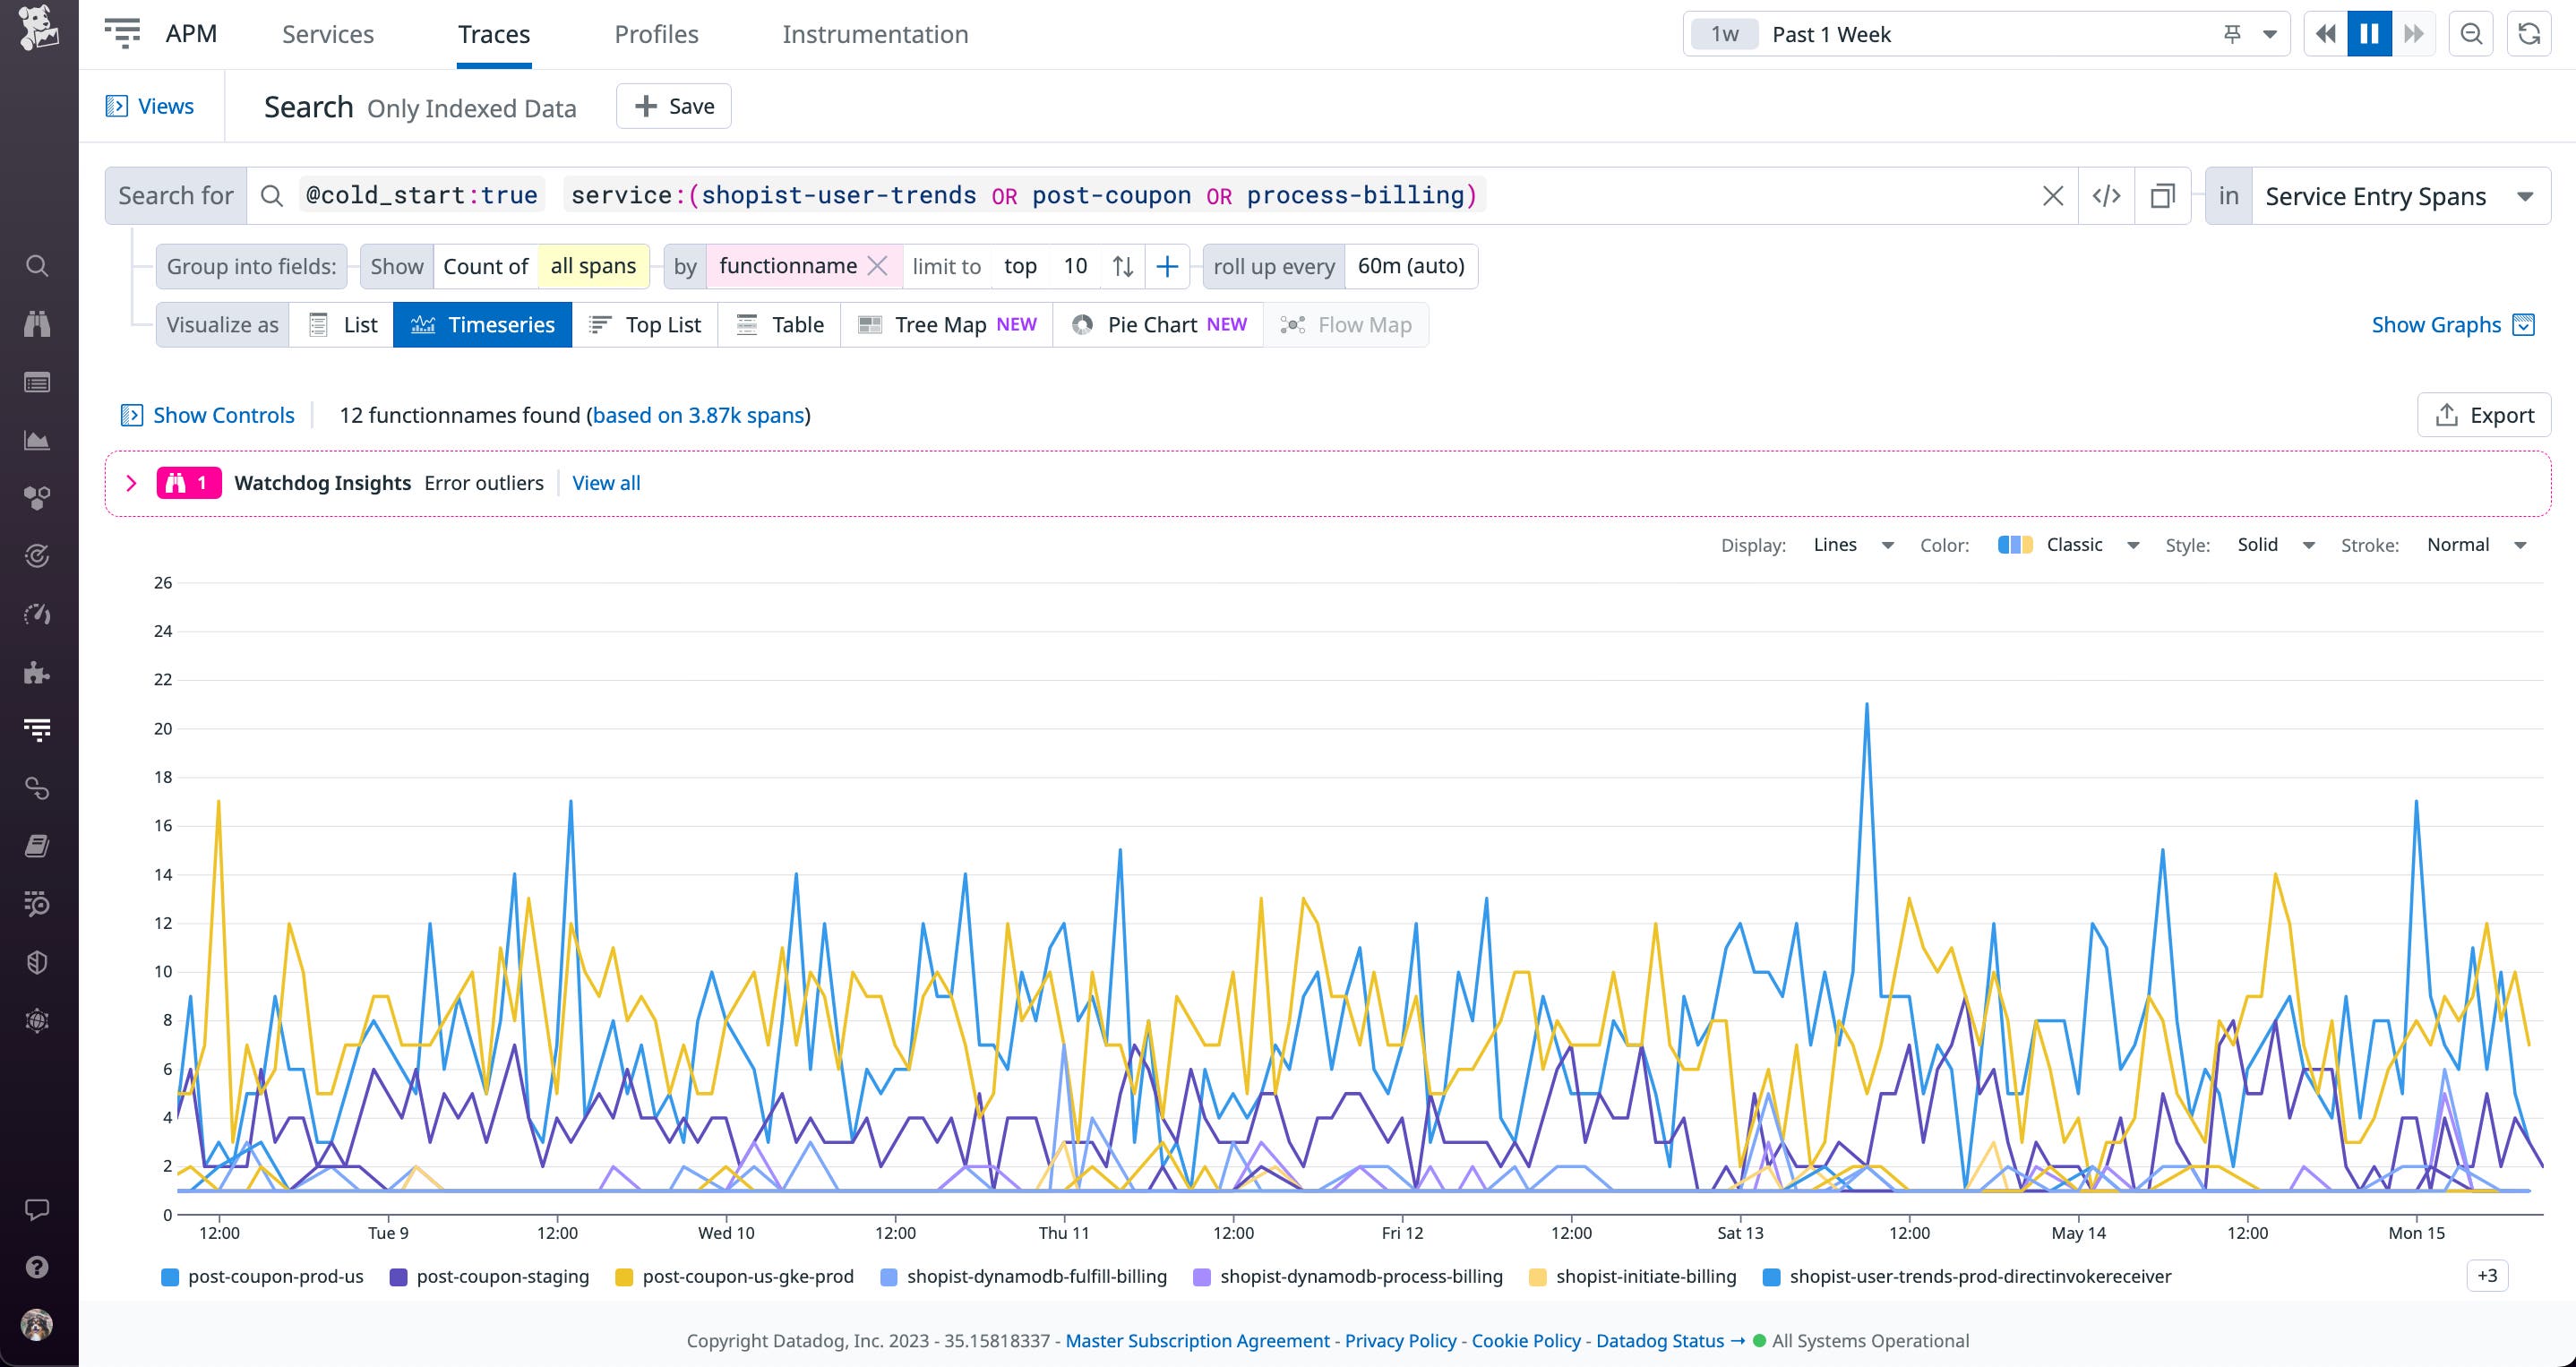
You can also use these tags to analyze your application’s performance—and if you see anything interesting, you can dive into the relevant subset of traces for more detailed analysis. For example, Datadog automatically detects cold starts—an increase in response time when a Lambda function is invoked after a period of idleness—and applies a cold_start attribute to your traces.
Graphing cold starts by function can help you understand the impact of this increased latency on user experience—and identify the specific times of the day when configuring provisioned concurrency would be beneficial. As you explore your APM data, you can easily export any useful graphs to your dashboards so that you can monitor them alongside other key datapoints from your serverless infrastructure.
Seamless support for other tracing methods
To explore different methods of instrumenting your serverless application, our documentation provides a range of examples so that you can decide what method best suits your needs. For example, if you need to trace managed services like AWS AppSync or Step Functions, Datadog has built-in trace merging capabilities that can unify X-Ray traces with Datadog APM traces from your Node.js and Python Lambda functions.
Serverless meets complete observability
With native, end-to-end tracing now available for AWS Lambda through Datadog APM, you can get deep visibility into all your serverless functions, without adding any latency to your applications. Correlating traces with metrics and logs gives you the context you need to optimize application performance and troubleshoot complex production issues. Our community-driven tracing libraries are part of the OpenTelemetry project, a unified solution for vendor-neutral data collection and instrumentation.
Datadog APM currently supports tracing Lambda functions written in Node.js, with support for Python, Ruby, Go, Java, and .NET runtimes. Our Lambda and tracing libraries support different features depending on your runtime, so check out our documentation to learn more. If you’re new to Datadog, you can start monitoring your serverless applications with a 14-day full-featured free trial today.
