Alex Cuoci

Mallory Mooney
Many organizations leverage AWS to build fully managed, event-driven applications, which break down complex workloads into APIs, event streams, and other decentralized services in order to improve performance and scalability. This type of architecture relies primarily on AWS Lambda functions to process synchronous and asynchronous requests as they move between a workload’s resources, such as Amazon API Gateway and Amazon Kinesis.
Datadog Serverless Monitoring already provides distributed tracing for functions to bring you detailed, real-time insights into your Lambda-based applications. Today, we’re building on our existing serverless monitoring capabilities to bring that same level of visibility to the rest of the AWS managed services that interact with your Python and Node.js Lambda functions.

We’re rolling out support for Amazon API Gateway, SQS, SNS, Kinesis, EventBridge, S3, and DynamoDB, so you can now:
- detect and alert on increases in latency and errors for managed APIs, queues, and data stores
- pivot directly from AWS service alerts to associated high-latency or error traces for faster troubleshooting
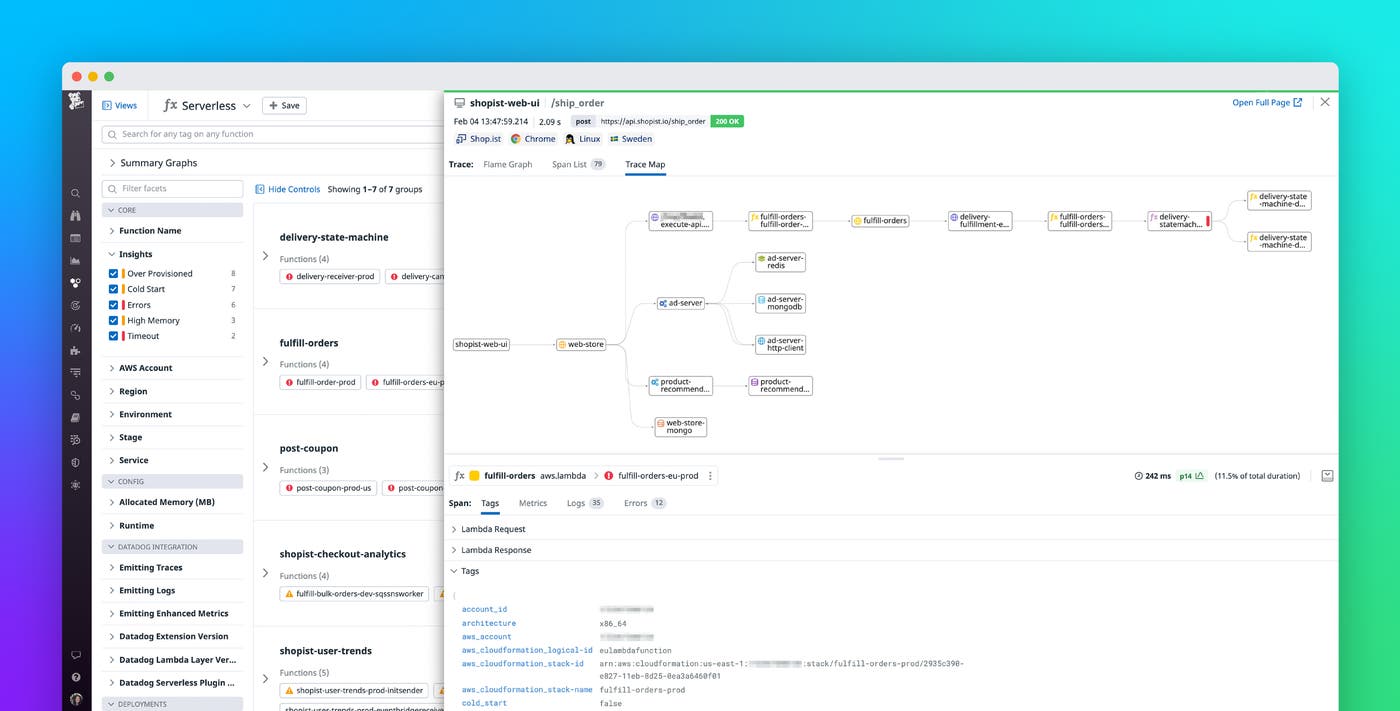
- visualize the relationship between each of your fully managed services in the APM trace map
- correlate latency or error traces with a service’s performance metrics in one place
Collectively, these capabilities give you multiple entry points into any request’s path as it flows across AWS services and Lambda functions, so you have full visibility into your event-driven workloads and can identify and troubleshoot performance issues at their source.
End-to-end visibility for serverless applications
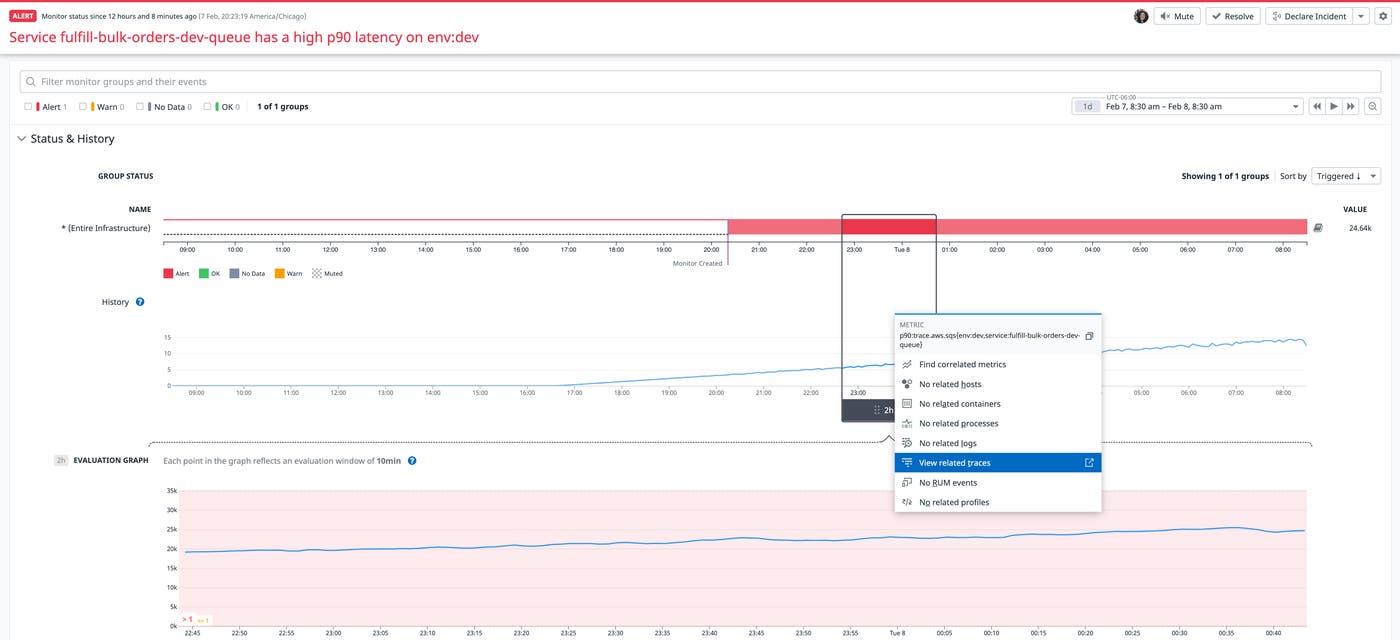
When your serverless application’s performance starts to decline, you need to know exactly where the breakdown occurs—and which AWS services are involved—in order to resolve the problem before it becomes more serious. You can already pivot from Lambda alerts to a corresponding trace in order to troubleshoot issues with individual functions. Our updates expand on this functionality by allowing you to move from an alert for any managed AWS service to associated high-latency and error traces. Now, you have even more ways to investigate the source of user-facing latency and other issues that can occur anywhere in an asynchronous and synchronous request’s path.
For example, if Datadog detects increased latency in an SQS message queue, you can pivot from the triggered alert directly to related traces for faster troubleshooting.
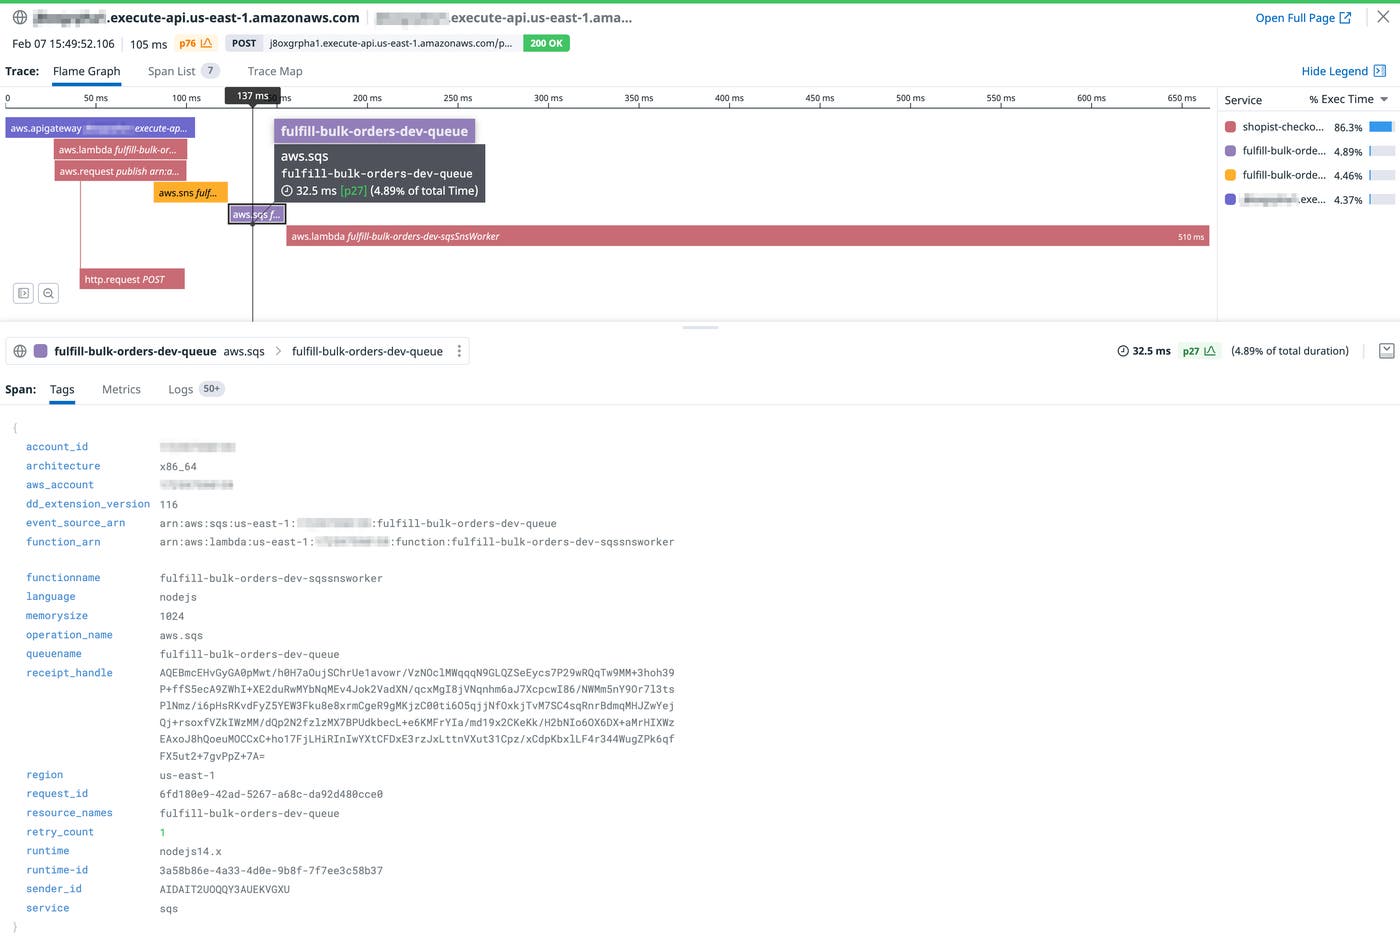
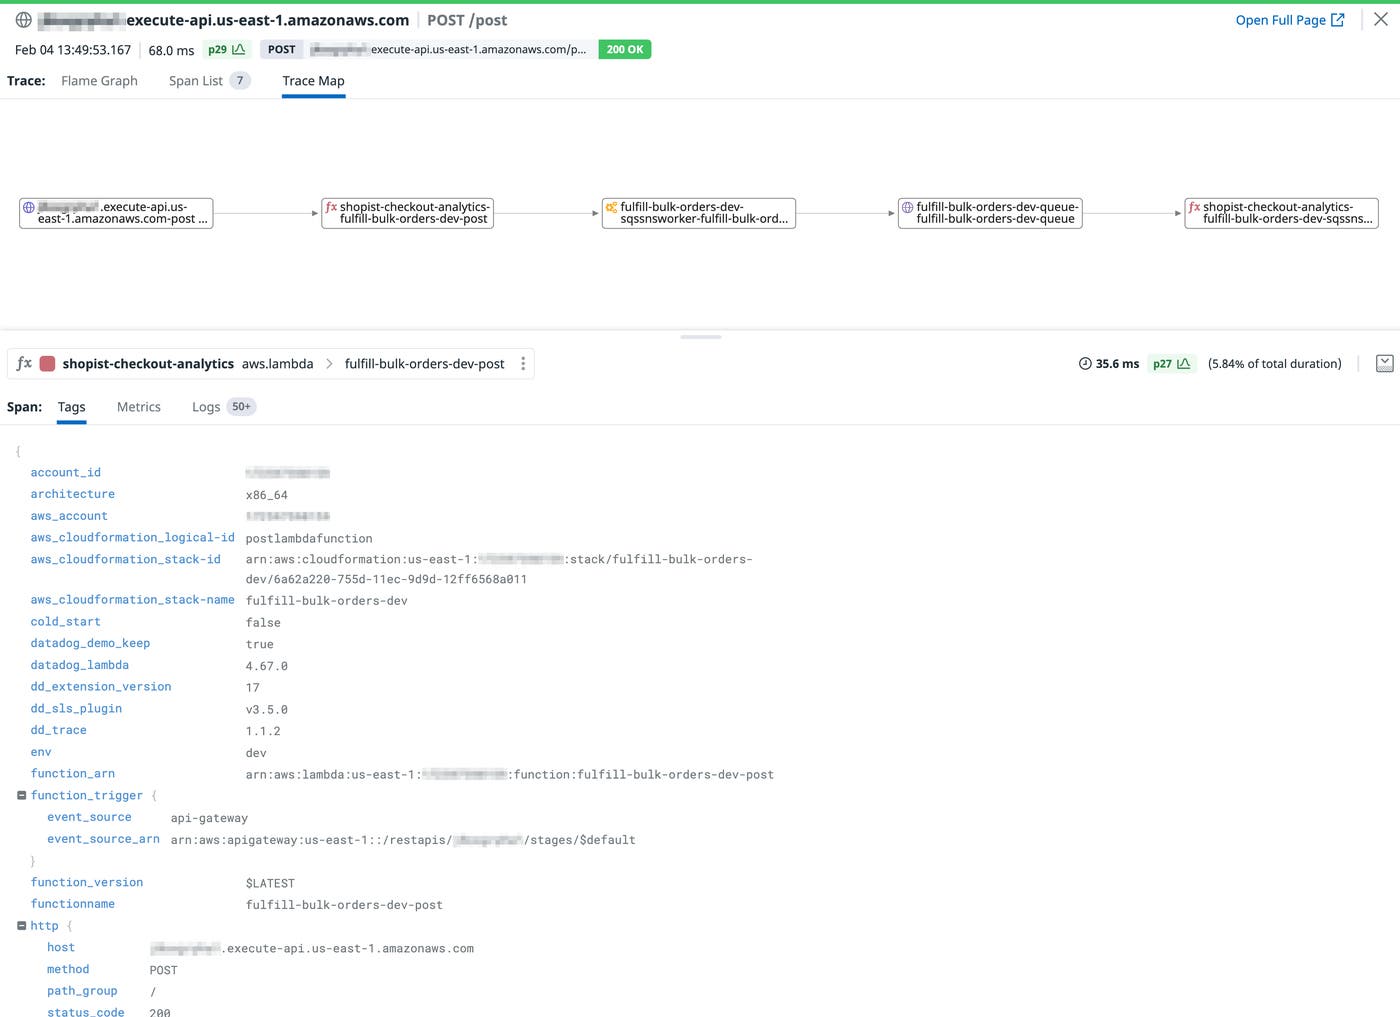
As you’re inspecting a trace, you can use the flame graph and its context-rich spans to break down the time a request spent interacting with each of your AWS services and functions in order to identify the root cause of a triggered alert. Selecting an individual span enables you to view more details about the service’s configuration during the time of the request.
You can also use the new trace map—similar to Datadog’s request flow map—to visualize a trace in its entirety, giving you a better understanding of the lineage of AWS resources processing your requests.
Quickly resolve request latency and errors
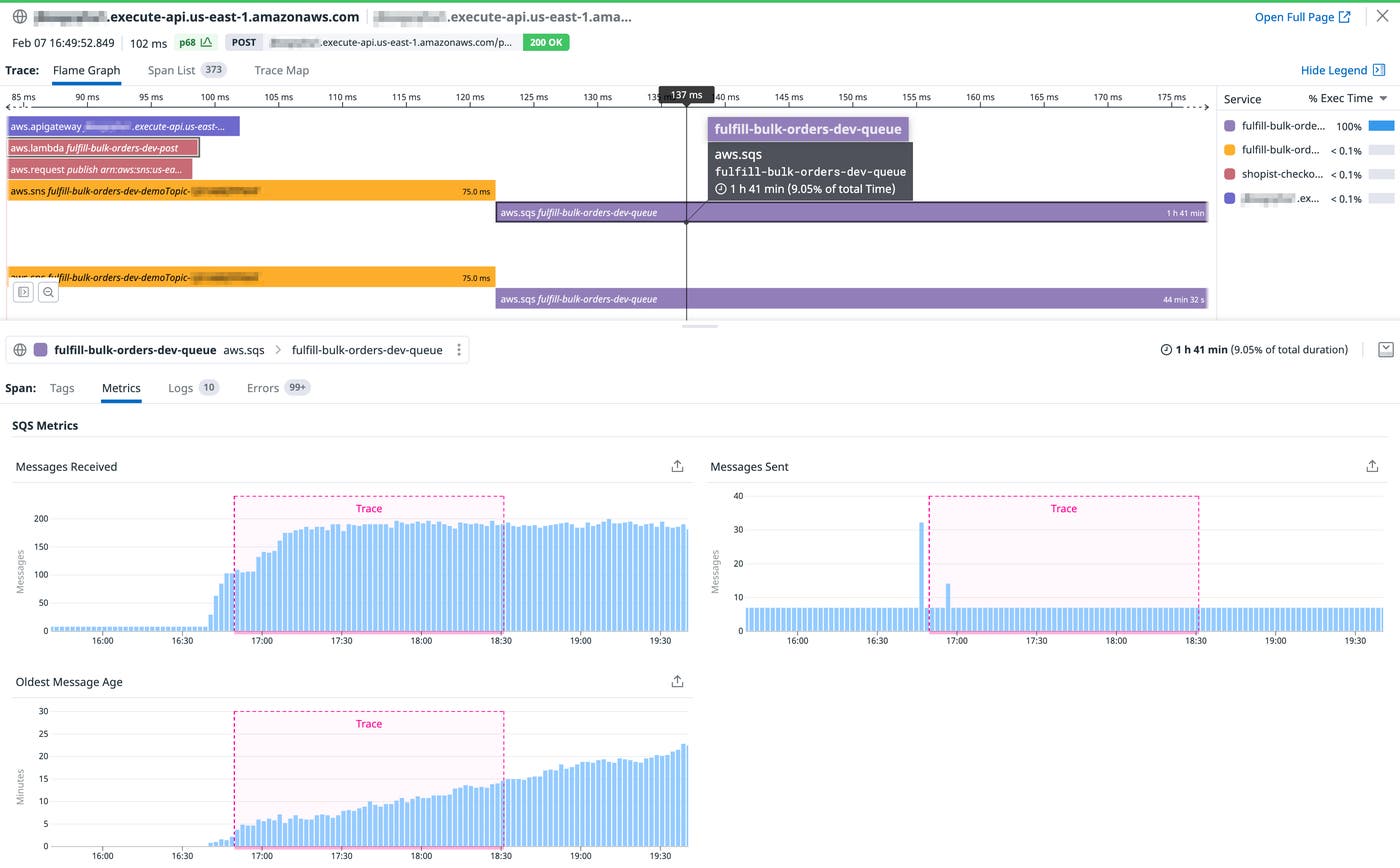
High latency and errors are common performance issues that can occur at any point in a request’s path within an event-driven workload, regardless of whether the request is traversing through a Lambda function or another fully managed AWS service. Datadog gives you the ability to correlate traces with key performance metrics from each of your AWS services directly in the trace view, so you can determine if a misconfigured service is driving increased errors or latency.
For example, you can compare a high-latency trace for an Amazon SQS queue to the age of the queue’s oldest message. If the age has also increased, you may need to resolve application errors in the consumer or scale consumers in order to allow a queue to process messages more efficiently.
You can also use Trace Analytics to monitor a service’s performance after you applied a fix, enabling you to verify that a change is working as expected. For example, you can confirm that increasing the number of consumers for an SQS queue improved request latency over time. You can follow these same steps to resolve similar issues with how and where other AWS services process events. For instance, you might:
- deploy services like Amazon API Gateway and their associated Lambda functions in the same availability zone
- publish Amazon SNS, EventBridge, and S3 events in batches
- modify the batch size and processing window for Amazon Kinesis data streams and SQS queues
- add new partitions to (or re-partition) DynamoDB streams
These simple configuration changes can significantly improve the performance of your serverless applications and reduce costs.
Monitor your serverless workloads and AWS managed services
Datadog provides full visibility into all of the individual components that support a serverless application—from the managed services running event-driven workloads to their associated Lambda functions.
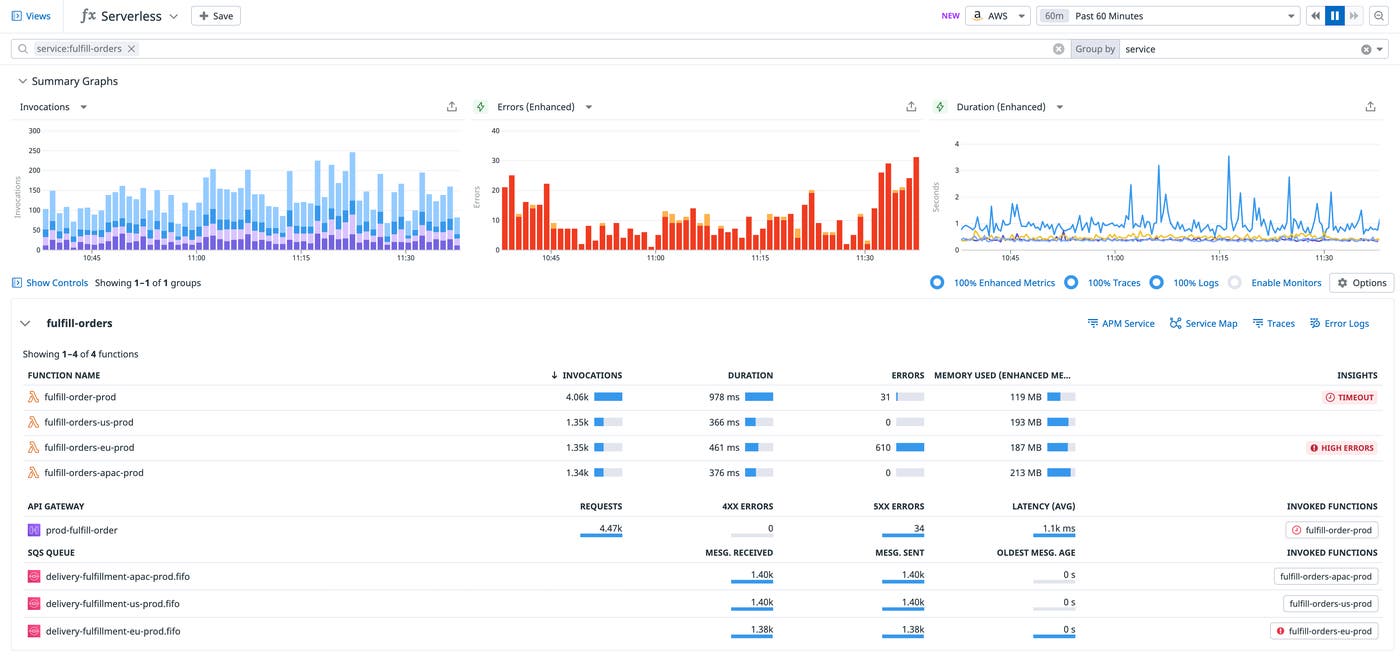
Our new capabilities build on the insights you already get from Datadog APM and native tracing, enabling you to quickly identify the root cause of a performance issue anywhere in your serverless architecture. If you have already set up AWS serverless tracing, you can upgrade your Lambda Library to v52 for Python and v69 for Node.js. Check out our documentation to learn more about our AWS integrations and distributed tracing for serverless applications. If you don’t already have a Datadog account, you can sign up for a free 14-day trial.
