Nicholas Thomson
Technical Content Writer

JD Courtoy
Senior Software Engineer

Brooke Chen
Senior Product Manager
Modern applications running on distributed systems often complicate service ownership because of their ever-growing web of microservice dependencies. This complication challenges engineers' ability to shepherd their software through every stage of the development life cycle, as well as teams' ability to train new engineers on the application's architecture. With increased complexity, clarity is key for quick, effective troubleshooting and delivering value to end users. Datadog's Service Catalog provides a unified, multi-lens view into service ownership, dependencies, performance, reliability, and security posture. This increased visibility helps you improve collaboration during incidents, detect monitoring gaps, and promote observability best practices.
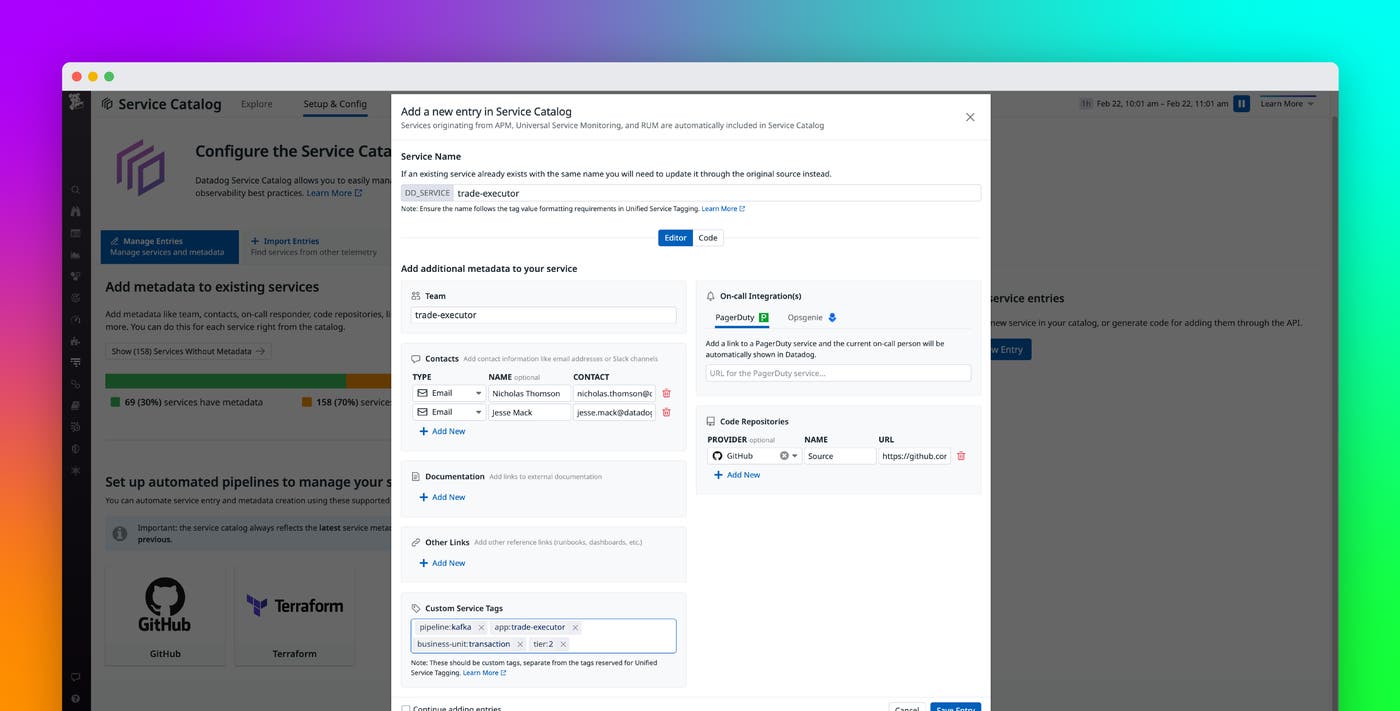
The Service Catalog now has a new setup experience that makes it easier for users to add service metadata without leaving the Datadog application. Users can add service metadata from a number of different places (e.g., GitHub, the Datadog API, Terraform, etc.). The Service Catalog shows you the source of each service's metadata as well as a last updated timestamp, both of which can help you audit changes made to the Service Catalog and avoid unintended updates.
In this post, we'll show you how to:
Create a new service in the updated UI
Say you're an engineer on a stock trading application and your team has developed a new trade executor service that facilitates the sale and purchase of stocks while adhering to a strict latency SLA. The service is not yet monitored by Datadog and not sending any form of telemetry to any Datadog service, such as APM, USM, RUM, or Log Management. You want to tag the trade executor service with metadata—such as team members assigned to the service, points of contact, documentation, PagerDuty on-call information, code repositories, and custom tags—to help you maintain clearly defined ownership while monitoring its performance, reliability, and security.
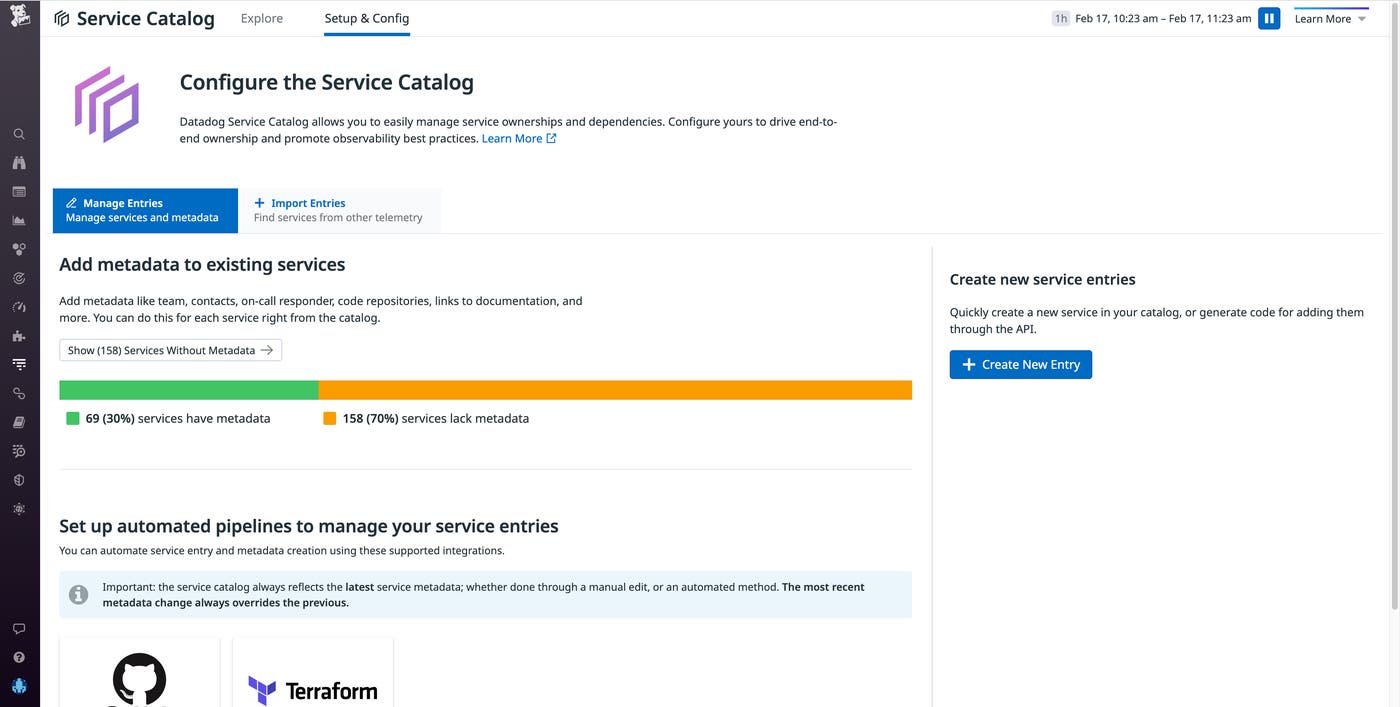
First, you navigate to the Service Catalog setup page and click on the Create New Entry button. This will open a modal to help you add a new service to the Service Catalog or edit an existing one.
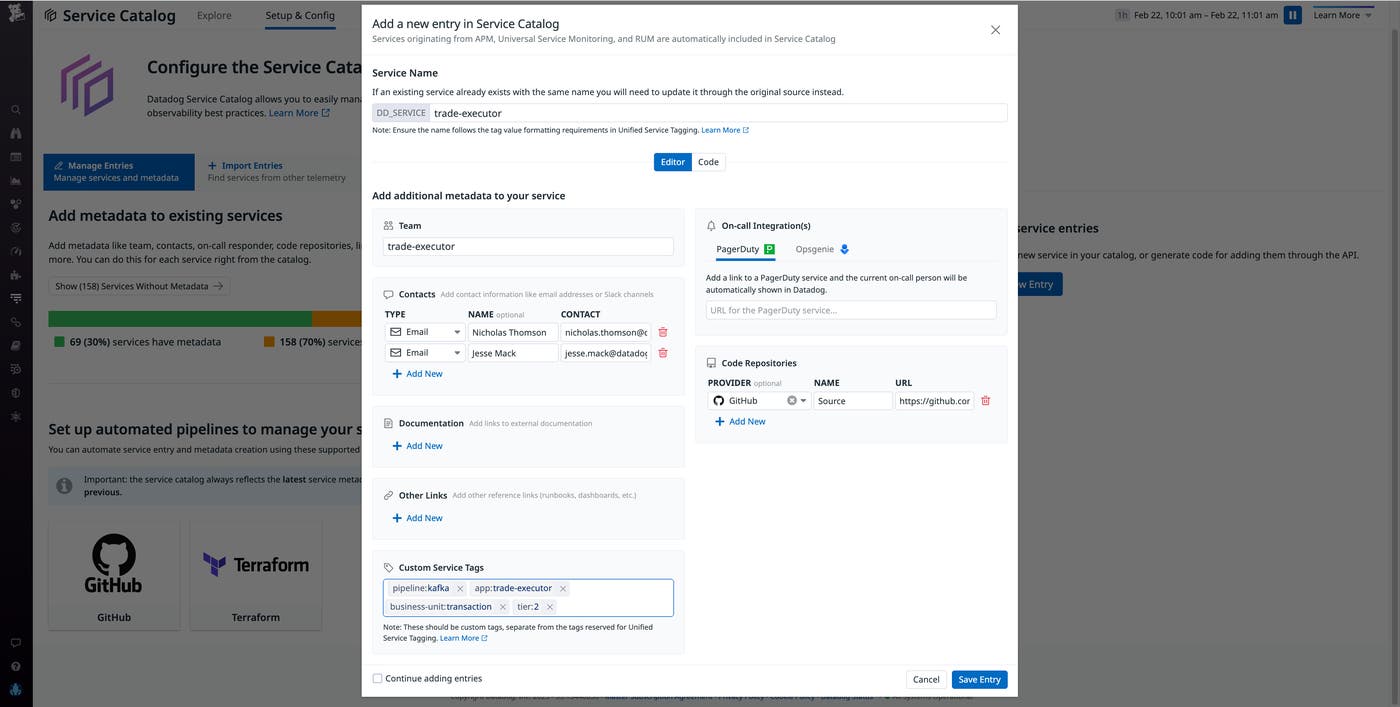
As in the example above, you give the service the name trade-executor, assign it to the trade-executor team in charge of this service, and add custom tags, such as pipeline:kafka, app:trade-executor, business-unit:transaction, and tier:2. These custom service tags will help you monitor the performance of your trade-executor service and alert you to issues it may be causing in your Kafka pipelines or problems with the service that may be impacting other areas of the application. When adding metadata to a new service entry, you should be sure not to use any reserved tag keys.
The new setup experience makes it easy to add uninstrumented custom services along with their metadata to your unified observability platform. This gives you even more coverage and visibility into your systems and simplifies engineer onboarding, which in turn eases the operations load on more experienced engineers so they can focus on more complex issues.
Leverage auto-generated code to make metadata simpler to manage
If some of your team members are not familiar with the structure of the Service Catalog's JSON schema, you may want to create a template for all of your teams to start adding metadata for the services they own. The Service Catalog also enables you to generate a new service definition file by creating the service object in JSON. Simply toggle to the Code option on the modal that pops up when you select Create a New Entry from the Service Catalog setup page.
For example, say you want to register a library that handles network I/O.
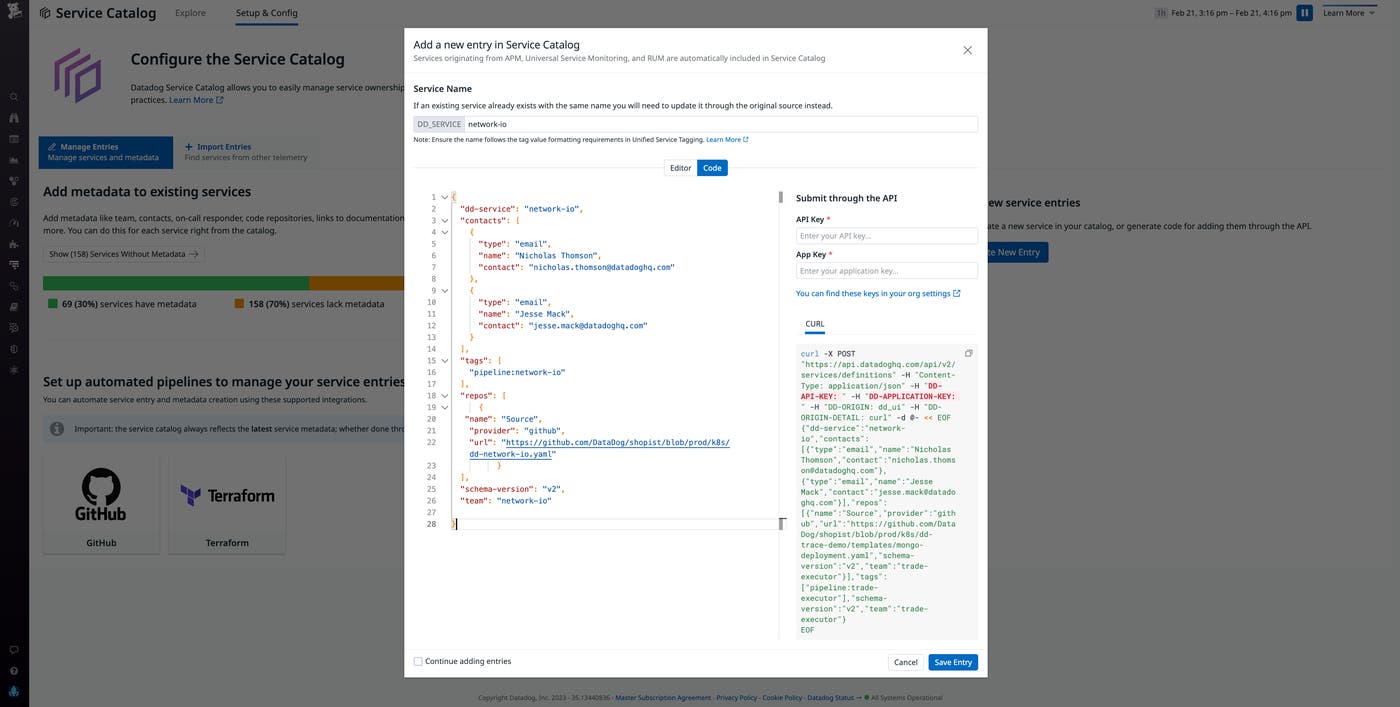
All the information you input into the service editor UI fields have automatically populated JSON code, such as contacts, tags, and the repository hosting the library. This allows you to submit a new service through the Datadog API, once you've input your API key and app key. On the right-hand side of the modal, this code has been entered into a copyable cURL command, which you can execute from the command line if you'd like to create a service that way.
The WRITE permission is managed through role-based access control (RBAC) and limited to the Datadog Admin Role and the Datadog Standard Role by default. The specific permission is Service Catalog Write, which can be found in your personal profile page. Limiting WRITE permissions helps teams keep tighter control over who can create service entries.
Additionally, Datadog's GitHub integration enables the Service Catalog to automatically crawl all linked GitHub repos and populate the UI with service definition files. This helps automate the management of your service metadata, taking some manual tasks off your engineers and reducing chances for error.
Monitor the latest updates to avoid unintended changes
The new Service Catalog experience also allows you to track the source of each service's metadata, whether that is GitHub, the Datadog API, Terraform, or another source. This enables platform engineers and SREs to make sure there haven't been any accidental or unintended updates.
For example, say your team has a policy of managing metadata via Terraform and you notice a service with a different metadata source.
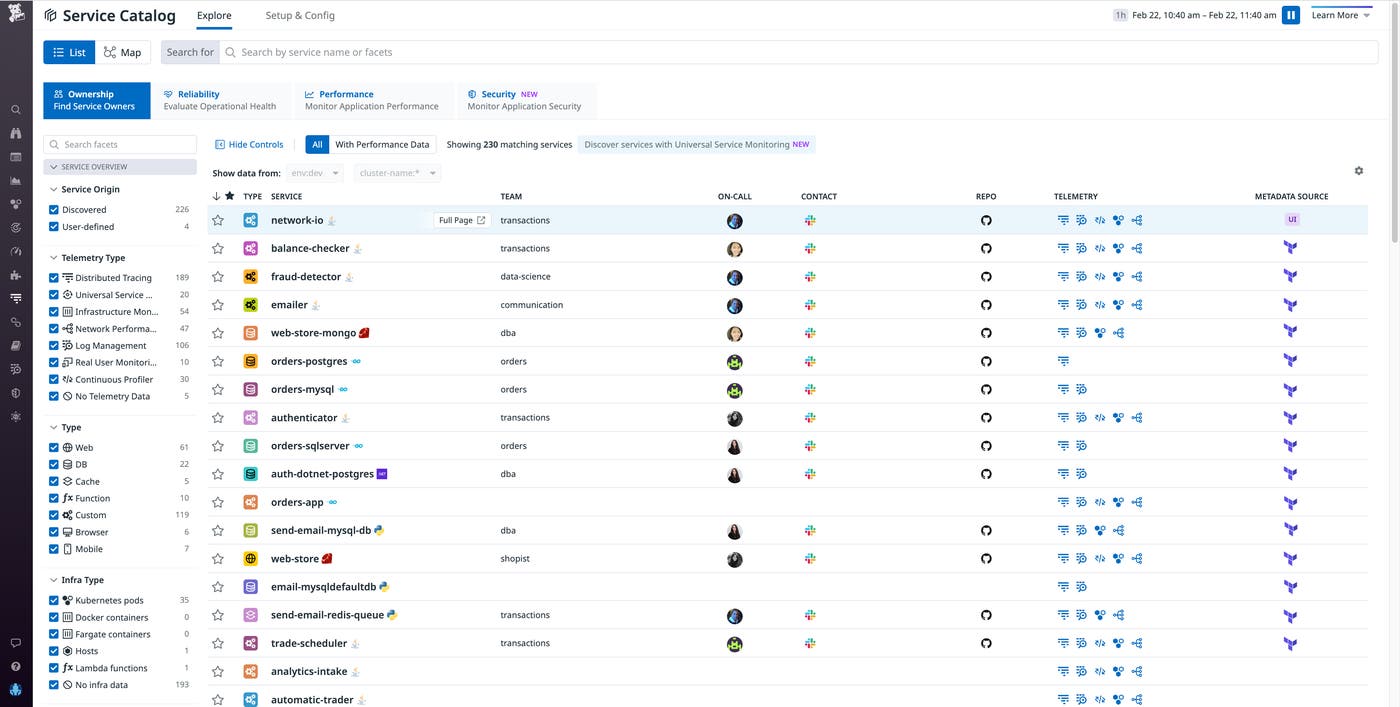
As in the example above, the metadata source for a newly created network-io service is UI, unlike the rest of your services, whose source is Terraform. Seeing a UI edit record is alarming and something the SRE team probably wants to dig into, as it could indicate an incorrect service entry was created.
Mousing over the metadata source will show you when the last update to the metadata was made.
From here, you click on the service and identify the team member who made the update. You reach out to them and discover that the team member accidentally deployed the service update to production instead of the testing environment. With this knowledge in hand, you roll back the update.
Eliminate knowledge silos with the new Service Catalog setup
The new Service Catalog setup experience makes managing your service metadata easier than ever. These UI updates make it simpler to add metadata to existing services, add services that are not yet monitored by Datadog, tag them appropriately, and root out any unintended updates. With a simpler way to manage metadata, you can reduce knowledge silos in your engineering team, get new team members trained on how to add services faster, and promote better visibility across teams who own different services.
If you’re new to Datadog, sign up for a 14-day free trial and see firsthand how you can take advantage of the increased visibility offered by the Service Catalog. Get started with the new setup experience today.
