Prashant Jain

Lutao Xie
OpenTelemetry is an open source set of tools and standards that provide visibility into cloud-native applications. OpenTelemetry allows you to collect metrics, traces, and logs from applications written in many languages and export them to a backend of your choice.
Datadog is committed to OpenTelemetry, and we're continuing to provide ways for users to maximize the visibility OpenTelemetry provides. Our Datadog Exporter already lets you collect traces and metrics from OpenTelemetry. Now, we're excited to announce that you can use it to forward logs to Datadog for deep insight into the usage, performance, and security of your application. Datadog will also automatically correlate logs and traces from the OpenTelemetry Collector so that you can better understand your application's behavior, speed up troubleshooting, and optimize user experience.
In this post, we will show you how you can collect logs with the OpenTelemetry Collector and export them to Datadog for further monitoring and correlate your logs with OpenTelemetry traces to gain context and accelerate troubleshooting.
Send logs to Datadog with the Datadog Exporter
The Collector is the OpenTelemetry component that receives and processes your telemetry data and then forwards it to a backend you specify. You define the Collector's behavior by creating a pipeline—a collection of receivers, processors, and exporters. The diagram below illustrates a Collector configuration that uses the filelog receiver to tail log files and the Datadog Exporter to send the logs to Datadog.

The code snippet below shows the configuration for the example pipeline. The receivers section configures the filelog receiver, including the log file to be tailed and the JSON parsing rules that extract the logs' timestamps and severity values. (If your logs are not JSON-formatted, you can use regex parsing rules to extract the data instead.) The exporters and processors sections use the basic configuration shown in the Datadog documentation. Finally, the pipelines section brings together all of these components to define the logs pipeline.
receivers: filelog: include: [ /var/log/myservice/log.json ] operators: - type: json_parser timestamp: parse_from: attributes.time layout: '%Y-%m-%d %H:%M:%S' severity: parse_from: body.severity_field
exporters: datadog: api: site: datadoghq.com key: ${DD_API_KEY}
processors: batch: # Datadog APM Intake limit is 3.2MB. Let's make sure the batches do not # go over that. send_batch_max_size: 1000 send_batch_size: 100 timeout: 10s
service: pipelines: logs: receivers: [filelog] processors: [batch] exporters: [datadog]Once you've imported your logs into Datadog, you can explore them in the Log Explorer and automatically monitor them to detect trends and anomalies. And you can correlate your logs to traces and metrics in Datadog to quickly gain deep insight into the health and performance of your application and infrastructure.
Seamlessly correlate traces and logs for fast troubleshooting
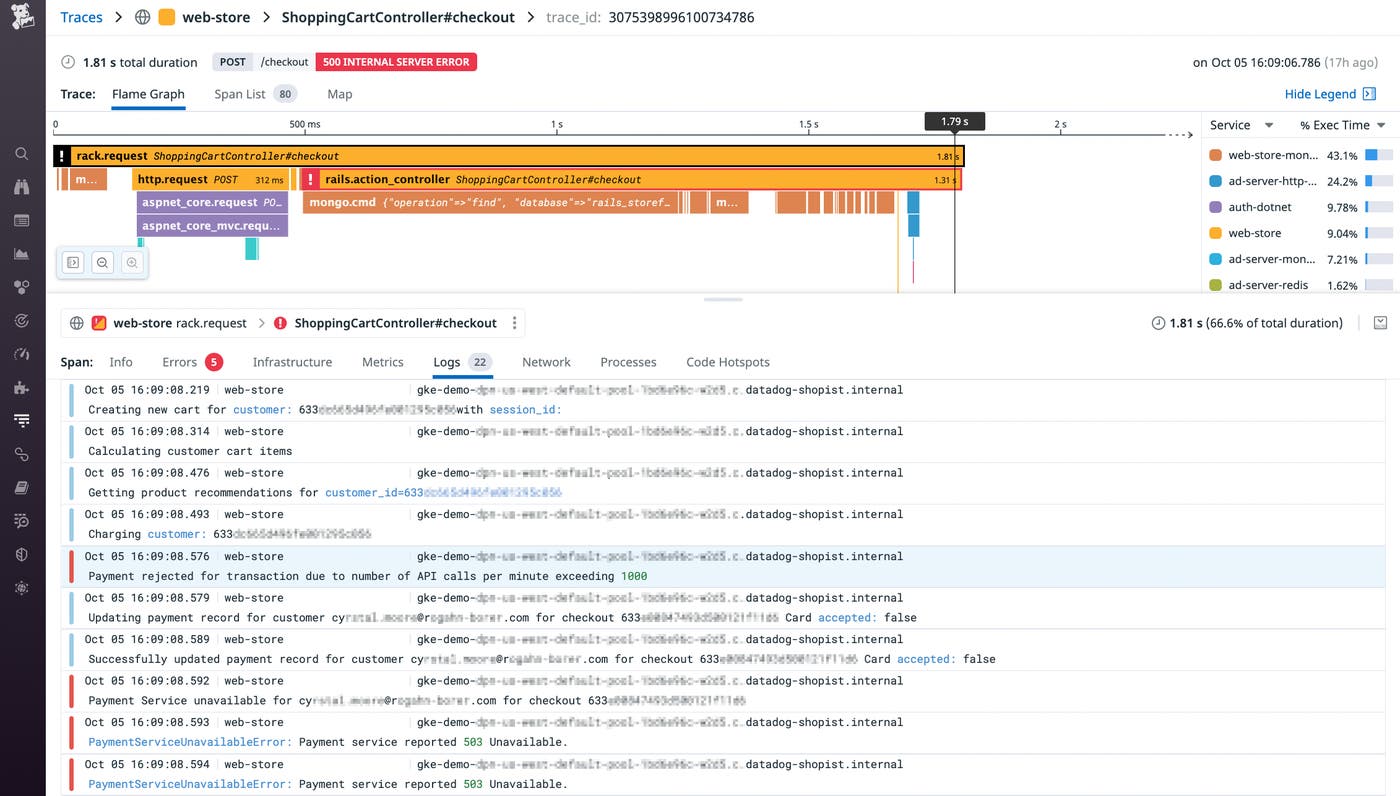
If you're already using the Datadog Exporter to send OpenTelemetry metrics and traces to Datadog, you can now correlate those traces with logs. Once you've configured the Collector to use the trace_parser operator, the operator can extract the trace_id from each trace and add it to the associated logs. Datadog automatically ties together all of your OpenTelemetry data, so you'll see related logs for each trace you view.
The flame graph in the screenshot below shows that a call to the checkout endpoint has resulted in an error, and the Logs tab displays a related log. The logs complement the trace data—in this case explaining that the request was rejected due to a rate limiting error—to provide context and details around each request so you can troubleshoot faster.

Automatic correlation of your OpenTelemetry data works in both directions; you'll see correlated data in both the Trace View and the Log Explorer to speed up your troubleshooting, whichever path you take. If you start investigating the error shown above from within the Log Explorer, you'll see the related flame graph that visualizes the requests leading up to the failed call to the checkout endpoint. Then you can click any span in the flame graph to dig into APM data about the performance of the services involved in the request.
Deploy the Datadog Exporter to forward logs from the OpenTelemetry Collector
In addition to metrics and traces, the Datadog Exporter now allows you to send logs from the OpenTelemetry Collector to Datadog for monitoring and analysis. And by automatically correlating the traces and logs from the Collector, Datadog lets you visualize request activity in your application and immediately see the logs that explain its performance. These changes to the Datadog Exporter are currently in alpha. See our documentation for more information on using the Datadog Exporter to send logs to Datadog and on collecting traces and metrics via the Collector or the Datadog Agent. If you're not already using Datadog, you can start today with a 14-day free trial.

