Micah Kim

Gillian McGarvey

Nolan Hayes
In Microsoft-based environments, Windows event logs capture critical security events like user logins, privilege escalations, and system changes. These logs are vital for compliance and investigations. However, they’re natively formatted in XML, a verbose and deeply nested structure that is hard to search without preprocessing and inefficient to store.
XML is present not only in Windows and Azure infrastructure; legacy systems in financial services, logistics, and transportation still rely on XML for structured data exchange. Across technologies such as service-oriented architecture (SOA) travel booking platforms, transaction systems, and supply-chain tools, many teams today face the frustrating problem of analyzing and storing XML logs.
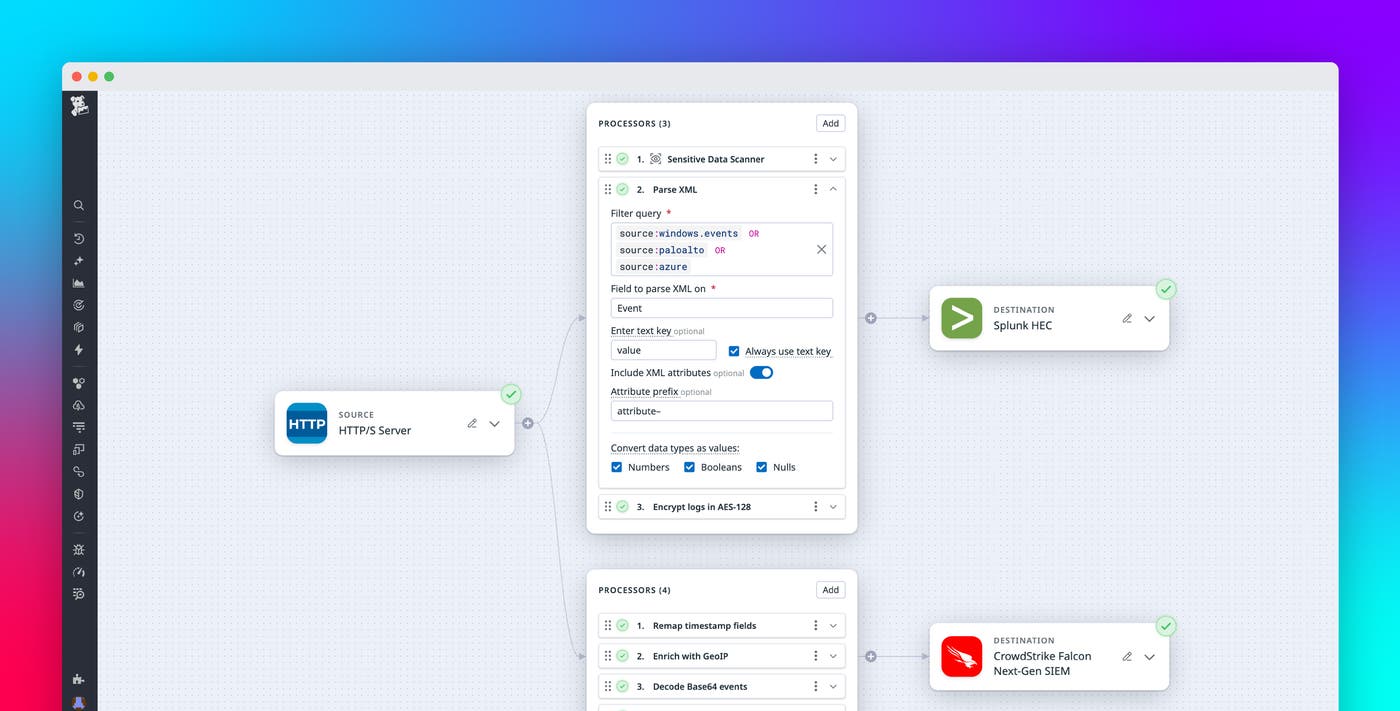
Datadog Observability Pipelines now supports a Parse XML processor that enables you to convert XML logs—such as Windows events, Azure audit logs, and legacy application logs—into structured JSON before sending them to downstream tools. This capability helps teams reduce log volumes, route high-priority events more effectively, and improve visibility into security-relevant activity. In this post, we’ll describe how the XML parser enables you to manage Windows event logs at scale by automatically transforming verbose XML into actionable data.
Manage XML logs at scale
Analyzing and storing XML logs at scale have long been challenges for DevOps and security teams. XML logs’ deeply nested format, while precise, contributes to increased costs due to the size of the logs and the difficulty in extracting actionable insights from them. This is especially true in large Windows or Azure environments with sprawling infrastructure, legacy logging setups, or security tools like those from Palo Alto Networks that emit logs in XML.
To help you better understand XML logs, the following table contains some key terms to note:
| Term | Description | Example |
|---|---|---|
| Tag | Representation of a hierarchical element | <Event>, <System>, <Data> |
| Attribute | Metadata attached to a tag | Name="LogonType"Example in a tag: <Data Name="LogonType"> |
| Value | Content inside a tag | 2, JohnDoeExample in a tag: <Data Name="LogonType">2</Data> |
| Key or field | Identifier typically formed by combining tag names and attributes | EventID, SubjectUserName |
For example, let’s say that you’re a security engineer for a large travel booking platform and you’re reviewing failed login attempts for legacy infrastructure. Typically, you’d need to sift through raw XML logs to extract key details like username, timestamp, and failure reason. The following is an example of a Windows 4625 event for a failed login attempt:
<Event xmlns="http://schemas.microsoft.com/win/2004/08/events/event"> <System> <Provider Name="Microsoft-Windows-Security-Auditing" Guid="{54849625-5478-4994-A5BA-3E3B0328C30D}" /> <EventID>4625</EventID> <Version>0</Version> <Level>0</Level> <Task>12546</Task> <Opcode>0</Opcode> <Keywords>0x8010000000000000</Keywords> <TimeCreated SystemTime="2015-09-08T22:54:54.962511700Z" /> <EventRecordID>229977</EventRecordID> <Correlation /> <Execution ProcessID="516" ThreadID="3240" /> <Channel>Security</Channel> <Computer>DC01.contoso.local</Computer> <Security /> </System> <EventData> <Data Name="SubjectUserSid">S-1-5-18</Data> <Data Name="SubjectUserName">DC01$</Data> <Data Name="SubjectDomainName">CONTOSO</Data> <Data Name="SubjectLogonId">0x3e7</Data> <Data Name="TargetUserSid">S-1-0-0</Data> <Data Name="TargetUserName">Auditor</Data> <Data Name="TargetDomainName">CONTOSO</Data> <Data Name="Status">0xc0000234</Data> <Data Name="FailureReason">%%2307</Data> <Data Name="SubStatus">0x0</Data> <Data Name="LogonType">2</Data> <Data Name="LogonProcessName">User32</Data> <Data Name="AuthenticationPackageName">Negotiate</Data> <Data Name="WorkstationName">DC01</Data> <Data Name="TransmittedServices">-</Data> <Data Name="LmPackageName">-</Data> <Data Name="KeyLength">0</Data> <Data Name="ProcessId">0x1bc</Data> <Data Name="ProcessName">C:\\Windows\\System32\\winlogon.exe</Data> <Data Name="IpAddress">127.0.0.1</Data> <Data Name="IpPort">0</Data> </EventData></Event>With the XML parser in Observability Pipelines, the review process becomes automated and scalable. You can parse the XML into JSON to easily filter and manipulate logs based on structured attributes—such as FailureReason, Status, and ProcessId—before ingestion. Additionally, these logs can be enriched with relevant tags and metadata, enhancing correlation across observability and security tools. By flattening verbose XML data, you can significantly reduce ingestion volume and its associated costs.
Transform verbose XML into actionable data
Finding value in raw XML logs is notoriously hard, yet the logs often contain high-value signals that aid in threat detection and incident response. With Observability Pipelines’ XML processor, DevOps and security teams can convert those complex logs into structured data that is composed of key-value pairs to simplify search, analysis, and action.
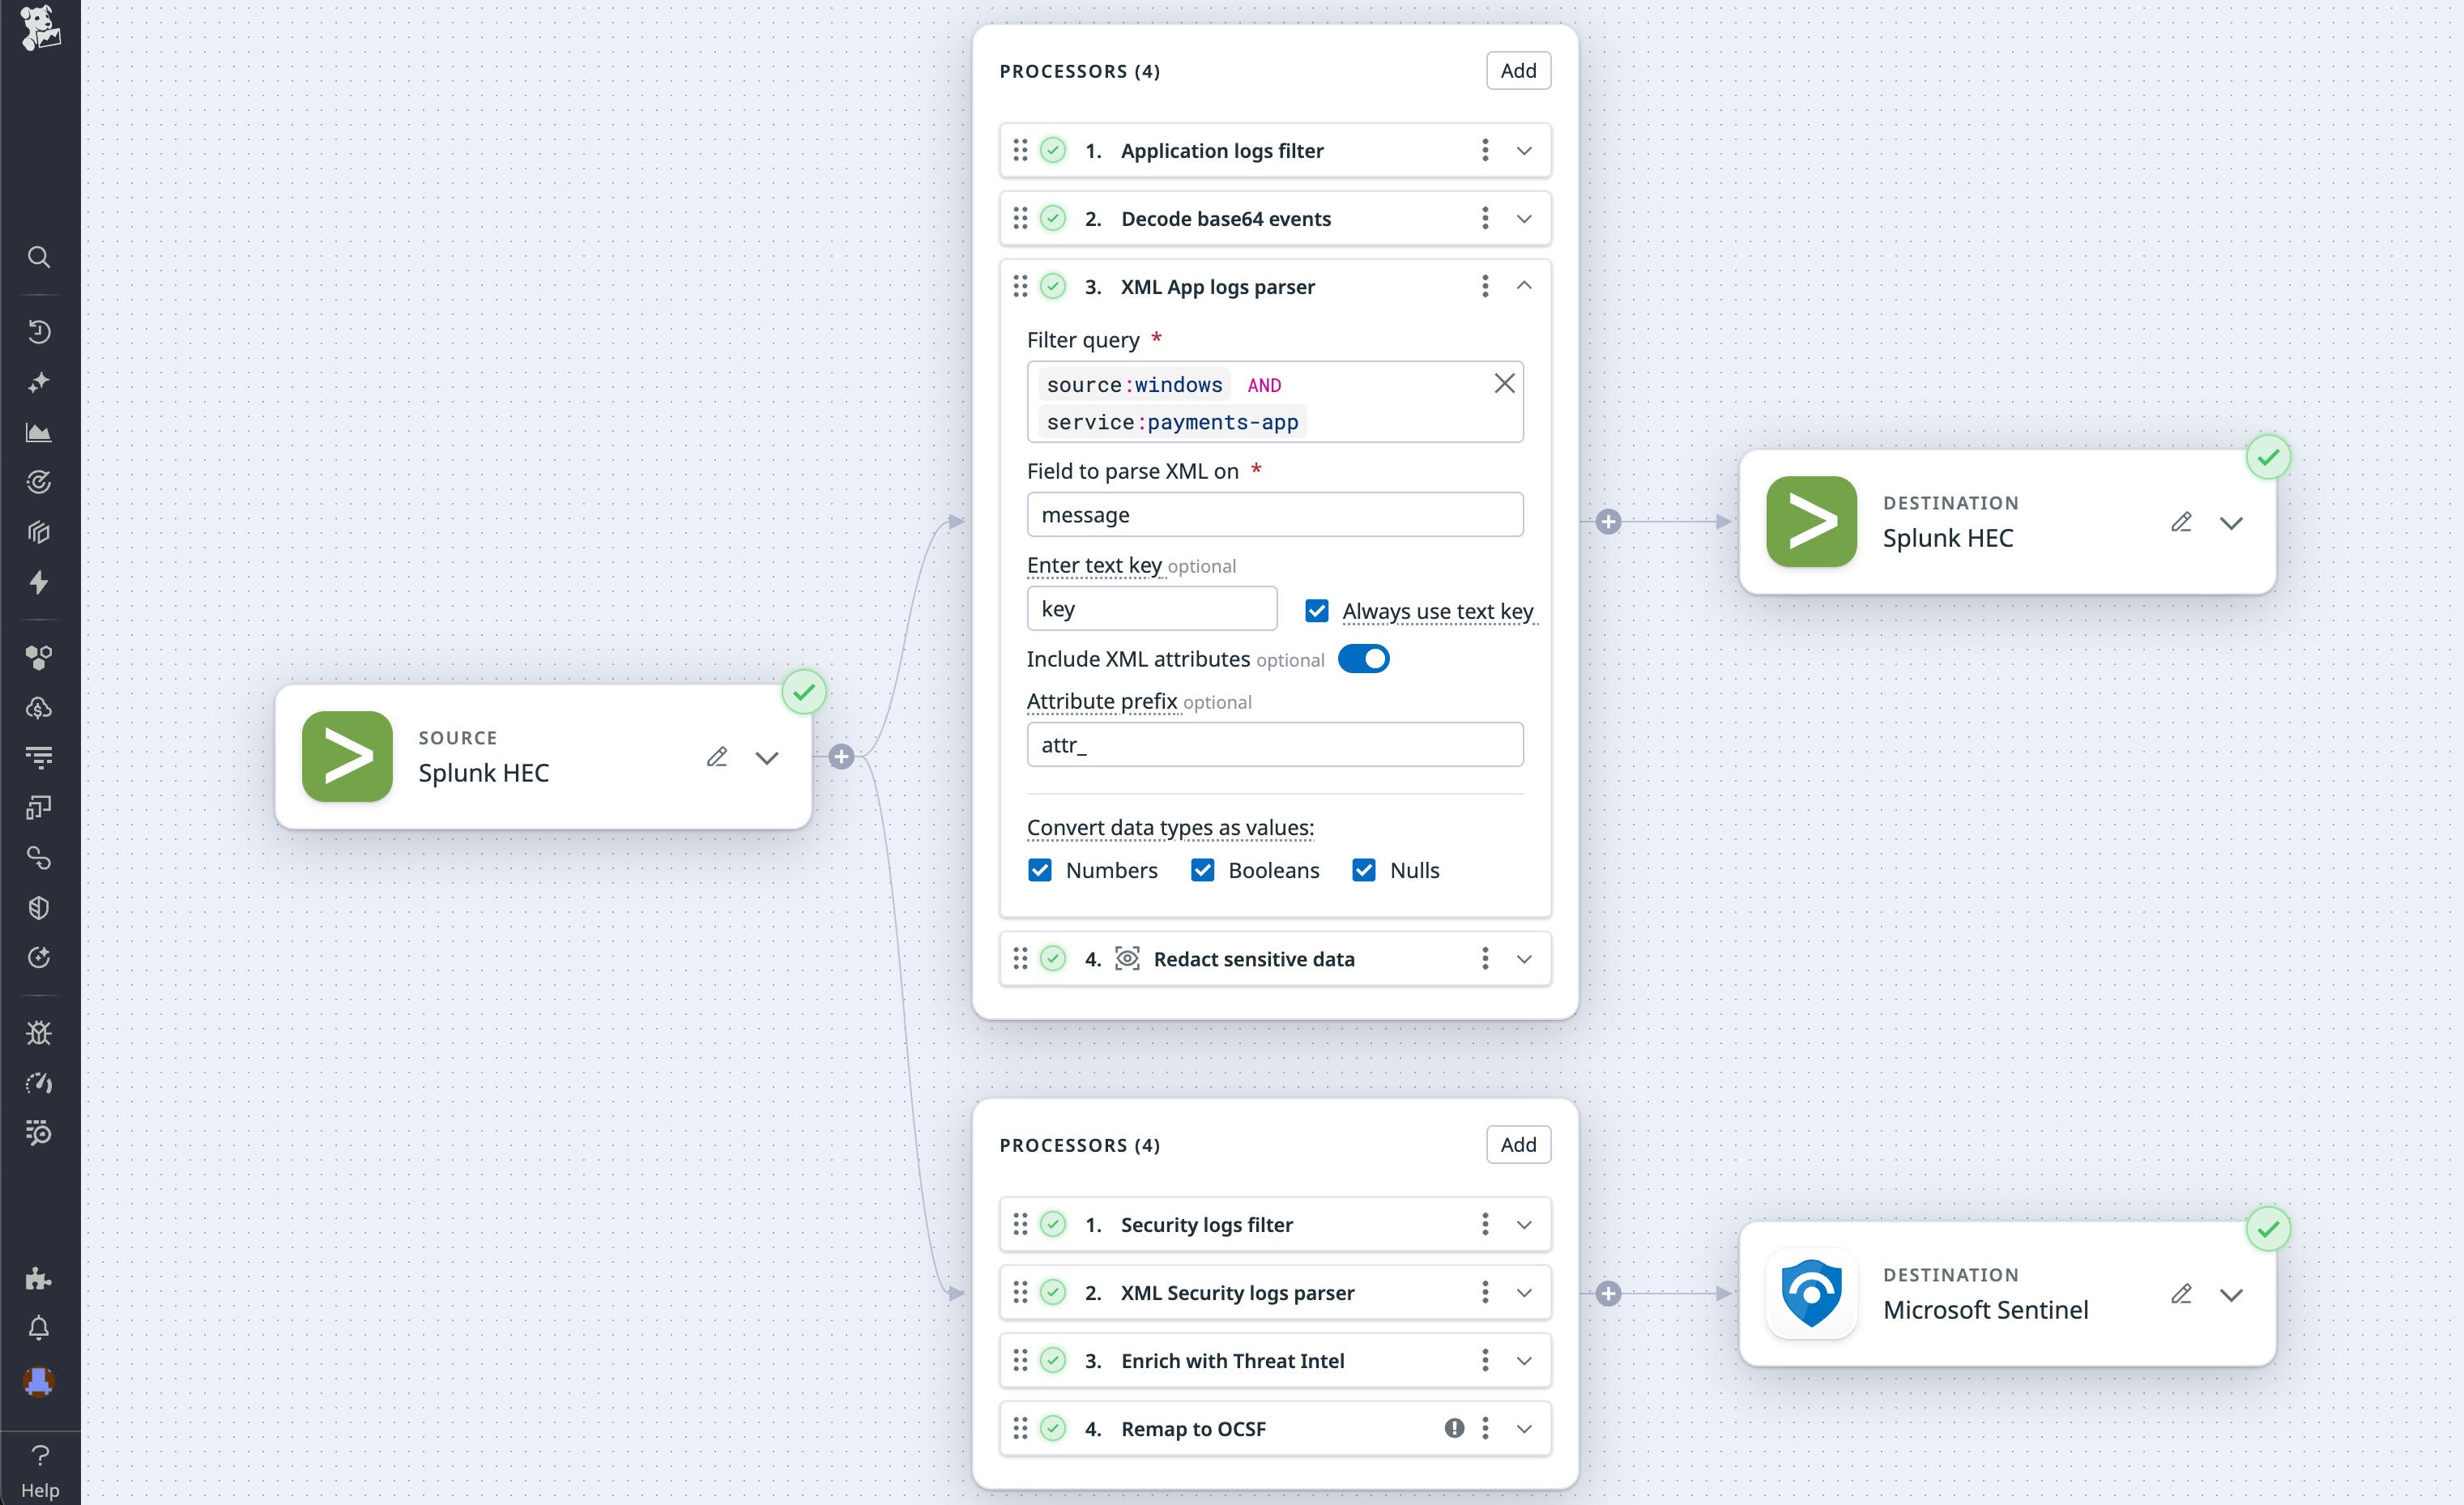
Let’s say that you work as a security engineer for a large financial enterprise that analyzes payment and transaction logs. Core banking platforms emit logs in XML format for critical workflows like account access, payments, and ACH batch processing. These systems use XML to conform to industry standards such as Nacha Operating Rules and ISO 20022 for auditing and compliance. By parsing the XML, you can now extensibly add fields like environment, branch_id, and user_role for improved correlation and define monitors to alert on repeated failures across those dimensions.
The following image shows an example transformation for the previously mentioned Windows 4625 event. The security log on the left arrived in XML, was parsed by the XML processor, and was transformed to the JSON shown on the right. This parsing achieved a 30% reduction in event size. Further volume reduction is achievable by omitting null values or removing unnecessary fields from the log’s payload.
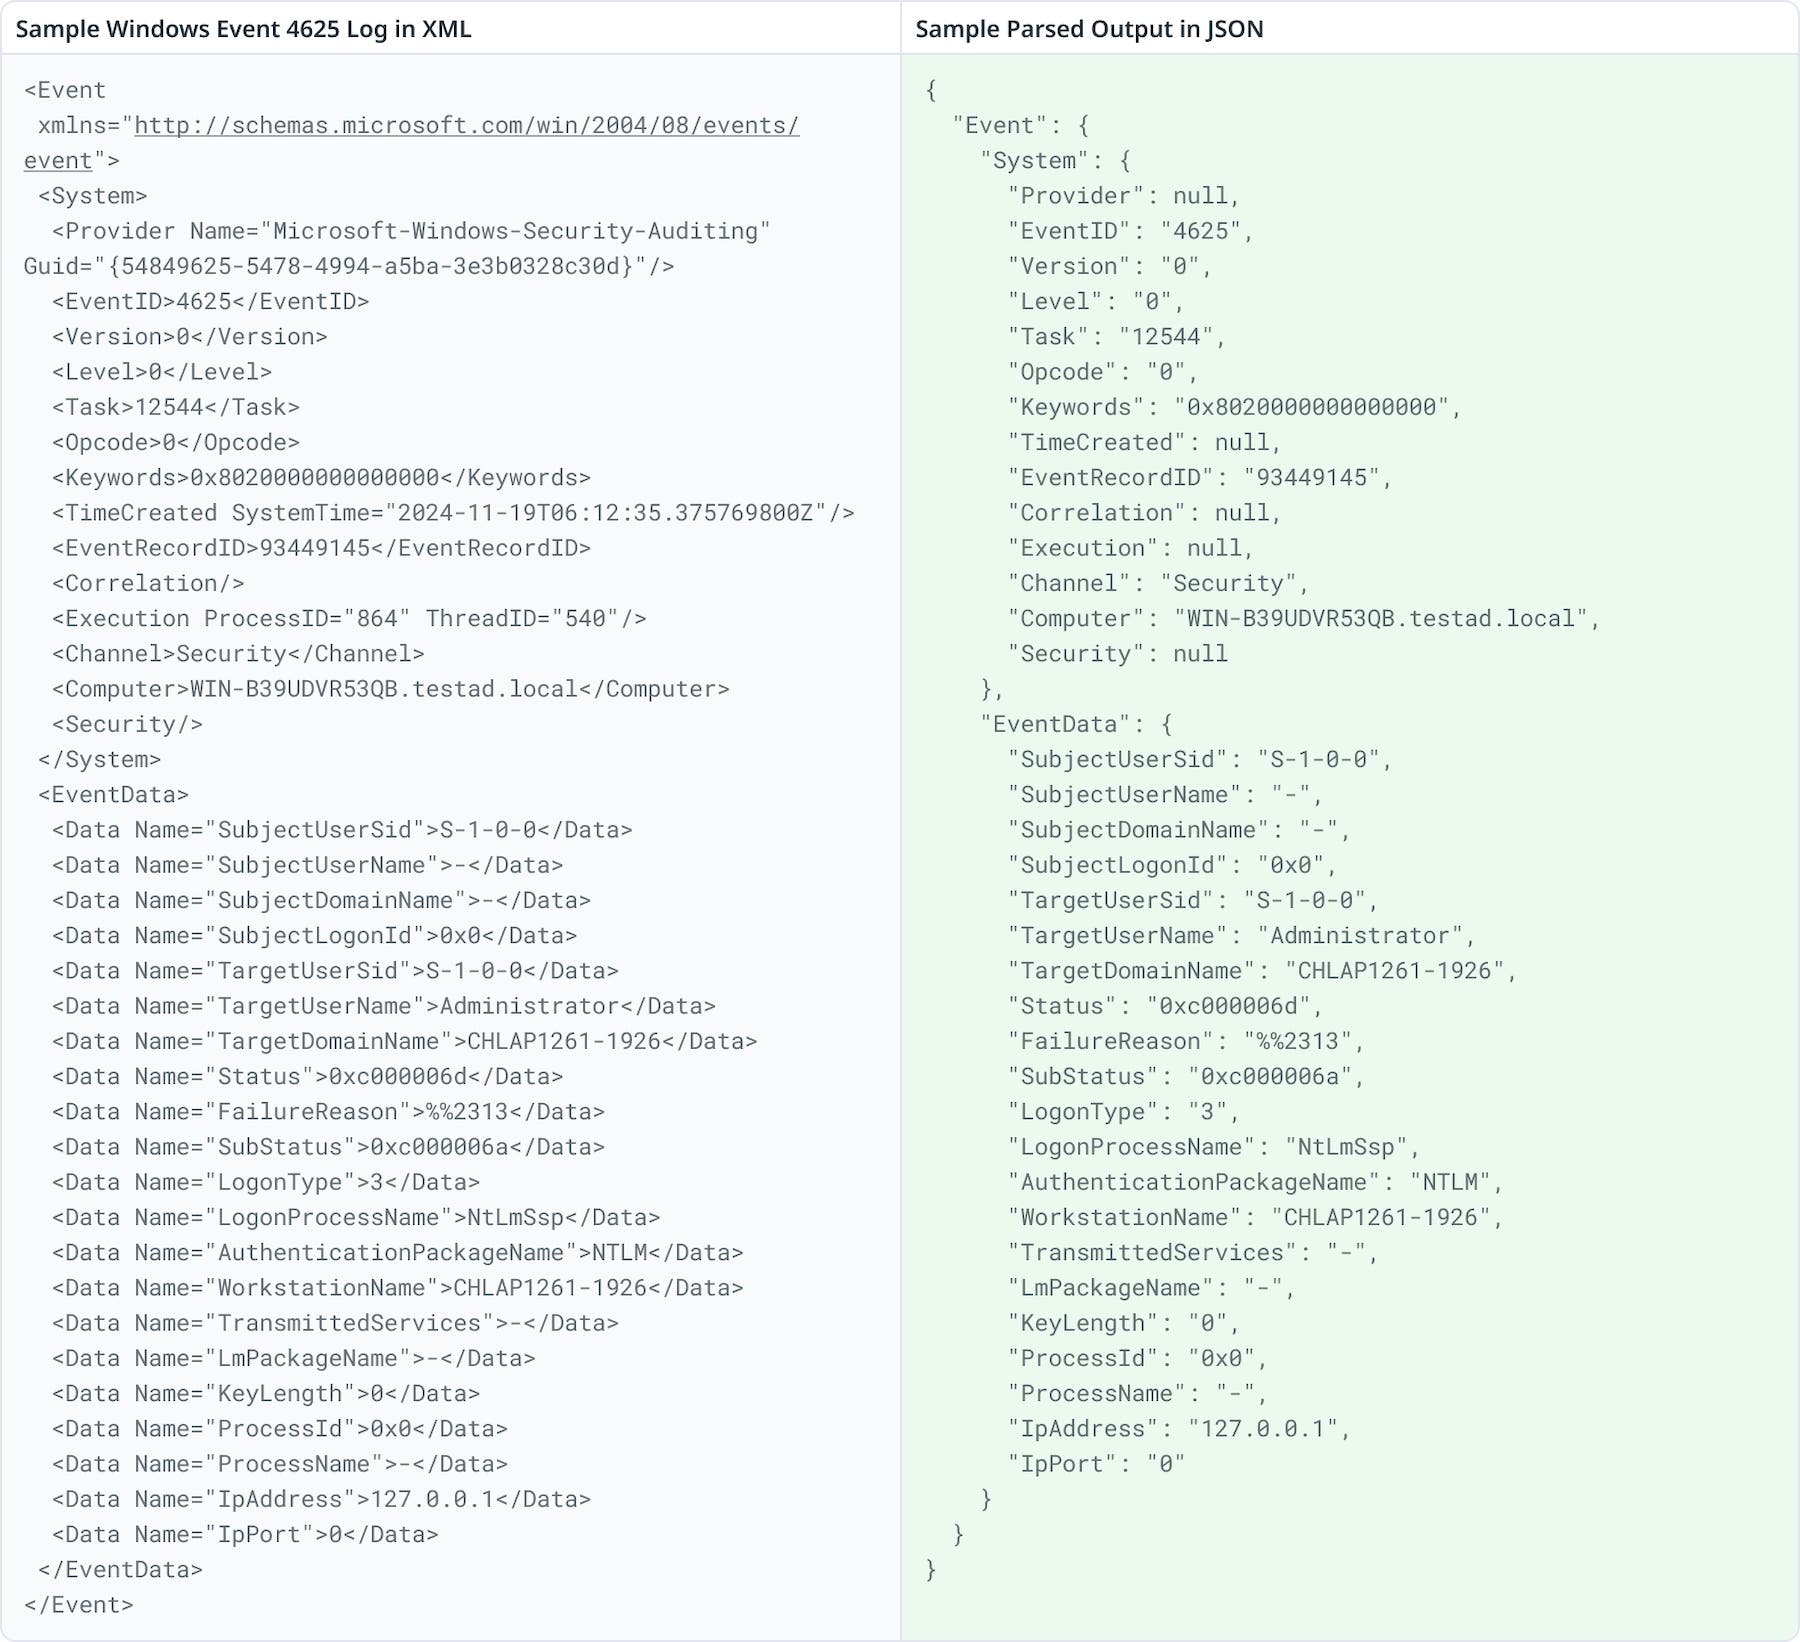
But transforming XML into structured formats is just the start. Using Observability Pipelines’ native OCSF remapping, you can turn Windows security events into an open source schema for improved threat detection across tools such as Amazon Security Lake, SentinelOne, Datadog Cloud SIEM, and more.
Additionally, you can generate metrics from Windows events to help your teams extract insight from the security logs that are being sent. Regarding Windows 4625 events, for example, you can convert logs to metrics at the edge and track the number of failed login attempts. You can group by fields such as TargetUserName, Status, and LogonType in the log to identify which accounts are being attacked, what failure types are occurring, and what attack vectors are involved.
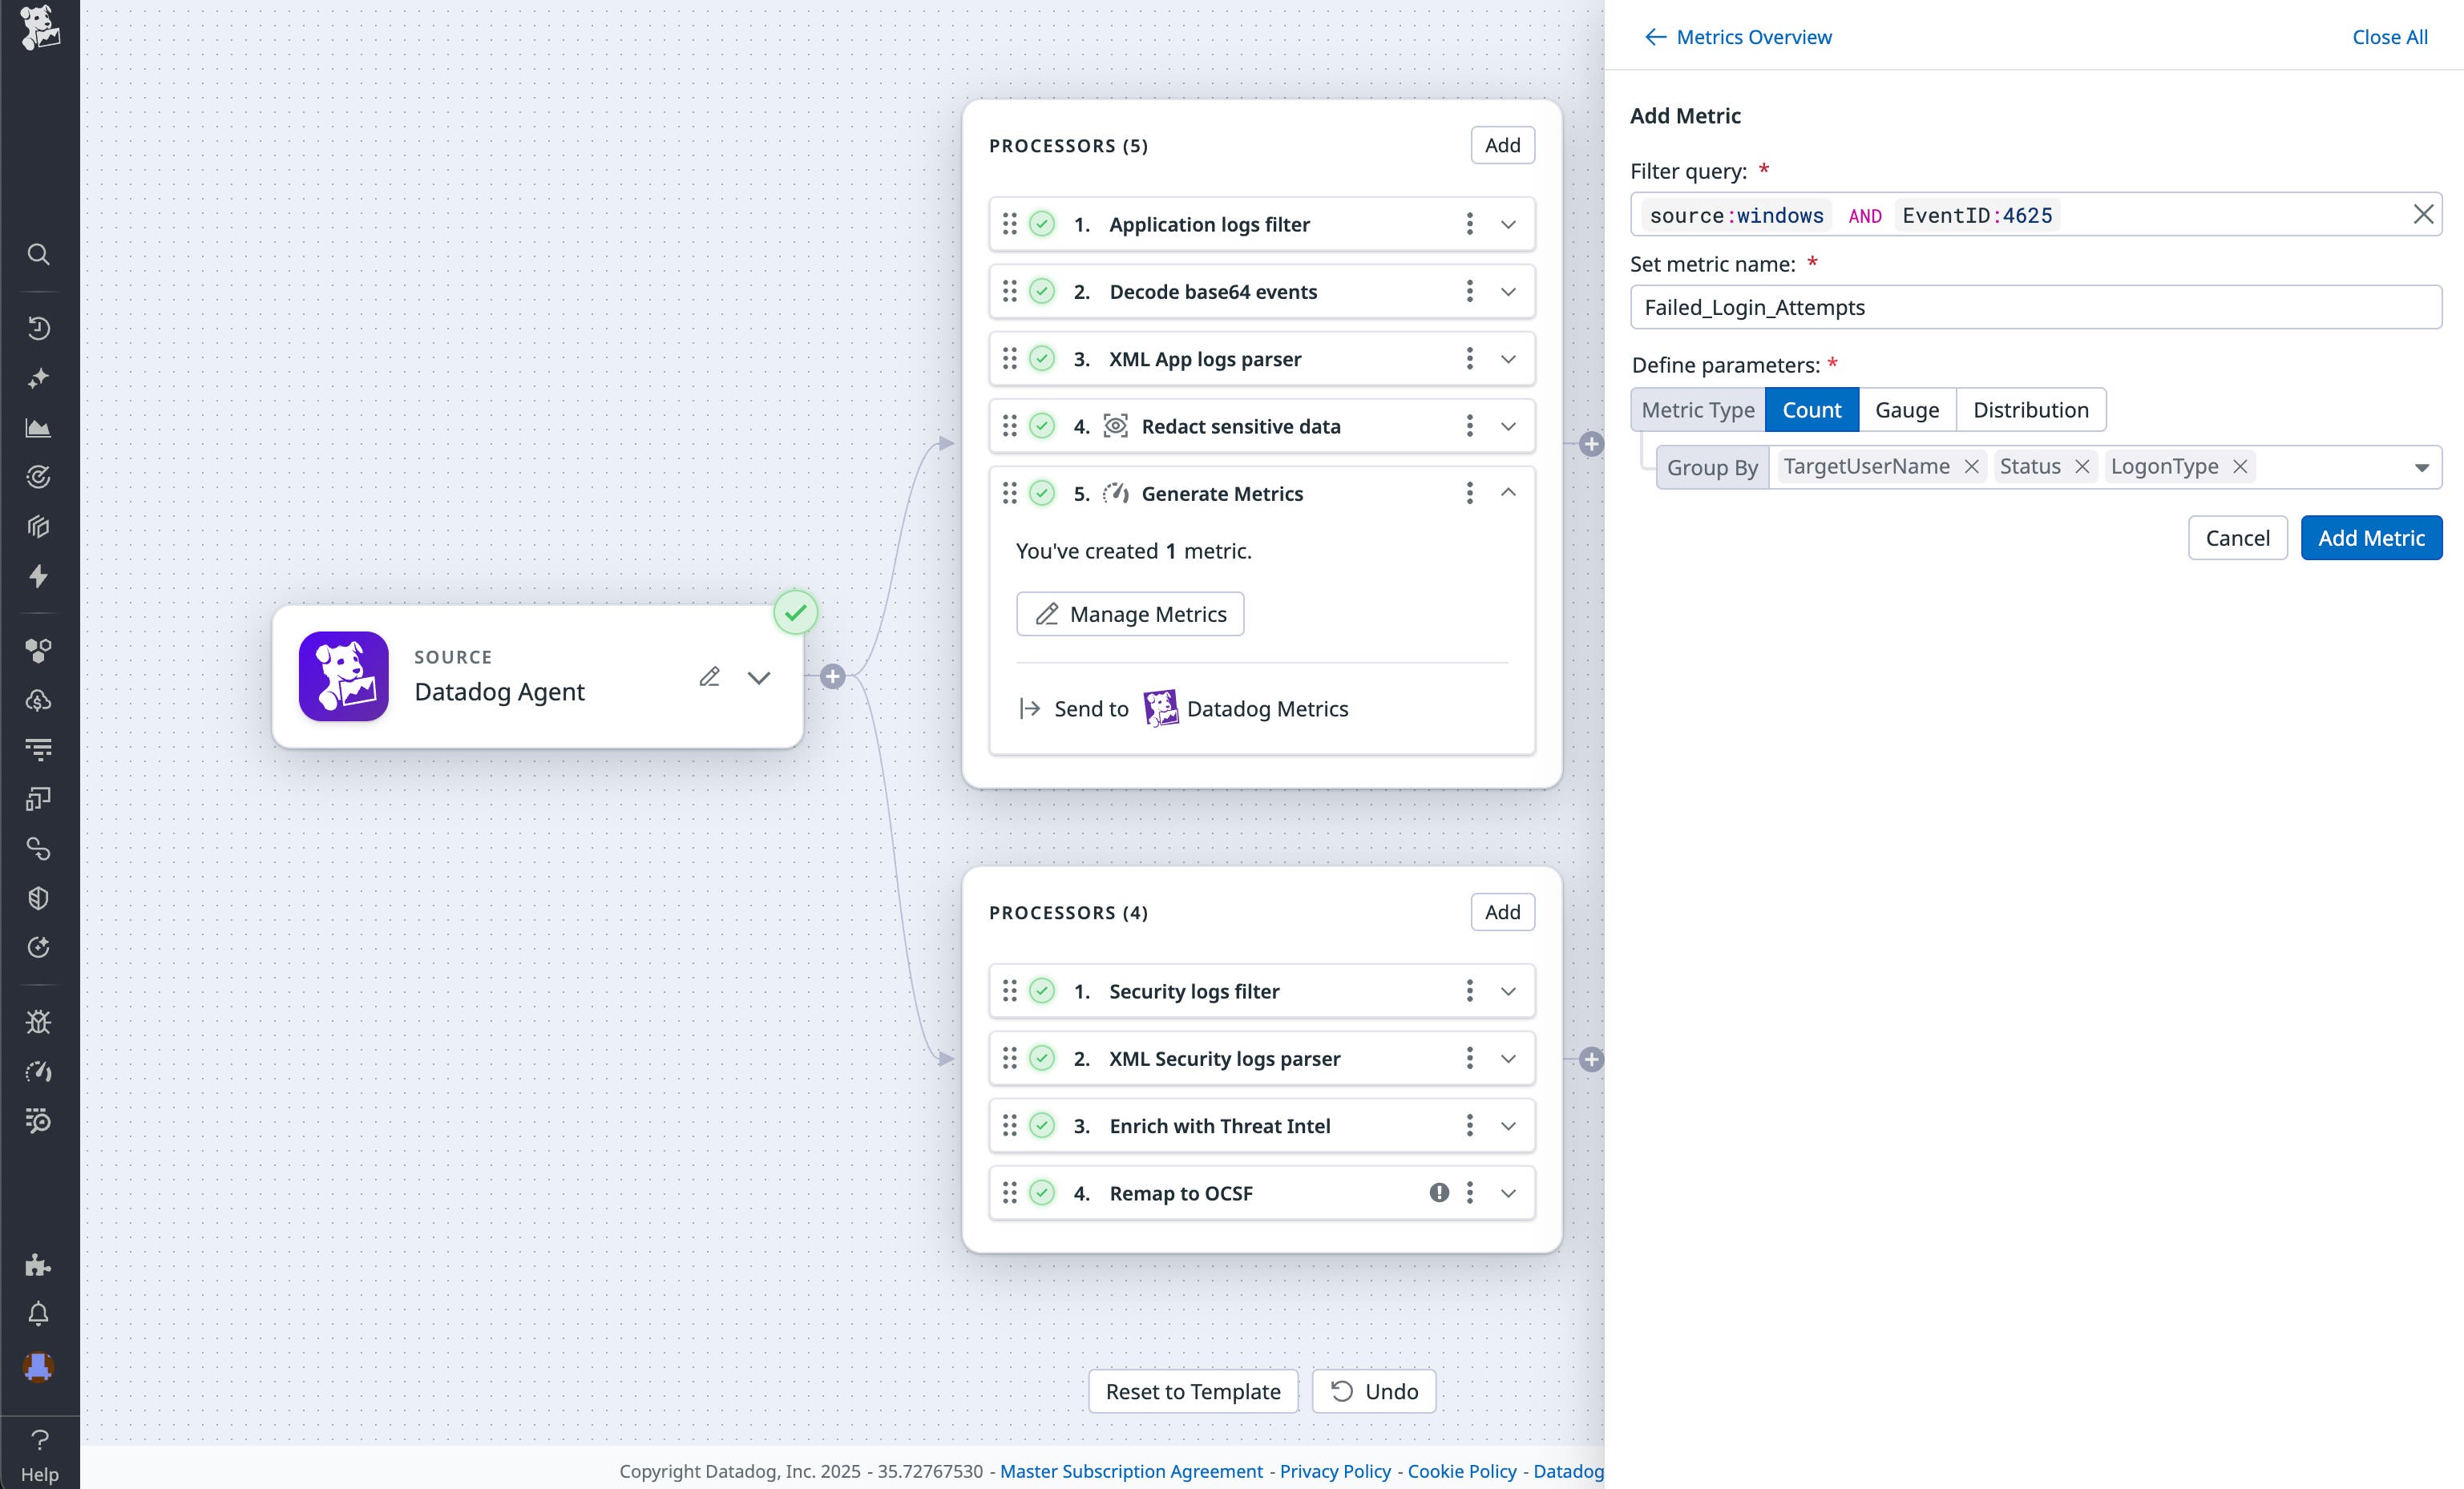
These features help you normalize critical security events into an extensible, open source format and extract meaningful insight from repetitive logs to spot trends and detect threats.
Get started parsing XML logs with Observability Pipelines
To start parsing XML logs by using Datadog Observability Pipelines, configure the Parse XML processor. For more setup details, see the Observability Pipelines documentation. If you’re new to Datadog, you can sign up for a 14-day free trial.
