Jordan Obey

Natalie Altman
As your on-premise network infrastructure grows in size and complexity, monitoring thousands of devices becomes a challenge. Whether you’re monitoring firewalls in a branch office or the routing and switching fabric in your datacenter over which all customer transactions are performed, visibility into all points of your infrastructure is critical for network maintenance. With Datadog’s SNMP integration, you can easily monitor and alert on the health and performance of your on-premise network infrastructure alongside the rest of your stack from one centralized platform.
Simple Network Management Protocol (SNMP) is a protocol that enables administrators to remotely modify settings and view information about network devices—such as routers, switches, or servers—across local and wide-area networks. Data about SNMP-enabled devices, like CPU or errors received can be accessed from an object identifier (OID). OIDs are integer strings that act as addresses which point to device data. The Datadog Agent collects SNMP data from network devices by polling OIDs, and submitting the responses as metrics. These metrics are then available for visualization, correlation, and alerting across the Datadog platform so you can easily trace the root cause of the issue.

Monitoring network devices alongside the rest of your infrastructure can help break down organization-wide silos that make it difficult to troubleshoot hardware-to-application layer issues. For instance, high network latency could be due to the CPU of several interfaces running too hot, or because of application layer service errors prohibiting the flow of data from one application to the next. With Datadog, you can monitor across all the components of your network so you can break down silos, and get to the root cause of issues quickly.
Detect all of your network devices automatically
After configuring Datadog’s SNMP integration check with a provided subnet (or set of subnets), the Datadog Agent will scan that subnet and discover all SNMP-enabled network devices. The Agent identifies these devices by their system object identifier (sysOID) and uses them to map devices to corresponding device-specific profiles. Device profiles are Datadog’s opinionated view of which metrics should be collected for each network device, like the number of errors per interface for a Cisco Nexus datacenter switch. In addition to device-specific profiles, Datadog provides common metrics from any device type independent of the manufacturer. You can find a complete list of all the profiles Datadog supports in our repository.
Monitor network devices with SNMP metrics
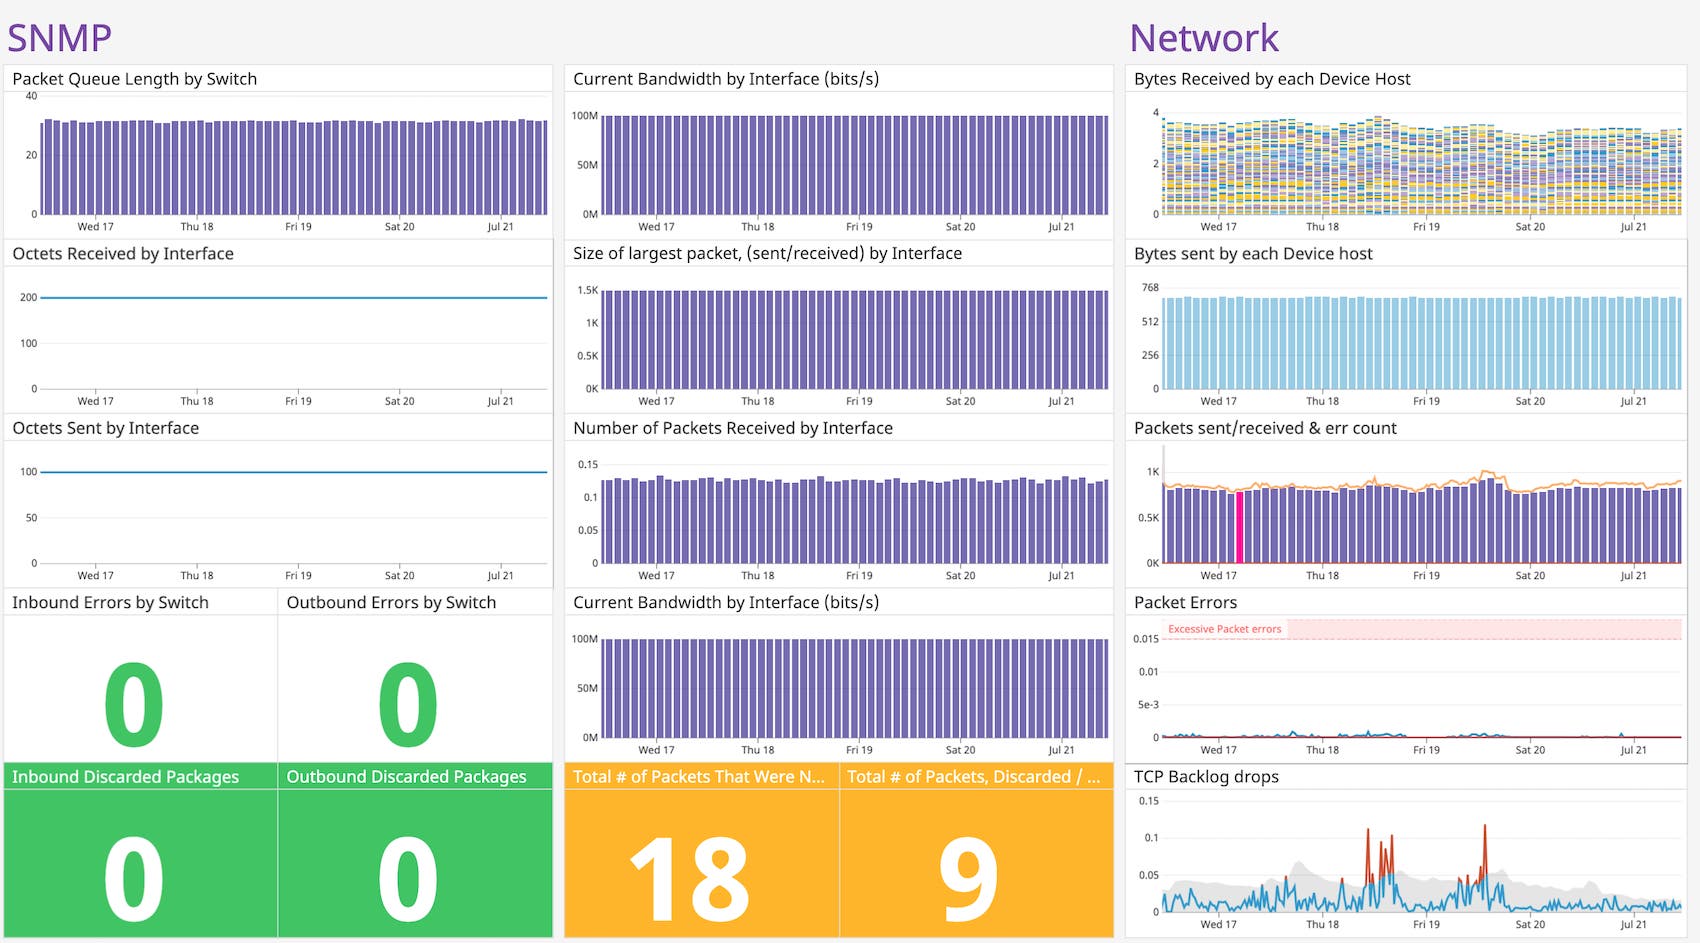
You can use Datadog to visualize, correlate, and alert on metrics from your SNMP-managed devices for greater visibility into your network’s health and performance. For example, you can view metrics like the count of inbound packet errors on a custom dashboard to help ensure that your network devices are successfully transmitting data. If inbound packet errors begin to spike, this might be a sign that data is not being successfully sent, which may cause unexpected data flow stoppages.

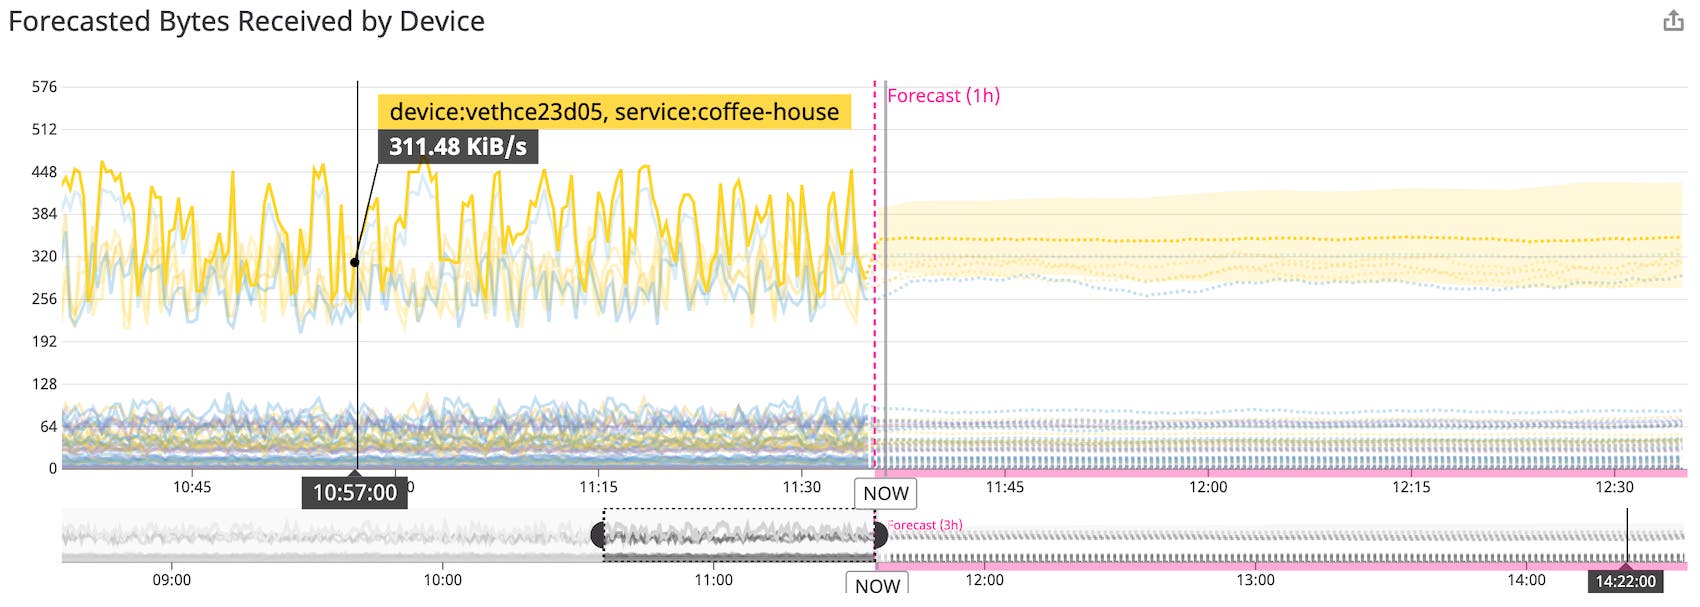
As you monitor network devices, you will need to keep an eye on switch traffic. If traffic on a link becomes excessive, it can potentially overwhelm your system. To prevent this, you can preemptively catch bandwidth saturation on your switches with Datadog’s machine learning-powered forecasting feature. Forecasting uses a metric’s past behavior to predict how it will behave in the future. This enables you to create forecasting alerts to notify you if Datadog detects that traffic on a switch is trending to surpass a set threshold, so that you can take preventative action.
Additionally, tags on your SNMP metrics help you contextualize incoming device data. For example, if you want to see your field-replaceable units (FRUs) across your Nexus, you can compare both the desired power state and the reporting state of all your FRUs, enabling you to take action as necessary. By tagging SNMP metrics, Datadog is able to see granular data about a single device and compare it to the rest of the reporting devices in your network.
End-to-end network visibility
Datadog’s SNMP integration gives you visibility into the health of your bare-metal network devices. In addition to monitoring your network devices, you can also measure the performance of your network using Datadog’s Network Performance Monitoring, in which you can view the flow of traffic between sources, whether that’s availability zone, port, or service.
Monitoring both SNMP device metrics and network traffic data gives you a comprehensive, end-to-end overview of your networked environment, from on-prem devices like routers and switches, to the various components of a distributed, cloud-based infrastructure like container images, hosts, and applications. This means you are able to use a single, unified platform to detect and troubleshoot lower layer issues like collisions and CRC frame errors, as well as higher layer problems like network congestion and blocked ports.
Together, our SNMP integration and Network Performance Monitoring enable you to monitor the health of your hybrid cloud environments. Whether you’re collecting bare-metal network device metrics or the flow of data between services or applications, Datadog provides you with a single, unified view of your entire network.
Complete network observability with Datadog
With the enhanced features of the Datadog SNMP integration, including subnet scanning, autodiscovery, and out-of-the-box device profiles, you can start monitoring and alerting on key metrics from your on-prem network infrastructure. If you’re already a Datadog user, note that you must first download Datadog Agent v6 before you can configure the SNMP integration check and start monitoring your network. If you’d like to start using Datadog, you can sign up today for a 14-day free trial.


