
Nicholas Thomson
Technical Content Writer

Shruti Mathur
The Internet of Things (IoT) can be found in a diverse range of devices, including fleets of autonomous vehicles, automobiles, planes, electric charging stations, and voice controllers. These devices are embedded with gateways, electronics, actuators, platform hubs, and cloud-service connectivity, enabling them to exchange data across the physical, network, and application layers that constitute IoT architecture. IoT devices typically emit high-cardinality data, or data that has many unique dimensions (e.g., IP address, vehicle identification number, user registration ID, geographic coordinates). For example, Peloton collects custom user experience and performance data from its bikes, including the number of workout days, trainer details, video lag, and Wi-Fi strength. However, processing, storing, querying, and monitoring all this high-cardinality data is often resource-intensive and costly.
Logs offer an efficient way to capture high-cardinality data because a single log entry can provide visibility into all the distinct dimensions emitted by connected devices. In order to fully leverage the power of logs for IoT monitoring, organizations need access to cost-effective log management solutions and tools for tagging, querying, and visualizing high-cardinality log data. These tools help you monitor IoT devices in real time and at scale, staying ahead of performance issues, and reducing mean time to resolution (MTTR).
In this post, we’ll explore how you can use Datadog to address the following challenges of monitoring IoT devices at scale:
Collect and store globally distributed IoT data at scale
As connected devices collectively emit massive volumes of logs on lower bandwidth networks, processing and querying all that data can be challenging—particularly as your IoT environment scales and spreads globally. For example, a smart office solutions company might want to keep tabs on its globally distributed, connected devices by configuring them to send high-cardinality data related to geolocations, metadata, and command updates/failures/successes. Because these devices have limited storage capacity, they must emit logs quickly to their centralized collection and processing location. This results in spiky behavior, with an anomalous flood of incoming log data that needs to be analyzed using a lot of computation.
This company also wants to keep this log data in long-term storage so that they can generate month-over-month or quarter-over-quarter reports to learn, for example, which features are experiencing heavy traffic and performance issues. Storing and processing terabytes of data is cost prohibitive, and querying unindexed data can lead to longer search times and increased MTTR. Most importantly, not all of the data generated by these devices is worth analyzing.
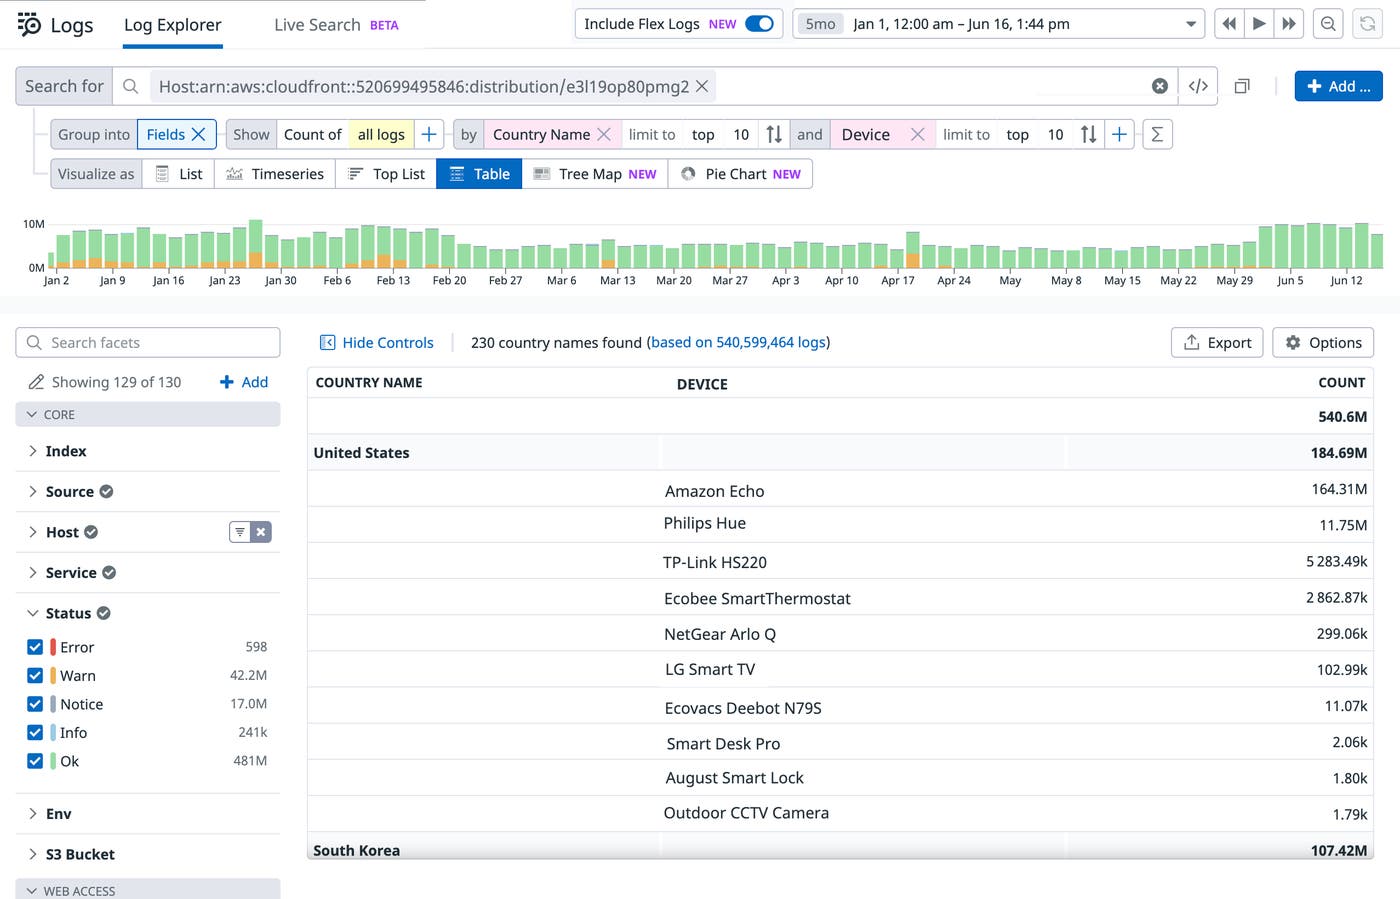
The lightweight Datadog IoT Agent continuously streams metrics and logs from connected devices to Datadog, so you don’t have to worry about gaps in visibility caused by connectivity or storage capacity issues.
Datadog enables you to get comprehensive visibility into a diverse range of connected devices by:
Analyzing logs from managed IoT services like AWS IoT and Azure IoT Edge
Collecting Cisco Meraki network event logs to track temperature, connection issues, and other changes occurring on your smart cameras and sensors
Installing the Datadog Agent to monitor the status, availability, and network traffic of your Raspberry Pi hardware devices
Transforming, storing, and analyzing logs from applications (e.g., .NET) deployed on your Raspberry Pis
Datadog’s Logging without Limits™ is designed to address the challenges of collecting and monitoring high-cardinality data from connected devices. With Datadog, you can start monitoring connected devices in minutes, and then use Logging without Limits™ to help you strategically improve your logging experience and costs as you scale to tens of thousands of devices. You can configure exclusion filters to cost-effectively index only relevant or high-priority data (e.g., from production environments) for the retention period of your choice. In addition, you can use Flex Logs to ensure that your log data remains queryable for up to 15 months, allowing you to perform long-term analytics on high-cardinality datasets without the overhead of managing external storage solutions.
Investigate high-cardinality data from IoT fleets
Because distributed, large-scale IoT fleets emit high-cardinality data in real time, it is often difficult to spot outliers in performance. For example, a mobility company may need visibility into their large fleet of vehicles, ranging from scooters to mopeds to bicycles. Use logs to monitor key insights from connected vehicles, such as lock/unlock latency, battery failures, and millions of IPs moving around the world, constantly shifting on and offline. But as this fleet generates an enormous volume of logs, it becomes increasingly time-consuming and laborious to zero in on logs that are relevant to performance issues (e.g., if a customer calls about a malfunctioning scooter). With Datadog, you can:
- Enrich and analyze high-volume data from diverse IoT devices - Ensure the availability of your IoT environment with automated monitors - Expedite troubleshooting of unusual device activity with Log Anomaly Detection
Enrich and analyze high-volume data from diverse IoT devices
Datadog Log Management offers a wealth of tools to help you collect, analyze, and visualize data from your IoT environment.
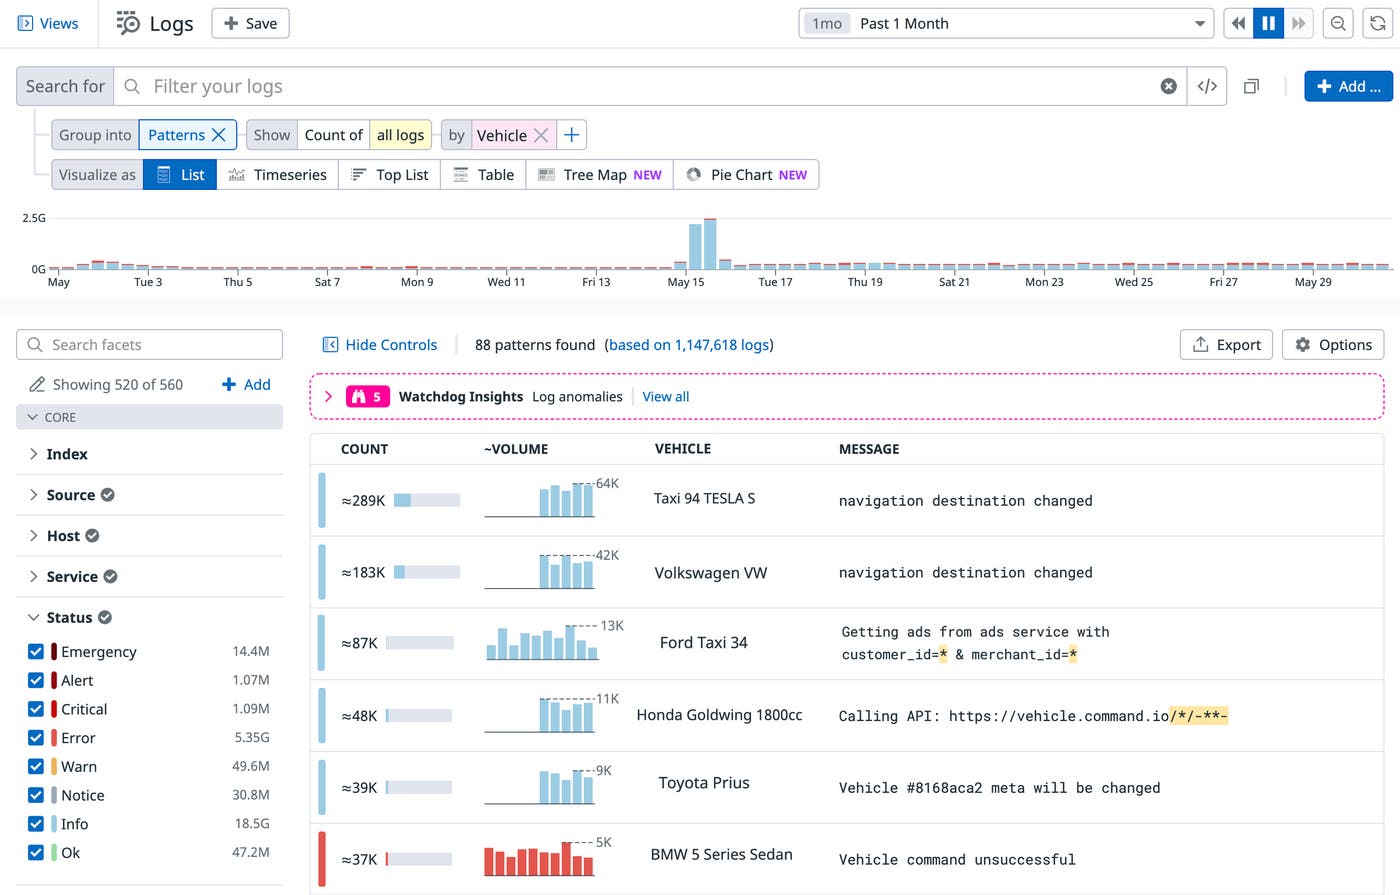
Out-of-the-box pipelines and processors automatically parse, enrich, and unify data across log sources for easy analysis and correlation. As shown in the example below, you can use the patterns view to identify which logs are useful to your analysis or investigation. You can also break down patterns by any attribute, such as vehicle, to see the most common log patterns emitted from any subset of your IoT fleet. In this case, each vehicle in the taxi-cab company’s fleet is sending logs and metrics related to booking, payment, and in-ride advertisements. Each pattern displays the message from all logs in the group, with highlighted snippets indicating variations. Below, you see an elevated number of error logs coming from the BMW 5 Series Sedan taxi with the error message Vehicle command unsuccessful.
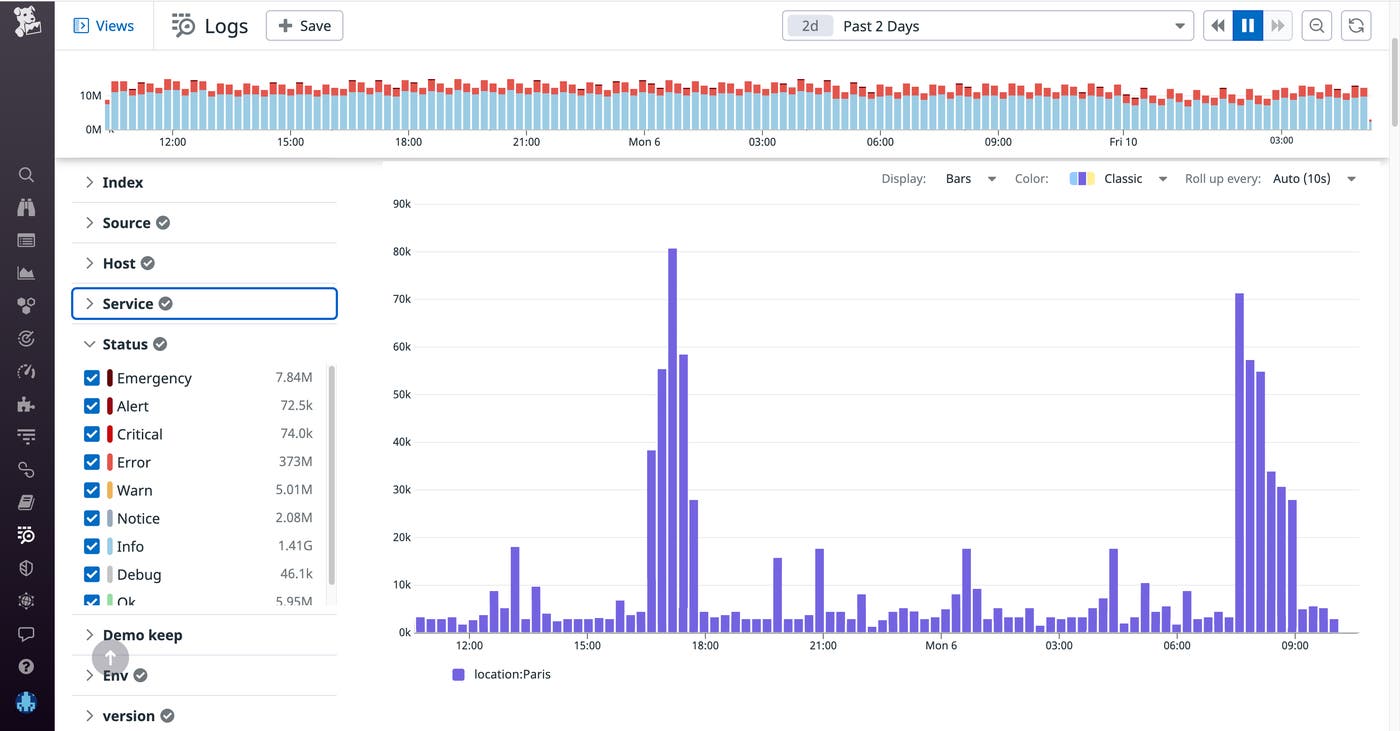
The Log Explorer also offers powerful aggregation tools (such as p95 or p99 distributions) and a host of useful visualizations (e.g., top list and timeseries), which can help you understand trends in your logs. Say you want to investigate when these Vehicle command unsuccessful logs are being generated across your IoT environment. In the example below, you see that these error logs are spiking during rush hour (morning and afternoon), which leads you to discover the source: surges in usage during peak hours are preventing the connected vehicles from sending updates.
Ensure the availability of your IoT environment with automated monitors
Automated monitors can notify you when critical, business-impacting issues are detected in your IoT environment. For example, the mobility company may want to follow up on its investigation by setting up a monitor to trigger when error logs coming from its connected devices cross a reasonable threshold, allowing them to quickly address future surges during peak hours and improve end-user experience.
Monitors are a useful tool for filtering out noise from your IoT logs. Connected devices can face intermittent downtimes due to lack of connectivity to the internet or loss of battery, so monitoring and alerting on device health is paramount. Datadog anomaly monitors can detect when metrics deviate from a historical baseline sufficiently to constitute an anomaly (rather than just intermittent noise). This means that operators can build monitors that trigger only on sustained or widespread device failures, so that responders are not overwhelmed by noisy alerts for transient issues.
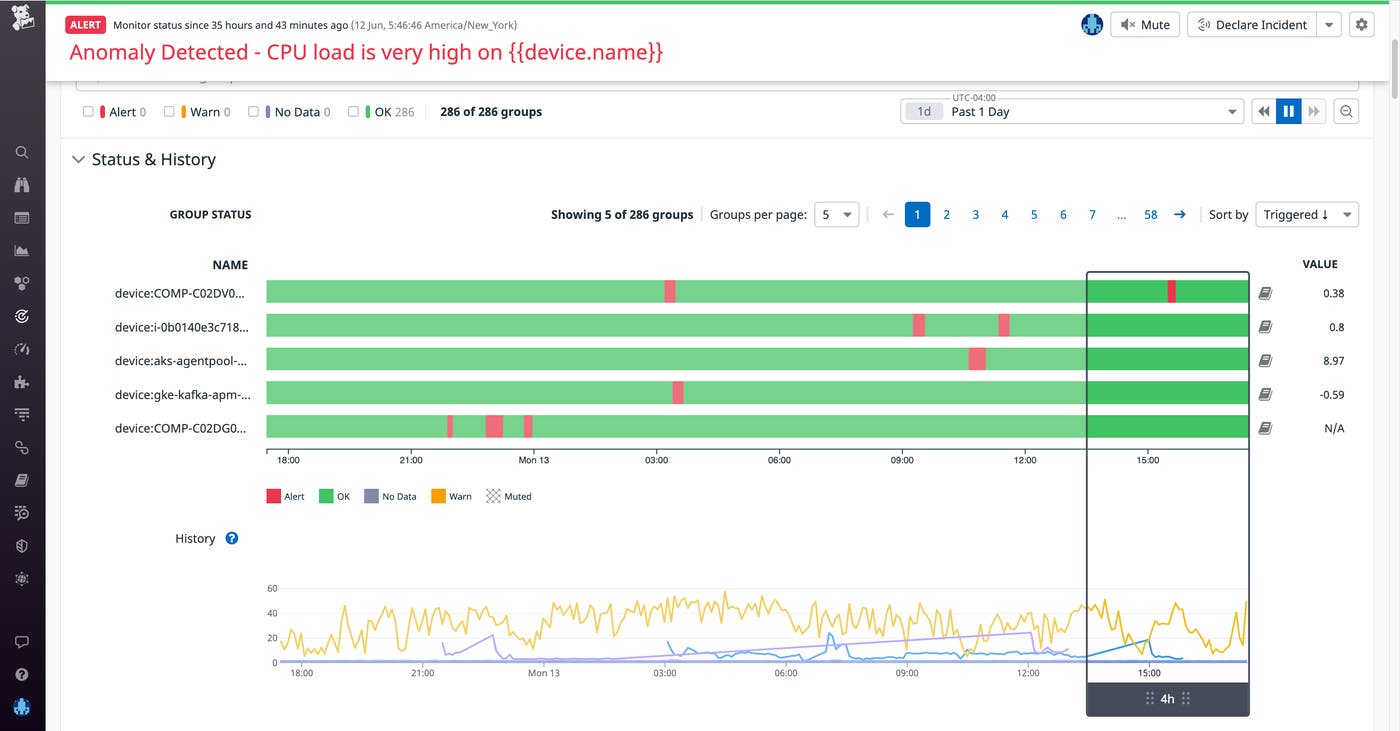
With Datadog Audit Trail, you can track user and API actions that may disrupt your ability to monitor critical IoT data. For example, you could set up a monitor that automatically notifies you if a user modifies an IoT log storage index, giving you enough time to reach out to the user to confirm that the change was intentional.
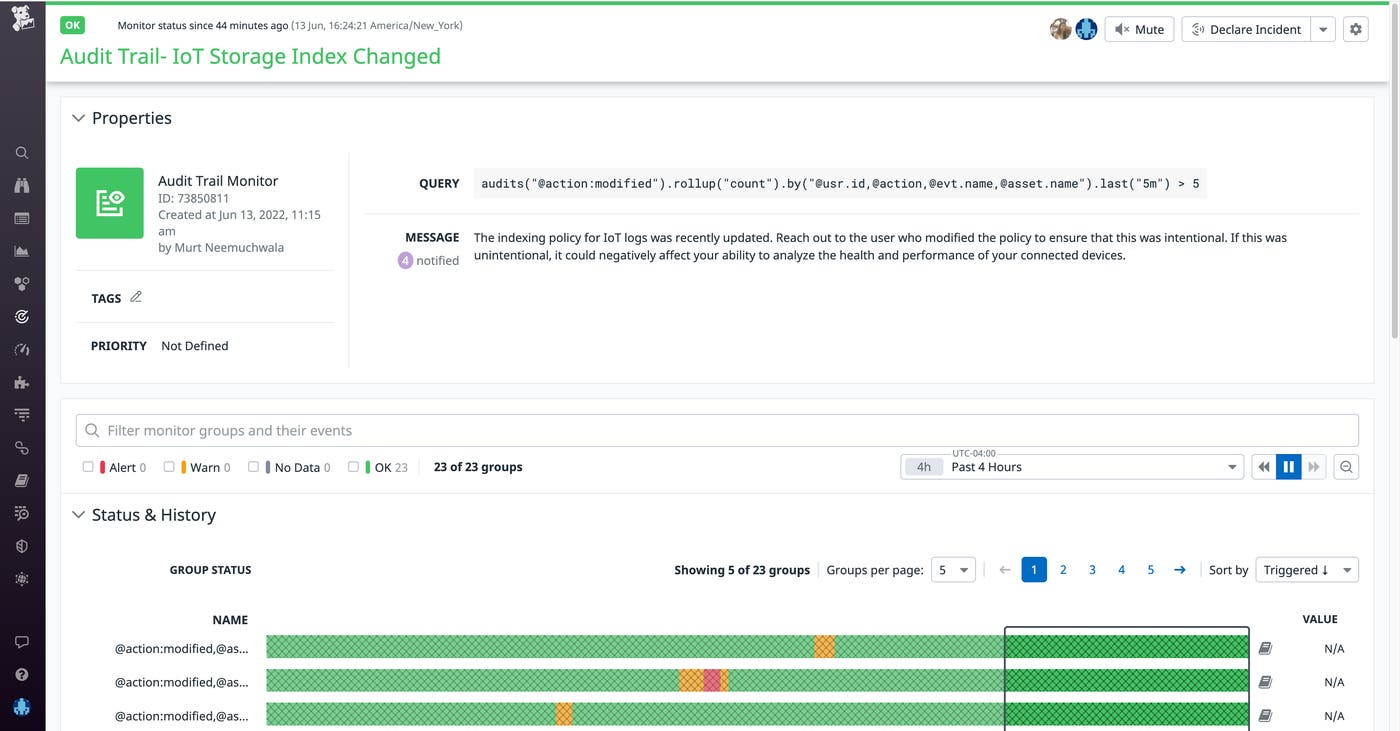
Expedite troubleshooting of unusual device activity with Log Anomaly Detection
Due to the real-time nature of many IoT platforms, having low latency is an important requirement. Lateral-movement security threats in IoT devices are a common concern. Once hackers gain access to a single device, they are able to leverage that entry as a means of accessing the entire network and then access valuable financial and business information within that network. Watchdog—Datadog’s machine learning and AI engine—leverages machine learning algorithms like Log Anomaly Detection to help you quickly pinpoint and investigate performance and security issues across your IoT environment.
For instance, say you are a security engineer monitoring your company’s fleet of connected vehicles. Watchdog automatically scans your environment in real time and provides a summary of any detected anomalies, aggregated by pattern, enabling you to expedite your cyber forensic analysis. It also shows samples of the anomalous logs, saving time and effort on querying related log events. Because data from your devices is tagged with categories like service, country, and device_model, you’re able to see which members of your fleet are behind these anomalous error rates. In the example below, Watchdog has surfaced an ongoing issue: an elevated rate of error logs coming from service:iot-action-service-kafka, a service that handles authentication for your devices.
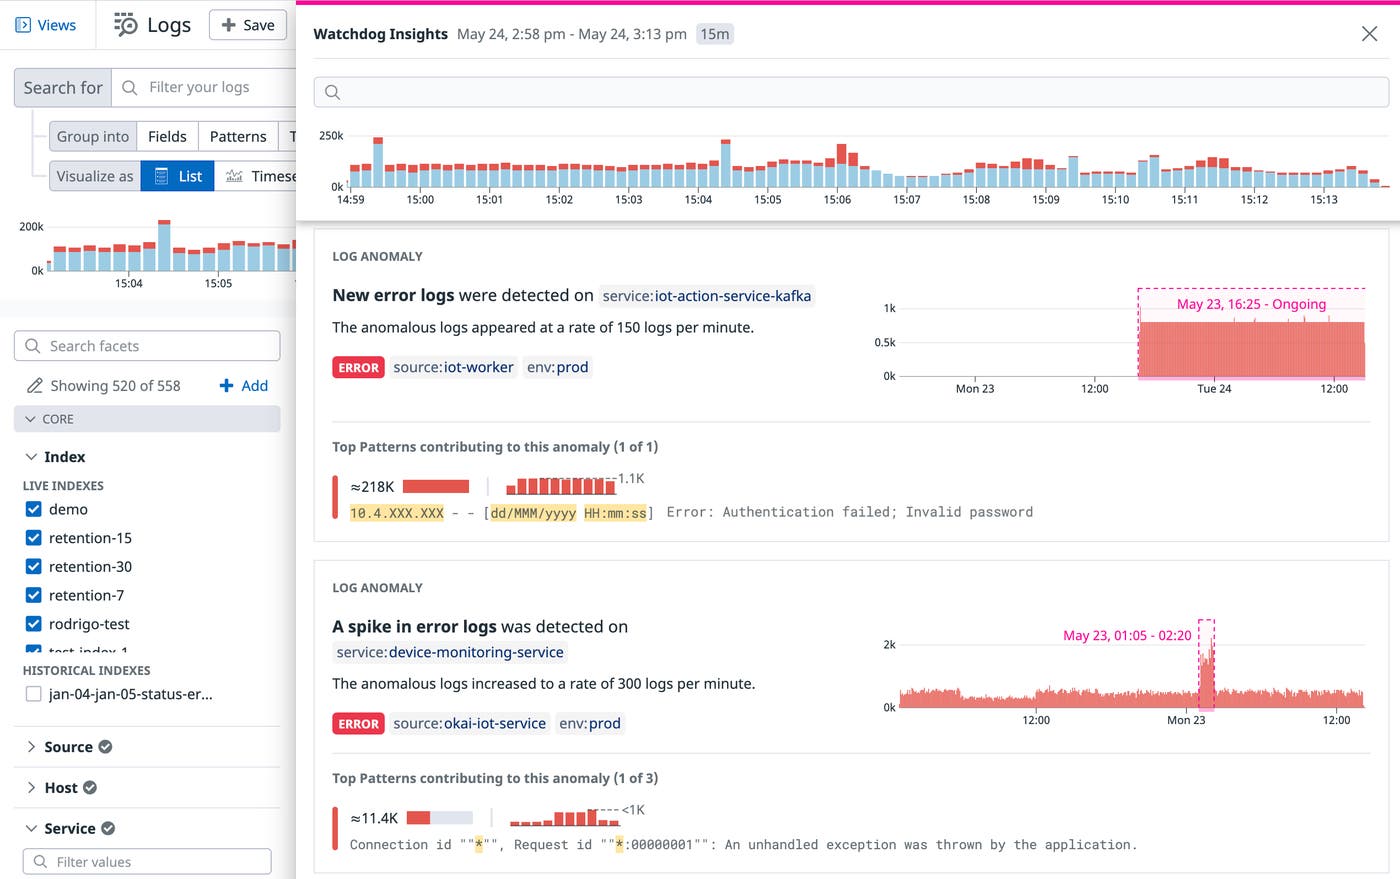
This spike in authentication failures could indicate a brute force attack. To get further details and prevent malicious actors from gaining access to the network, you can inspect the logs to understand where the requests are coming from, or trace the error through your application to see which other services may have been involved in the issue.
Correlate business-level KPIs with device and system metrics
In addition to using high-cardinality data to track the health and performance of your IoT devices, you also need an easy way to understand how this data ties back to business metrics like regional profitability, infrastructure investments, network spend, partner usage attribution, and maintenance overhead.
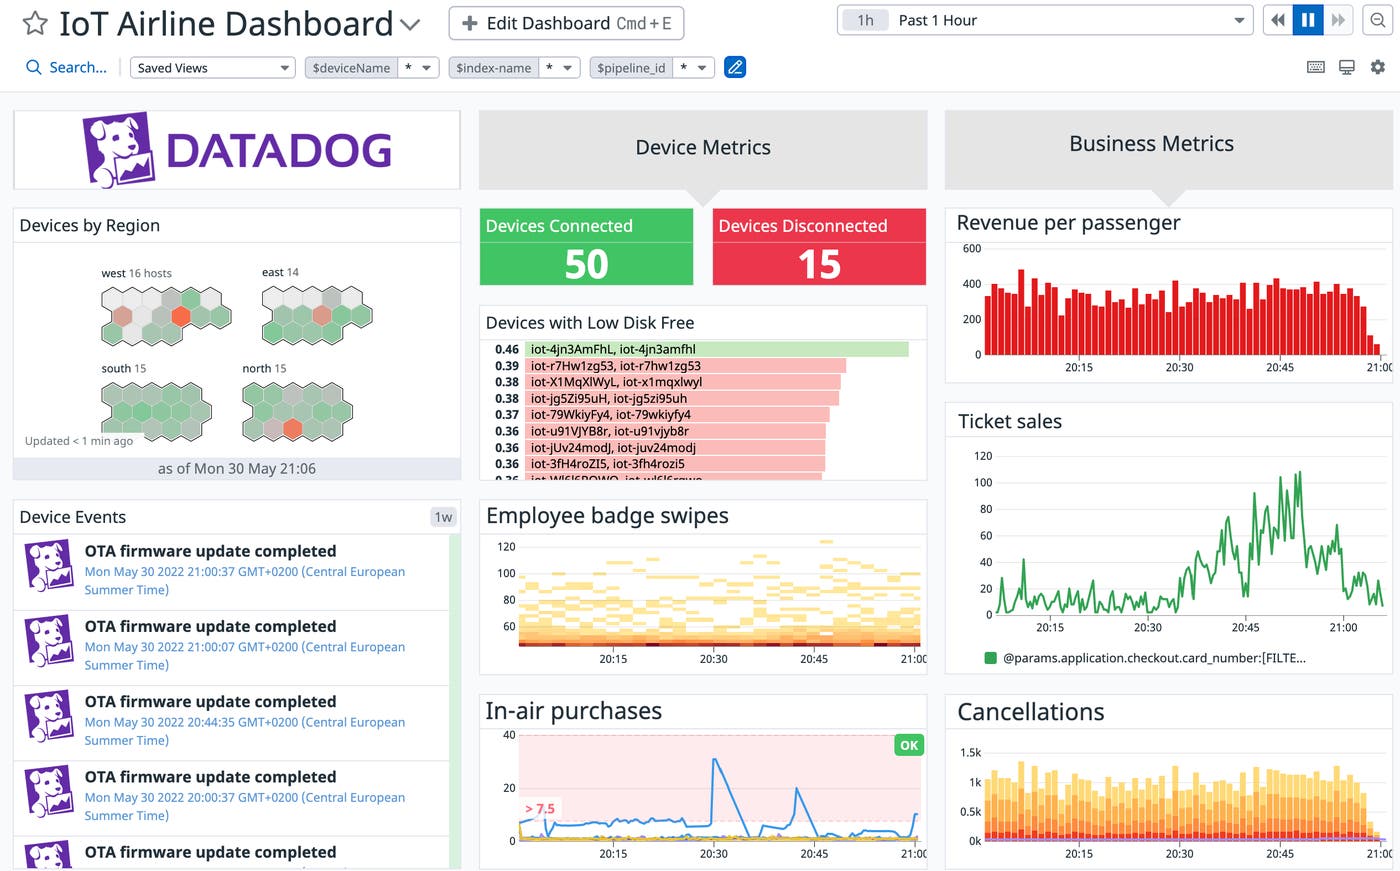
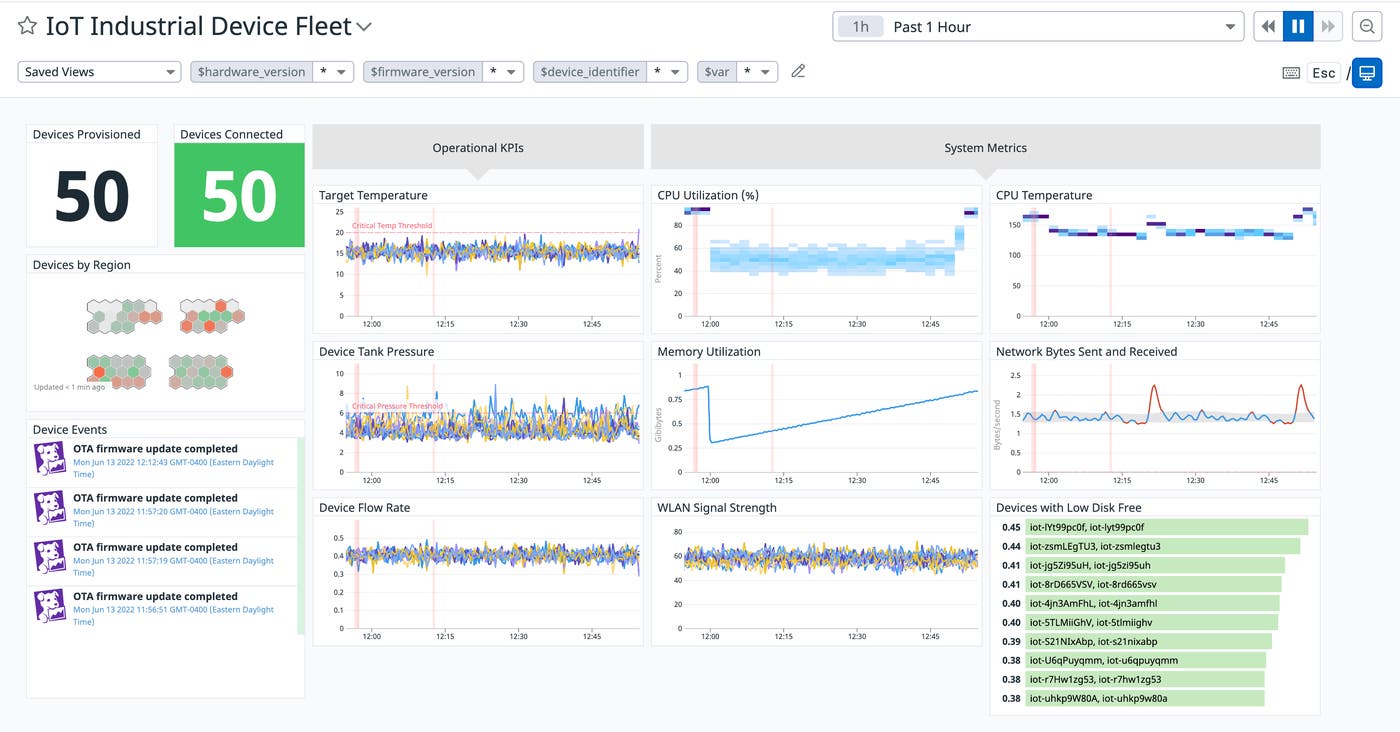
Teams can derive meaningful insights from high-cardinality IoT data by correlating business metrics with health and performance metrics from their connected devices in a comprehensive dashboard, as shown above. For example, an airline company may want to use logs to monitor entertainment panels on seats, credit card machines that power in-air purchases, employees' badge swipes, and other data from their IoT devices. These logs can be correlated with business metrics such as ticket sales, number of seats occupied, revenue per passenger, and cancellations. From this single pane of glass, you can see at a glance how revenue per passenger correlates with in-air purchases.
Unlock deep visibility into your IoT devices with Log Management
Datadog Log Management offers a wealth of tooling to help you uncover insights from high-cardinality IoT data. Check out our IoT monitoring solution brief and solutions page to learn more about monitoring your connected devices. If you’re already a Datadog customer, you can start collecting logs from your devices by consulting our documentation. If you’re new to Datadog, sign up for a 14-day free trial to get started.
