Priyanshi Gupta

Paul Gottschling
Datadog Technical Content Writer
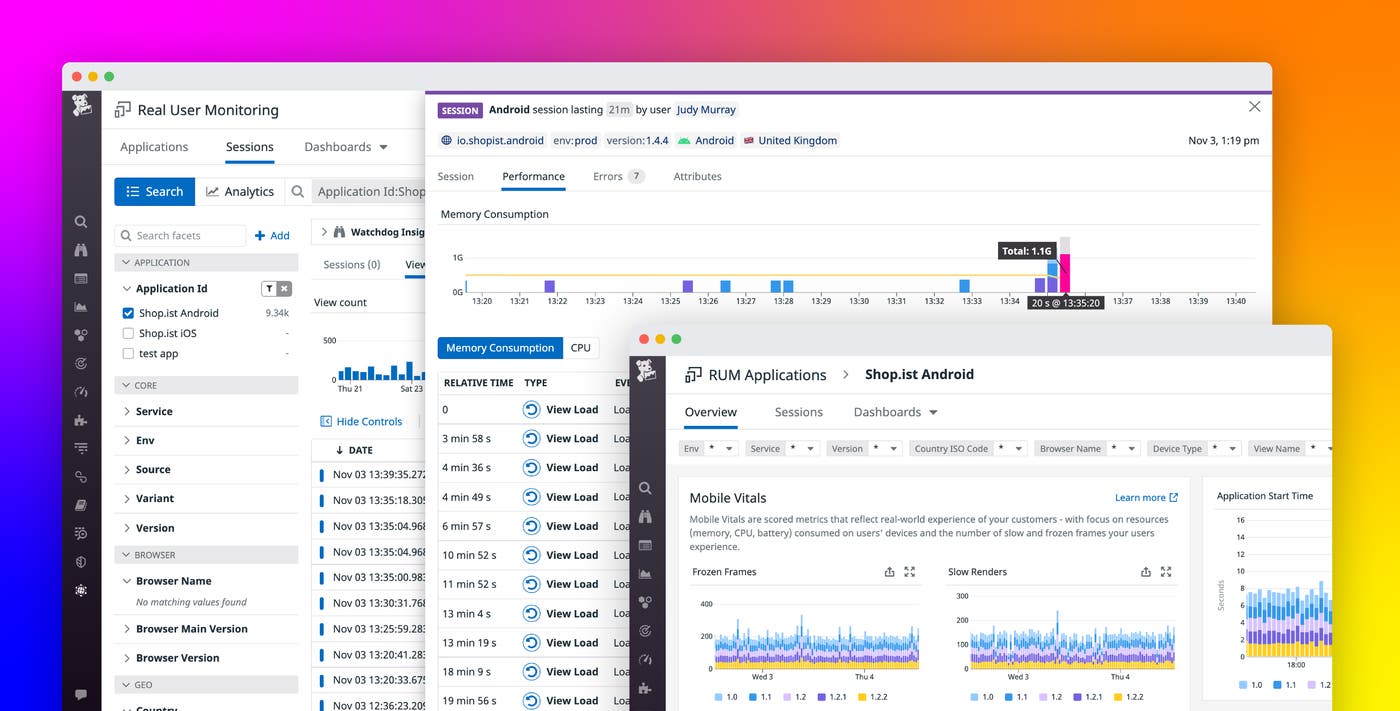
After you release a mobile application, you need to ensure a smooth, engaging experience for users. Poor performance and heavy resource consumption can cause your application to rank lower for prospective users in the Google Play Store or App Store, and existing users can become frustrated and even uninstall your application. All of this can spell trouble for business-related performance indicators like engagement and discoverability. To help ensure a positive experience for mobile users, Datadog now monitors Mobile Vitals—metrics that track fundamental health and performance indicators from your applications (inspired by Android vitals and iOS MetricKit)—for Android, iOS, React Native, and Flutter. You can view these metrics in the context of RUM events, crash logs, and backend application request traces in Datadog, giving you comprehensive visibility into mobile app performance.
In this post, we will introduce the following Mobile Vitals metrics:
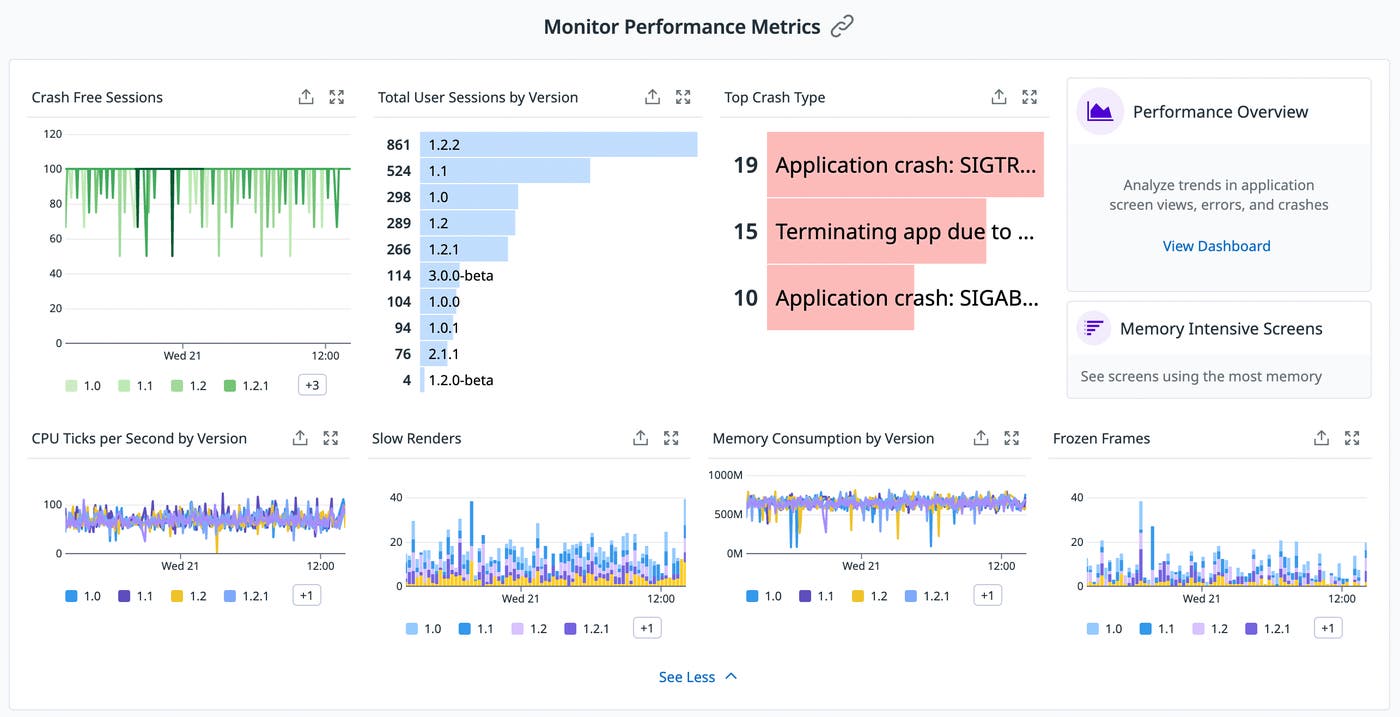
Key metrics for mobile application performance
Slow renders
When slow rendering takes place, each frame within a view appears on the screen with a delay, causing an application to be choppy or unresponsive. Datadog measures slow rendering in terms of refresh rate—the number of frames rendered over time—which has an industry benchmark of 60 frames per second. Slow rendering indicates that the CPU or GPU is doing more work than necessary to render a frame, which leads to unhealthy battery usage.
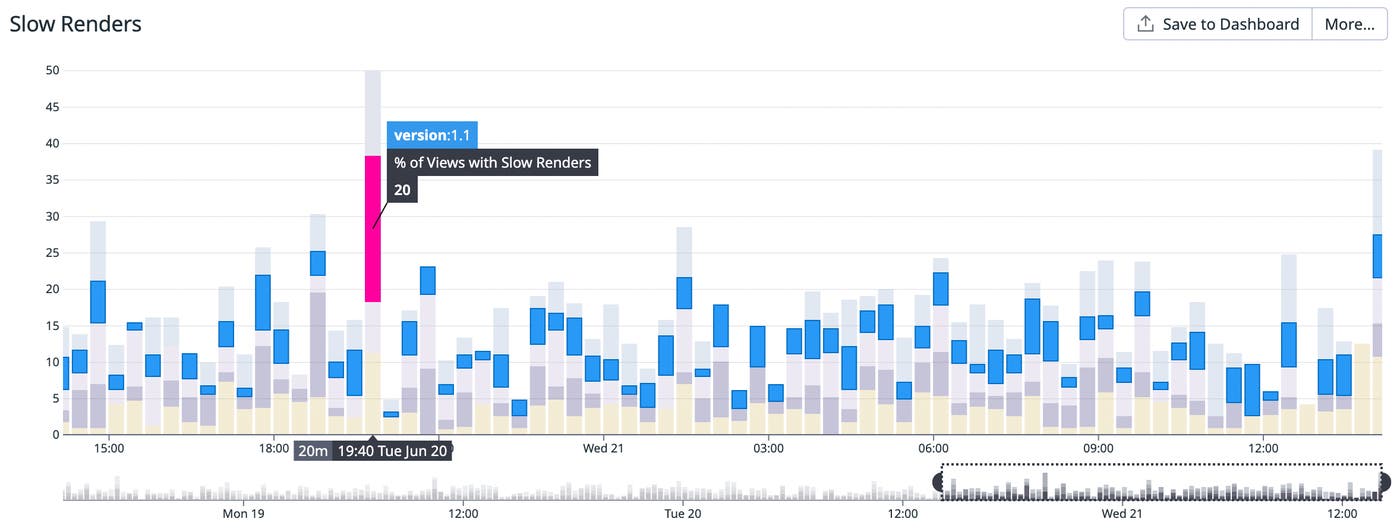
Mobile Vitals lets you track the percentage of views with an average refresh rate of 45 frames per second or less so you can gauge your application's responsiveness to user interactions. Since devices can have different maximum refresh rates, Mobile Vitals scales this metric to a value between zero and 60, allowing you to track your application's refresh rate regardless of hardware-specific restrictions.
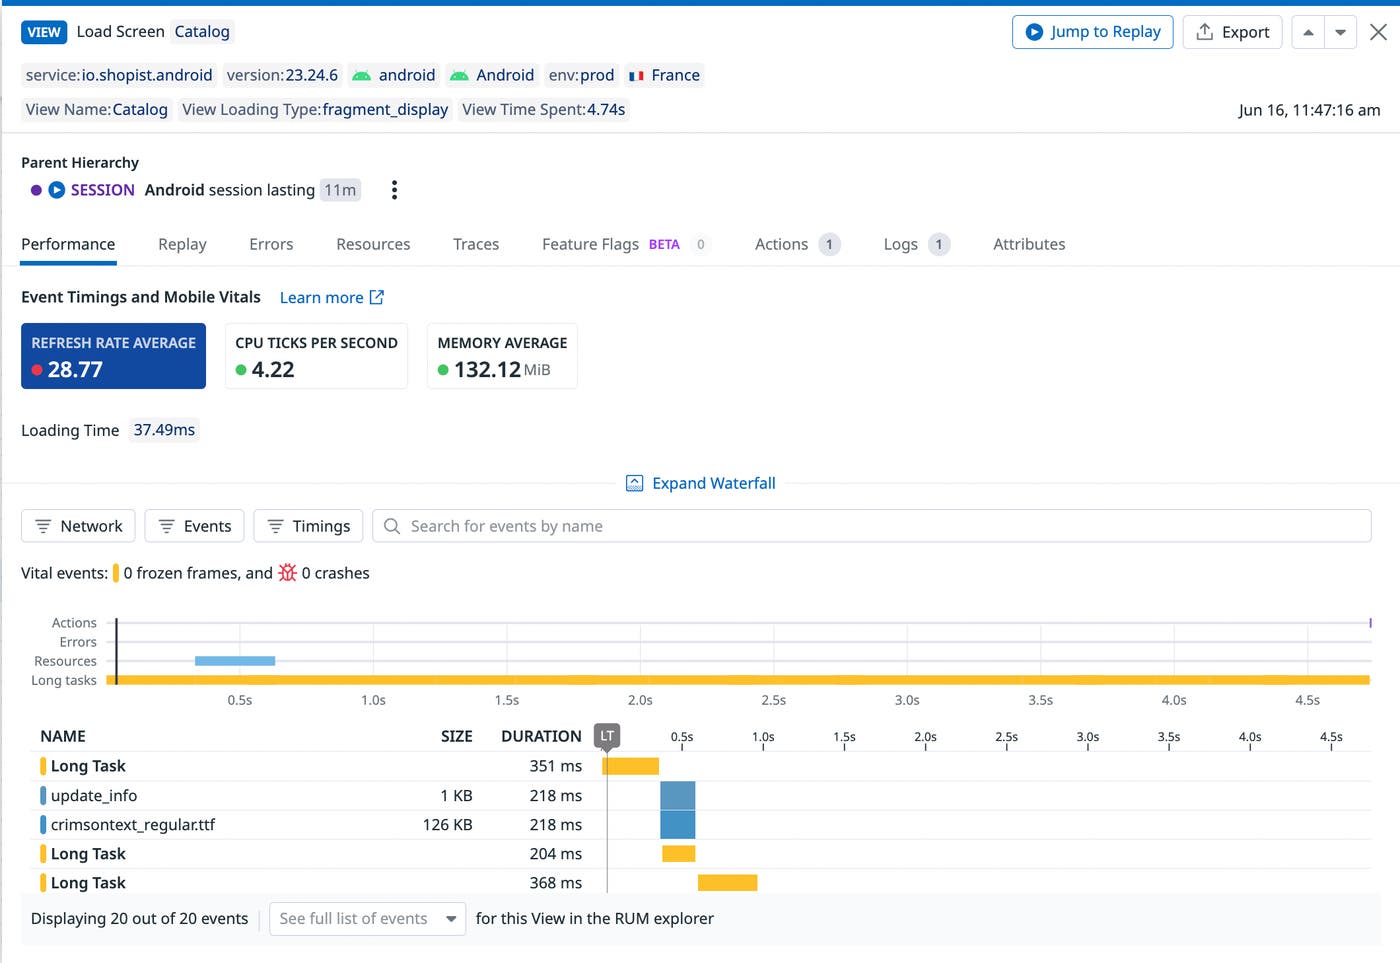
Datadog also tracks the average refresh rate during the lifetime of a particular view, starting from when a user first loaded the view. In the example below, we can see that one view has an average refresh rate of 25.84 frames per second, slow enough for users to perceive flickers.
JavaScript slow renders
In React Native applications, native UI interactions are often triggered by JavaScript code. Therefore, when slow rendering causes applications to become choppy or unresponsive, both native or JavaScript processing times can be at fault. As with native slow renders, Datadog measures the JavaScript refresh rate—the number of frames rendered over time by the JavaScript thread—which has a similar industry benchmark of 60 frames per second.
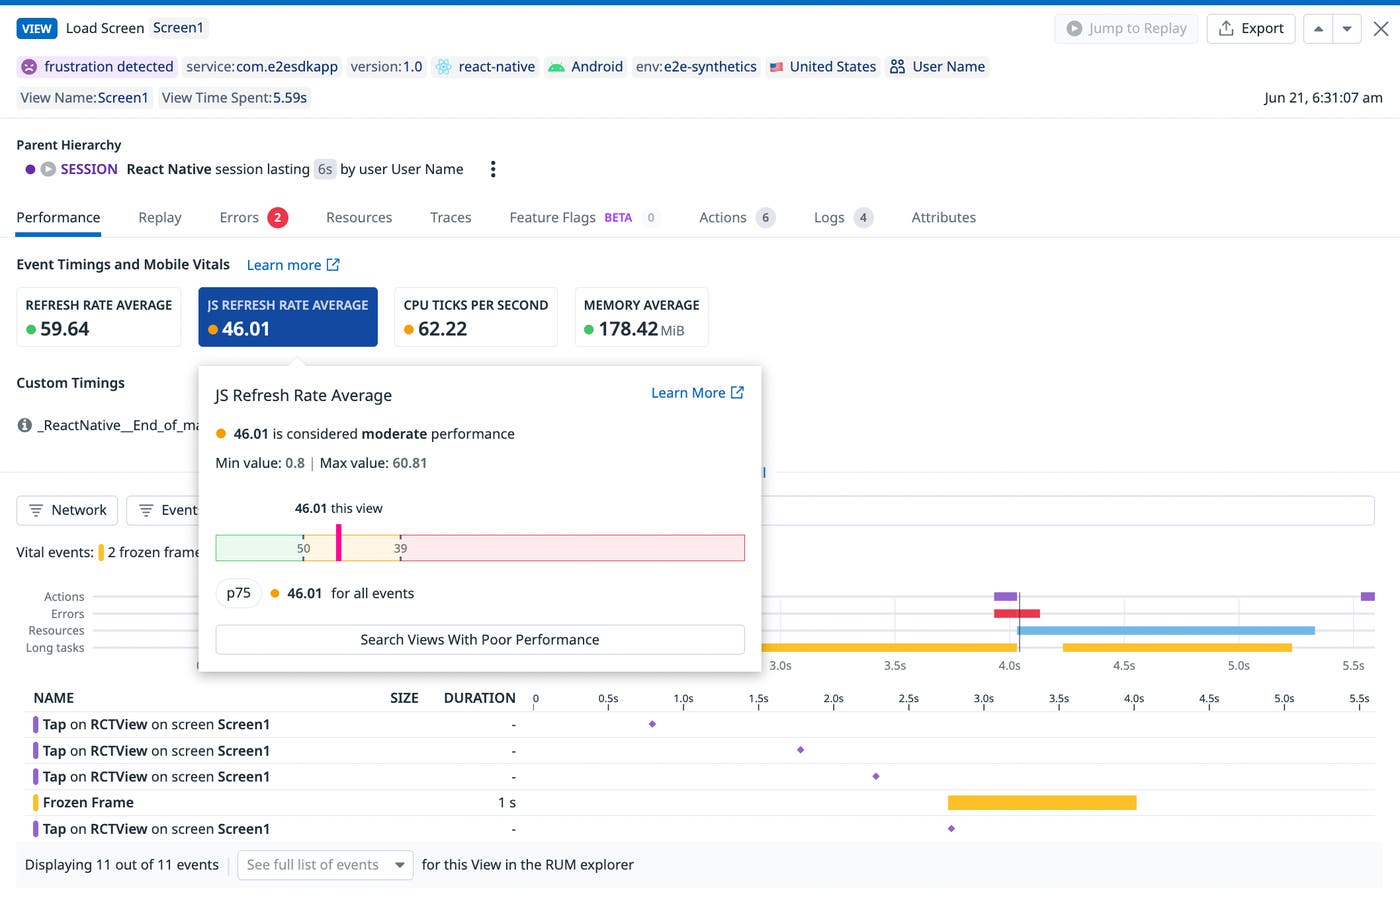
Mobile Vitals lets you to track the average JavaScript refresh rate during the lifetime of a view so you can gauge your application's responsiveness to user interactions. This helps you understand whether slowness is due to poor JavaScript or native processing times, enabling you to focus your efforts on problematic parts of your application code.
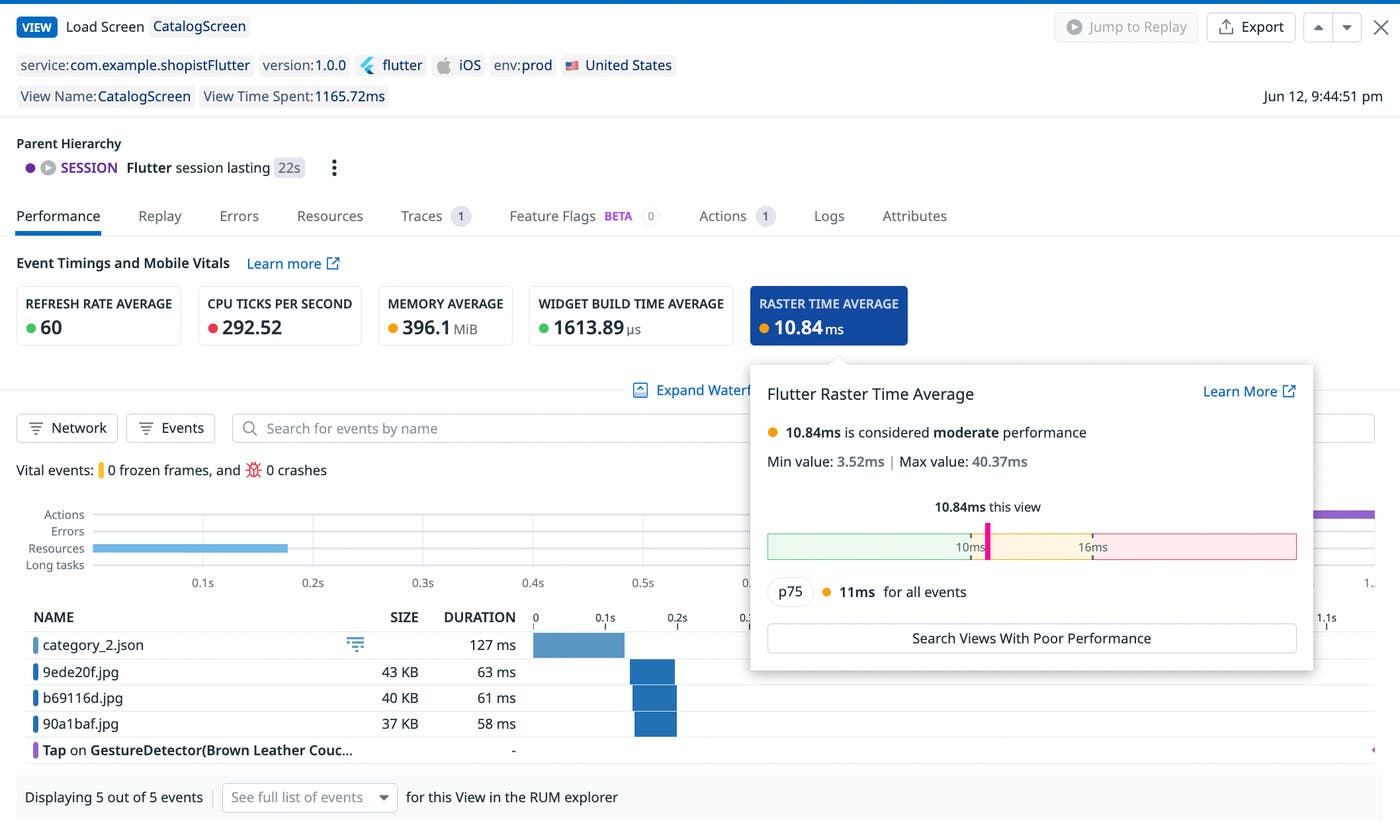
Flutter build and raster time
The basic building blocks of Flutter applications are widgets. Almost all app components are widgets, including buttons, style elements, and even pop-up screens. Compared to other frameworks, Flutter does not have separate controllers, views, or layouts—instead, it uses widgets nested into a widget tree. To help you determine why an application has a slow render, Datadog measures widget build times and raster times. For instance, high build times can indicate that screens are too complex or that your app is trying to rebuild too much of the widget tree, while high raster times can indicate that too many effects are being attempted simultaneously.
Frozen frames
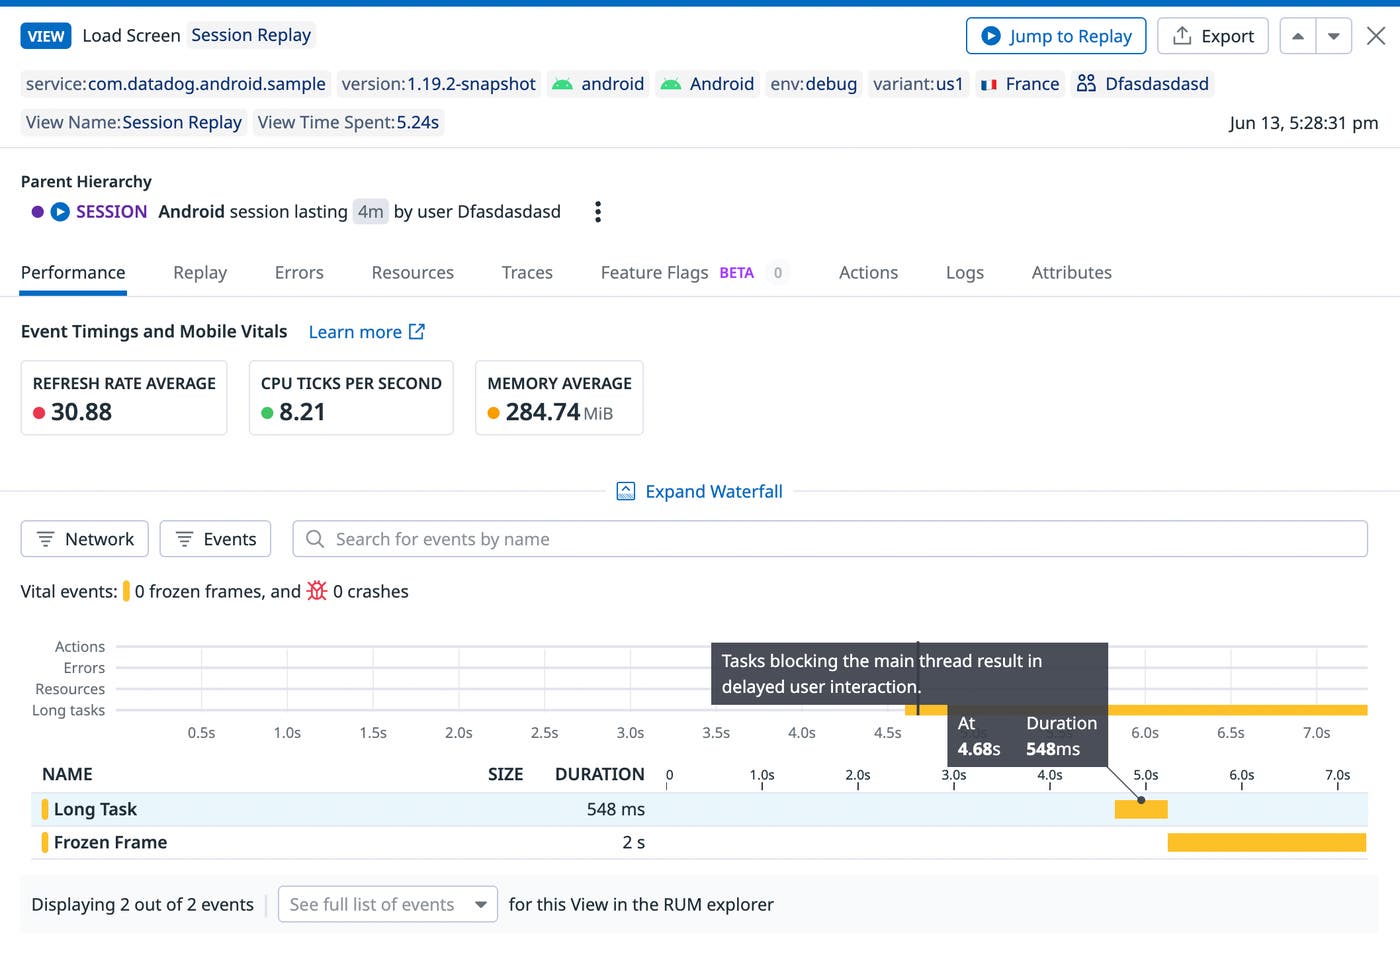
A frozen frame occurs when a particular UI frame is taking longer than 700 ms to render. Frozen frames make your application appear temporarily unresponsive to users, which not only causes frustration, but can also lead to ANRs when frame render times extend beyond five seconds. Mobile Vitals shows you any views with frozen frames and how long those frozen frames lasted, helping you pinpoint areas where your app is experiencing issues.
Application not responding
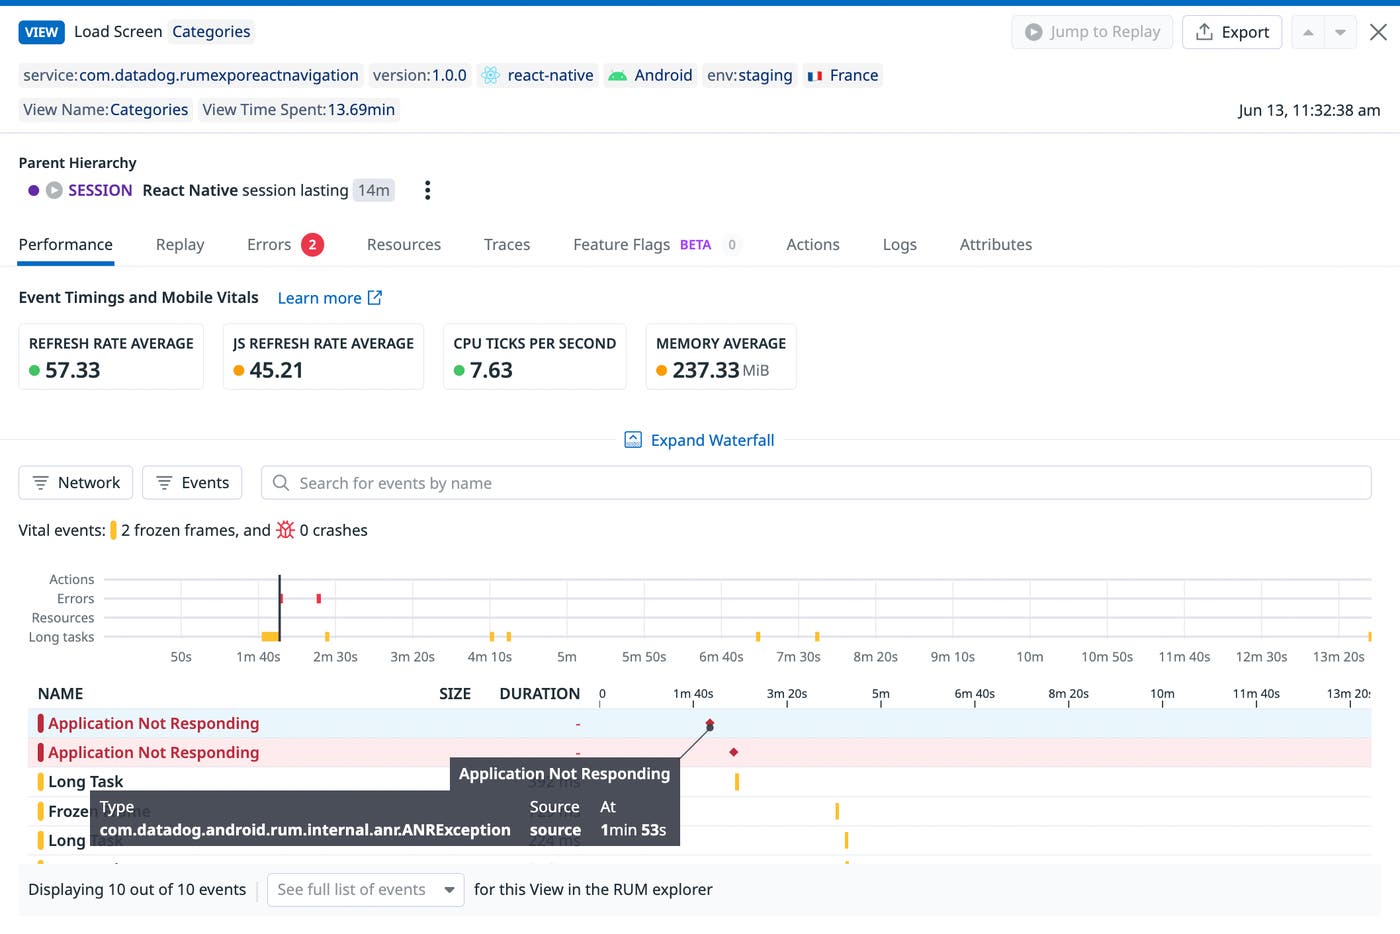
The application not responding (ANR) metric indicates when your application takes longer than five seconds to respond to a user interaction. When this happens, the OS will display an ANR dialog giving users the option to exit an application. In terms of user experience, ANRs are as serious as crashes (which Datadog also lets you track), since they signal that your users can no longer interact with your application. Using this metric, you can see precisely when an ANR takes place during the course of a view, giving you the context you need to troubleshoot.
In the view below, we can see that an ANR took place in the middle of two long tasks, which occur when the main thread is blocked for longer than a user-configured duration (100 ms by default). Since the ANR and the long tasks appear related, we can see which tasks take place after rendering the "Load Screen" view and investigate ways to alleviate them.
Crash-free sessions
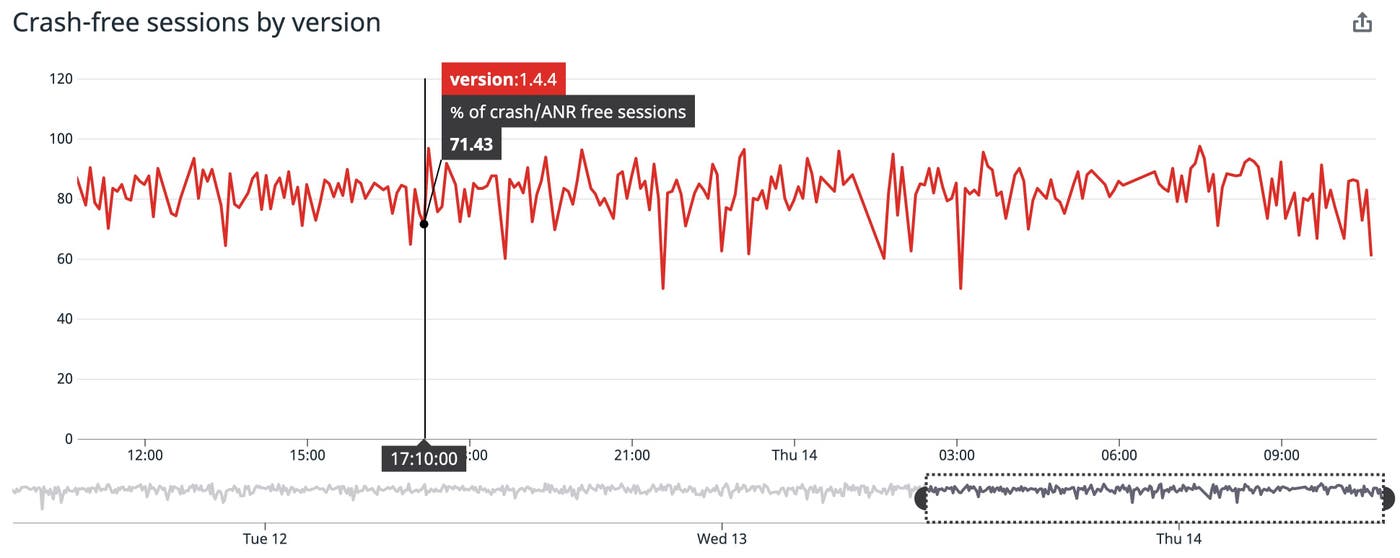
To ensure that your applications provide a smooth experience for users, you'll want a baseline assurance that user sessions tend to run without crashes or ANR messages. Mobile Vitals lets you track the percentage of sessions in a given timeframe that run without a crash or ANR, grouped by application version.
If the percentage of crash-free sessions is lower than usual for a specific version, you should release a patch as soon as possible. But if your application is crashing more frequently than usual across multiple recent versions, the issue may have to do with unexpected responses from your backend infrastructure. For example, an API endpoint may be returning 5xx errors, or may have recently been updated to send response payloads in a new format. To investigate further, you can use the RUM Explorer to see if your application views have run into errors, and inspect related APM traces for any errors on the backend.
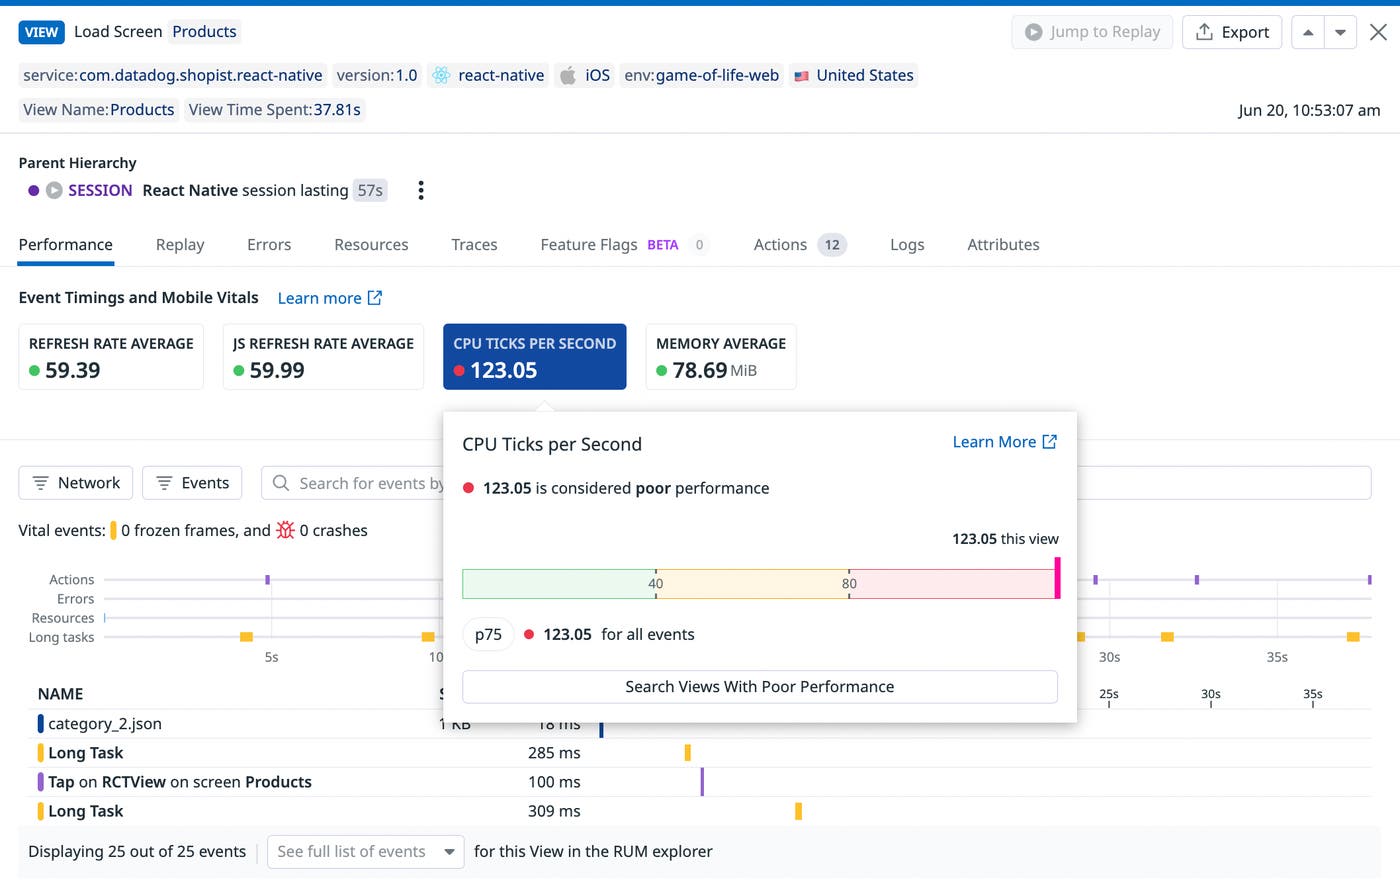
CPU utilization
Mobile Vitals tracks the average number of CPU ticks per second over the course of a single view within a user session. The higher the number, the more frequently your application used the CPU during a session. High CPU utilization affects battery consumption on user devices, so staying on top of this metric ensures that your users can sustainably use your application—and will not uninstall it to preserve their battery. This example shows a view with particularly poor CPU consumption.
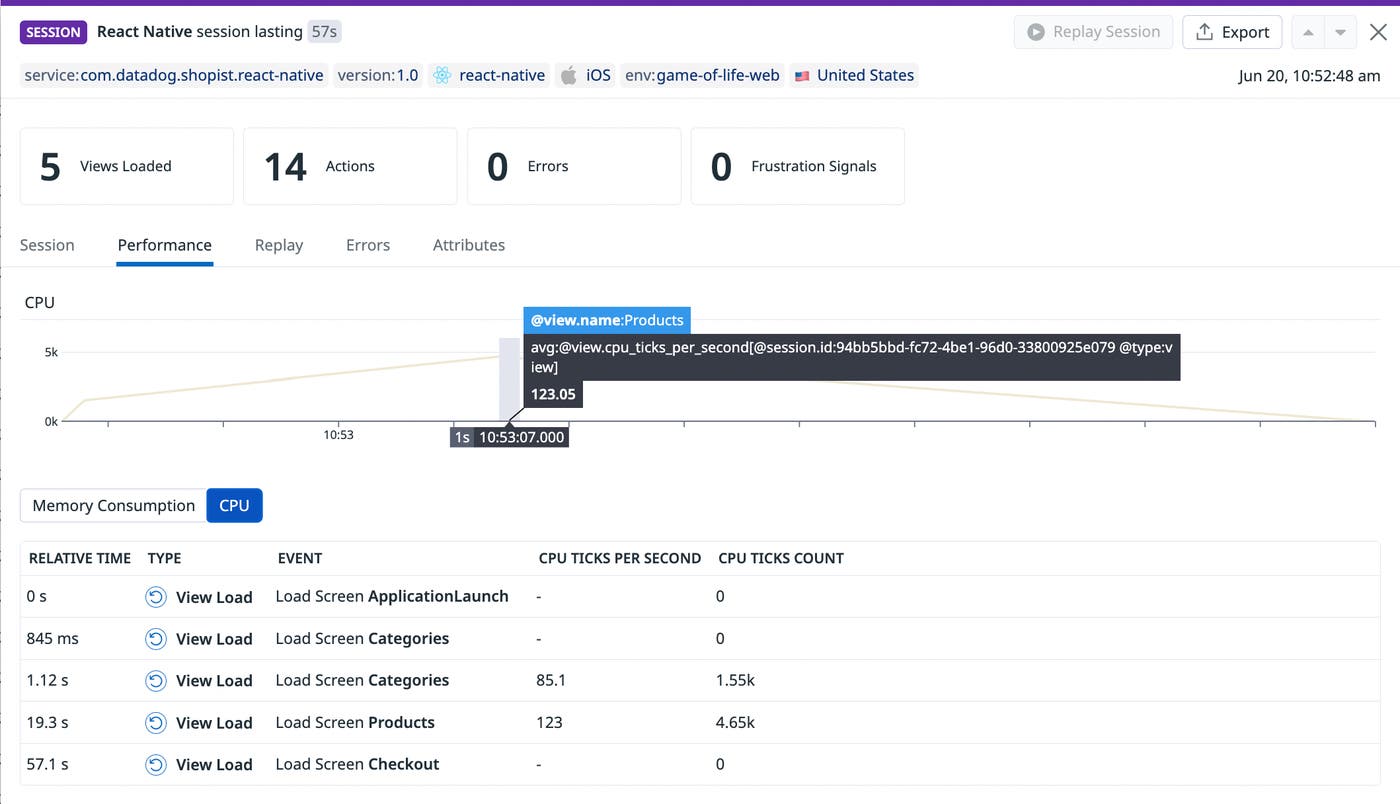
You can also use Mobile Vitals to track CPU utilization across an entire user session, making it easier to spot view loads that are particularly hard on battery life. Below, we can see that the "Cart" view uses an outsize proportion of CPU time.
Memory utilization
If a mobile application cannot allocate an object in memory, it throws an Out Of MemoryError error that causes the runtime to suddenly crash and display a notification that your application "has stopped," creating a poor user experience. For each user session, Datadog measures the amount of physical memory currently being used by your application, in bytes, over the lifetime of each view.
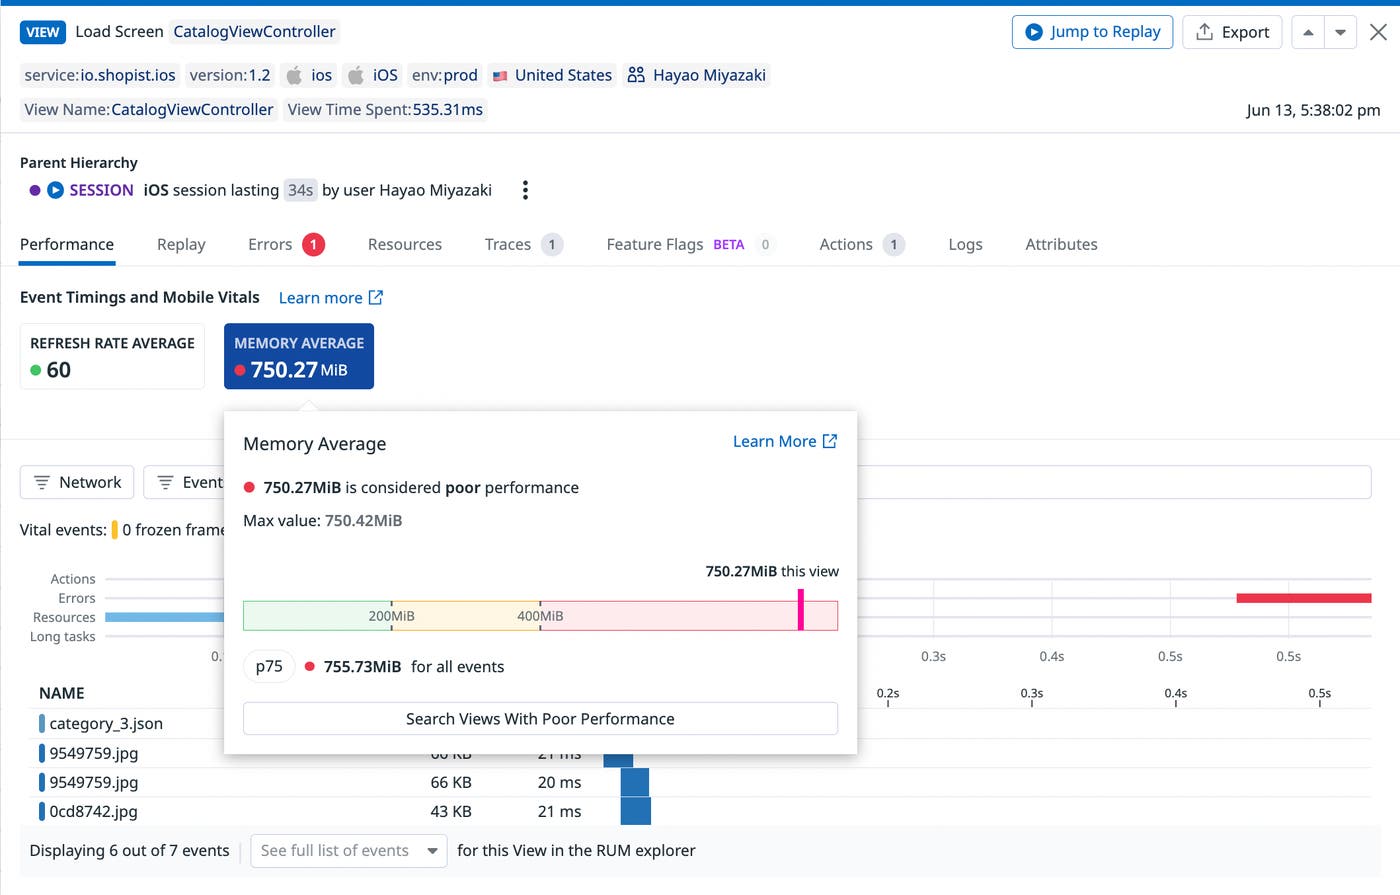
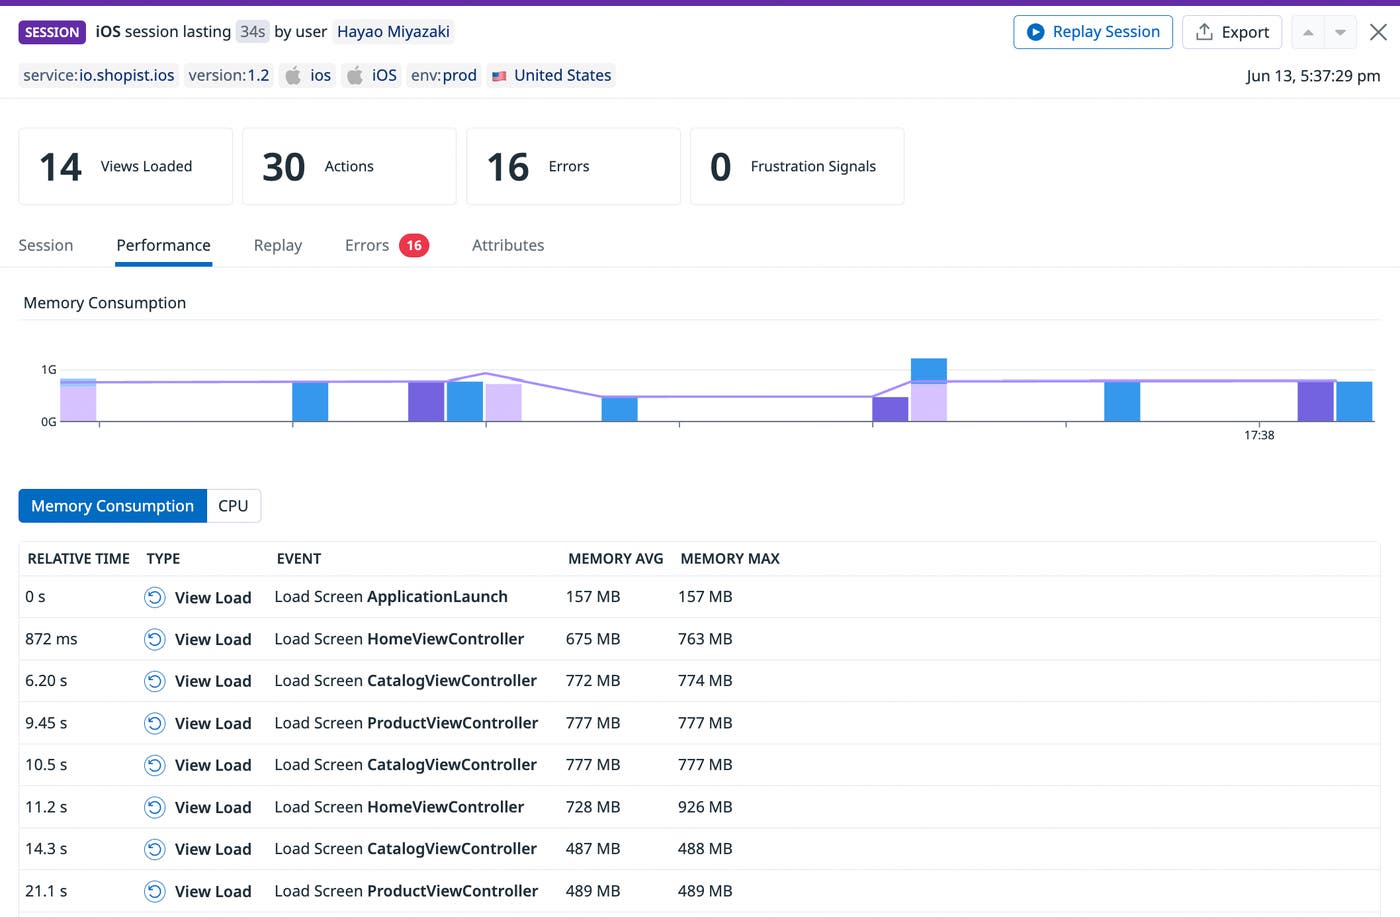
With Mobile Vitals, you can also track memory utilization for all views within a single session, helping you identify memory leaks, problem areas, and opportunities for optimization. In the example below, we can see that, while seven views loaded at the end of the session each used a moderate amount of memory, in total these views used over 1 GB. Since this much memory usage can pose issues for user devices running other applications, we investigate ways to reduce the memory footprint of these views.
If your mobile applications are using high levels of memory and running into OOM errors, you should consider designing them to detect low-memory conditions via the OS and adjust their memory utilization accordingly. You can also use Datadog's dashboards and Error Tracking view to get even more insights about OOM errors and other mobile crashes.
All your vitals in one place
In this post, we have shown you how to monitor Mobile Vitals to ensure that your mobile applications are providing a smooth experience for users. Mobile Vitals give you a layer of visibility into your mobile application performance on top of Mobile RUM, which supports Android, iOS, React Native, and Flutter. You can pivot straight from errors in Mobile RUM to Datadog Error Tracking, enabling you to see all of your mobile application errors in the context of broader trends and know which ones to address first.
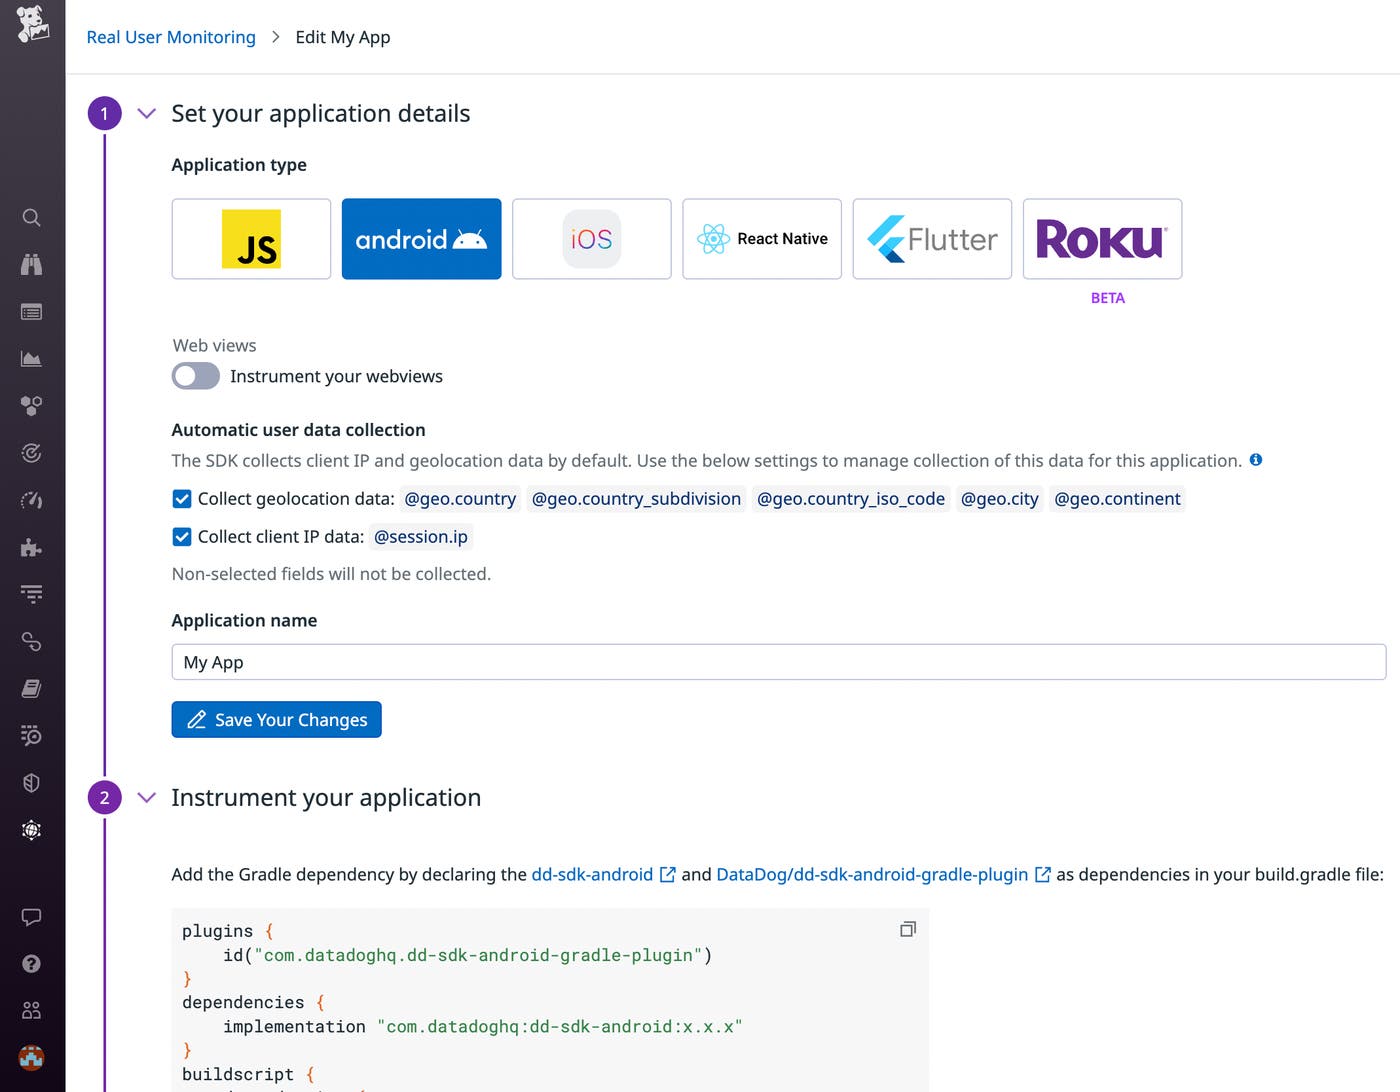
To start collecting Mobile Vitals, import and initialize Datadog’s RUM SDK in your Android, iOS, React Native, or Flutter code. For more information on our RUM SDKs, check out our documentation.
If you’re not yet a Datadog customer, you can sign up for a 14-day free trial to get started.
