
Emily Chang
Editor’s note: Elasticsearch uses the term "master" to describe its architecture and certain metric names. Datadog does not use this term. Within this blog post, we will refer to this term as "primary", except for the sake of clarity in instances where we must reference a specific metric name.
This post is part 1 of a 4-part series about monitoring Elasticsearch performance. In this post, we'll cover how Elasticsearch works, and explore the key metrics that you should monitor. Part 2 explains how to collect Elasticsearch performance metrics, Part 3 describes how to monitor Elasticsearch with Datadog, and Part 4 discusses how to solve five common Elasticsearch problems.
What is Elasticsearch?
Elasticsearch is an open source distributed document store and search engine that stores and retrieves data structures in near real-time. Developed by Shay Banon and released in 2010, it relies heavily on Apache Lucene, a full-text search engine written in Java.
Elasticsearch represents data in the form of structured JSON documents, and makes full-text search accessible via RESTful API and web clients for languages like PHP, Python, and Ruby. It's also elastic in the sense that it's easy to scale horizontally—simply add more nodes to distribute the load. Today, many companies, including Wikipedia, eBay, GitHub, and Datadog, use it to store, search, and analyze large amounts of data on the fly.
Cost-effectively collect, process, search, and analyze logs at scale with Logging without Limits™.
The elements of Elasticsearch
Before we start exploring performance metrics, let's examine what makes Elasticsearch work. In Elasticsearch, a cluster is made up of one or more nodes, as illustrated below:
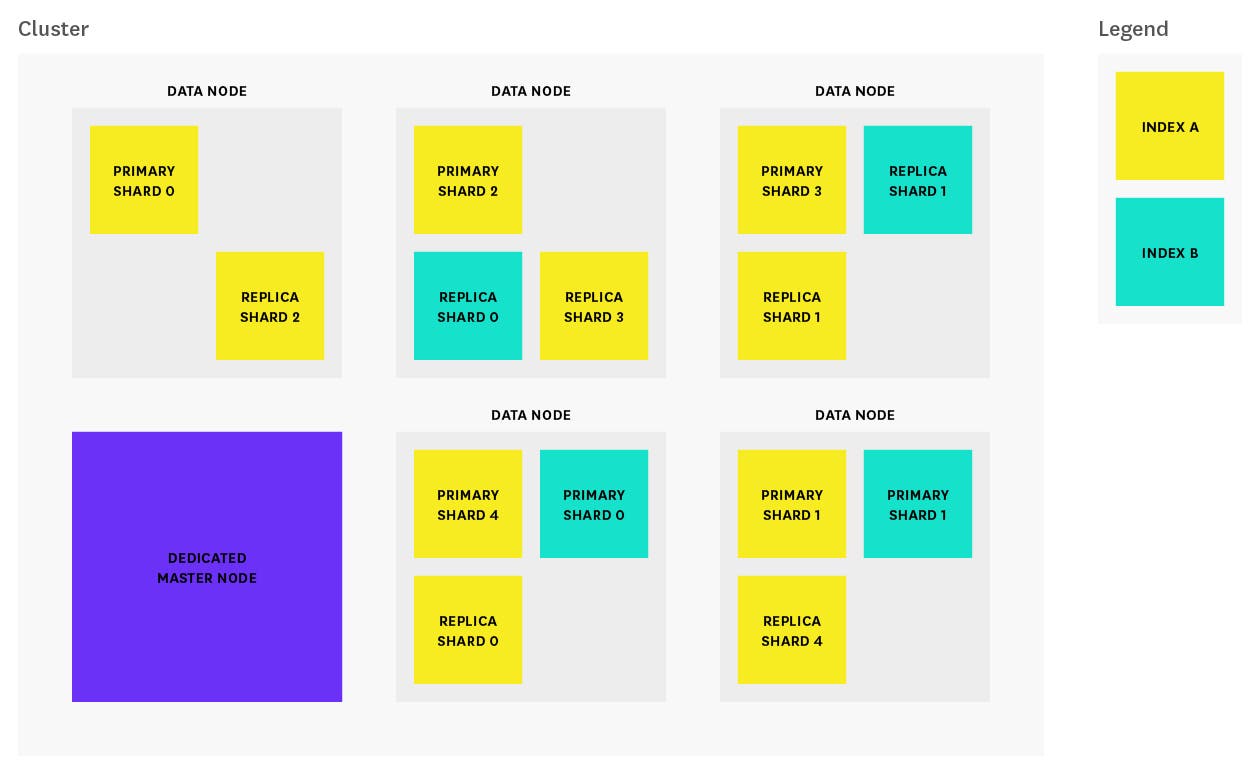
Each node is a single running instance of Elasticsearch, and its elasticsearch.yml configuration file designates which cluster it belongs to (cluster.name) and what type of node it can be. Any property (including cluster name) set in the configuration file can also be specified via command line argument. The cluster in the diagram above consists of one dedicated primary node and five data nodes.
The three most common types of nodes in Elasticsearch are:
Primary-eligible nodes: By default, every node is primary-eligible unless otherwise specified. Each cluster automatically elects a primary node from all of the primary-eligible nodes. In the event that the current primary node experiences a failure (such as a power outage, hardware failure, or an out-of-memory error), primary-eligible nodes elect a new primary. The primary node is responsible for coordinating cluster tasks like distributing shards across nodes, and creating and deleting indices. Any primary-eligible node is also able to function as a data node. However, in larger clusters, users may launch dedicated primary-eligible nodes that do not store any data (by adding
node.data: falseto the config file), in order to improve reliability. In high-usage environments, moving the primary role away from data nodes helps ensure that there will always be enough resources allocated to tasks that only primary-eligible nodes can handle.Data nodes: By default, every node is a data node that stores data in the form of shards (more about that in the section below) and performs actions related to indexing, searching, and aggregating data. In larger clusters, you may choose to create dedicated data nodes by adding
node.master: falseto the config file, ensuring that these nodes have enough resources to handle data-related requests without the additional workload of cluster-related administrative tasks.Client nodes: If you set
node.masterandnode.datato false, you will end up with a client node, which is designed to act as a load balancer that helps route indexing and search requests. Client nodes help shoulder some of the search workload so that data and primary-eligible nodes can focus on their core tasks. Depending on your use case, client nodes may not be necessary because data nodes are able to handle request routing on their own. However, adding client nodes to your cluster makes sense if your search/index workload is heavy enough to benefit from having dedicated client nodes to help route requests.
How Elasticsearch organizes data
In Elasticsearch, related data is often stored in the same index, which can be thought of as the equivalent of a logical wrapper of configuration. Each index contains a set of related documents in JSON format. Elasticsearch's secret sauce for full-text search is Lucene's inverted index. When a document is indexed, Elasticsearch automatically creates an inverted index for each field; the inverted index maps terms to the documents that contain those terms.
An index is stored across one or more primary shards, and zero or more replica shards, and each shard is a complete instance of Lucene, like a mini search engine.
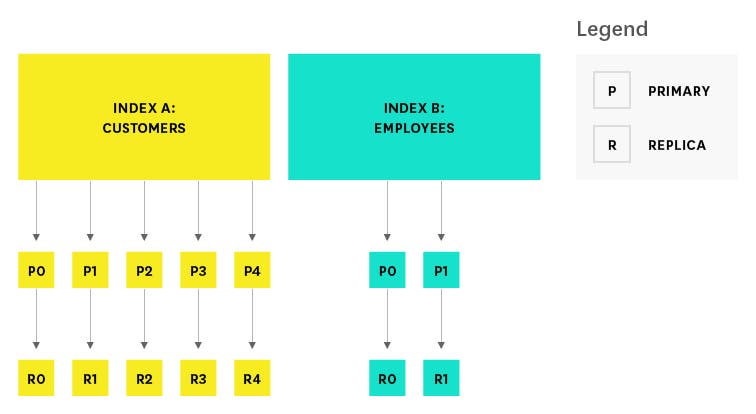
When creating an index, you can specify the number of primary shards, as well as the number of replicas per primary. The defaults are five primary shards per index, and one replica per primary. The number of primary shards cannot be changed once an index has been created, so choose carefully, or you will likely need to reindex later on. The number of replicas can be updated later on as needed. To protect against data loss, the primary node ensures that each replica shard is not allocated to the same node as its primary shard.
Key Elasticsearch performance metrics to monitor

Elasticsearch provides plenty of metrics that can help you detect signs of trouble and take action when you're faced with problems like unreliable nodes, out-of-memory errors, and long garbage collection times. A few key areas to monitor are:
This article references metric terminology from our Monitoring 101 series, which provides a framework for metric collection and alerting.
All of these metrics are accessible via Elasticsearch's API as well as single-purpose monitoring tools like Elastic's Marvel and universal monitoring services like Datadog. For details on how to collect these metrics using all of these methods, see Part 2 of this series.
Search performance metrics
Search requests are one of the two main request types in Elasticsearch, along with index requests. These requests are somewhat akin to read and write requests, respectively, in a traditional database system. Elasticsearch provides metrics that correspond to the two main phases of the search process (query and fetch). The diagrams below illustrate the path of a search request from start to finish.
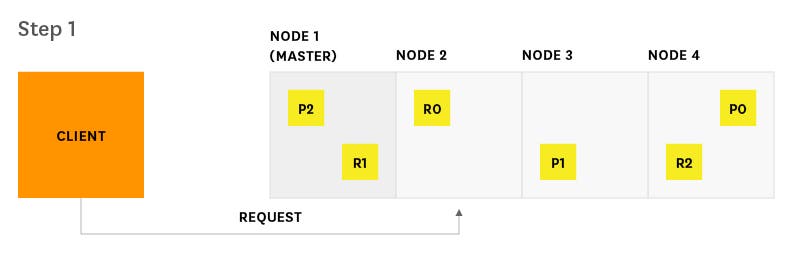
Client sends a search request to Node 2.
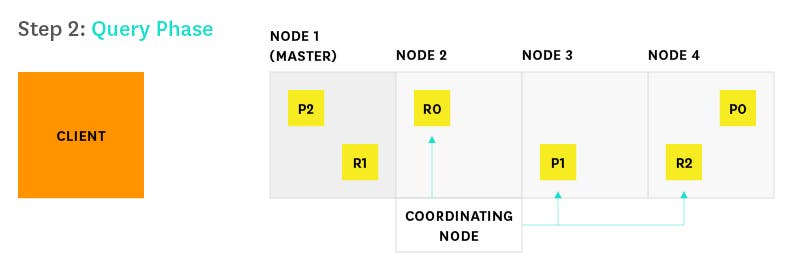
Node 2 (the coordinating node) sends the query to a copy (either replica or primary) of every shard in the index.
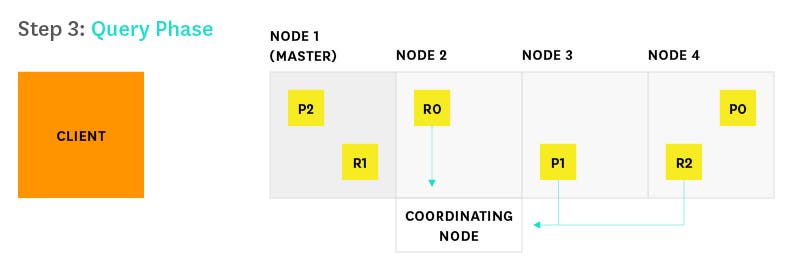
Each shard executes the query locally and delivers results to Node 2. Node 2 sorts and compiles them into a global priority queue.
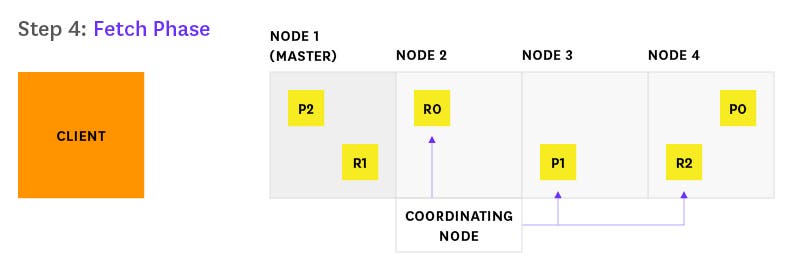
Node 2 finds out which documents need to be fetched and sends a multi GET request to the relevant shards.
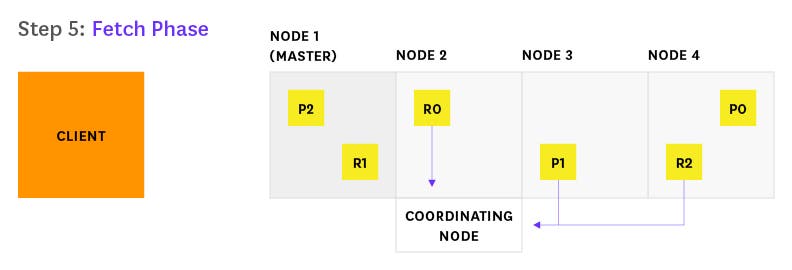
Each shard loads the documents and returns them to Node 2.

Node 2 delivers the search results to the client.
If you are using Elasticsearch mainly for search, or if search is a customer-facing feature that is key to your organization, you should monitor query latency and take action if it surpasses a threshold. It's important to monitor relevant metrics about queries and fetches that can help you determine how your searches perform over time. For example, you may want to track spikes and long-term increases in query requests, so that you can be prepared to tweak your configuration to optimize for better performance and reliability.
| Metric description | Name | Metric type |
|---|---|---|
| Total number of queries | indices.search.query_total | Work: Throughput |
| Total time spent on queries | indices.search.query_time_in_millis | Work: Performance |
| Number of queries currently in progress | indices.search.query_current | Work: Throughput |
| Total number of fetches | indices.search.fetch_total | Work: Throughput |
| Total time spent on fetches | indices.search.fetch_time_in_millis | Work: Performance |
| Number of fetches currently in progress | indices.search.fetch_current | Work: Throughput |
Search performance metrics to watch
Query load: Monitoring the number of queries currently in progress can give you a rough idea of how many requests your cluster is dealing with at any particular moment in time. Consider alerting on unusual spikes or dips that may point to underlying problems. You may also want to monitor the size of the search thread pool queue, which we will explain in further detail later on in this post.
Query latency: Though Elasticsearch does not explicitly provide this metric, monitoring tools can help you use the available metrics to calculate the average query latency by sampling the total number of queries and the total elapsed time at regular intervals. Set an alert if latency exceeds a threshold, and if it fires, look for potential resource bottlenecks, or investigate whether you need to optimize your queries.
Fetch latency: The second part of the search process, the fetch phase, should typically take much less time than the query phase. If you notice this metric consistently increasing, this could indicate a problem with slow disks, enriching of documents (highlighting relevant text in search results, etc.), or requesting too many results.
Indexing performance metrics
Indexing requests are similar to write requests in a traditional database system. If your Elasticsearch workload is write-heavy, it's important to monitor and analyze how effectively you are able to update indices with new information. Before we get to the metrics, let's explore the process by which Elasticsearch updates an index. When new information is added to an index, or existing information is updated or deleted, each shard in the index is updated via two processes: refresh and flush.
Index refresh
Newly indexed documents are not immediately made available for search. First they are written to an in-memory buffer where they await the next index refresh, which occurs once per second by default. The refresh process creates a new in-memory segment from the contents of the in-memory buffer (making the newly indexed documents searchable), then empties the buffer, as shown below.
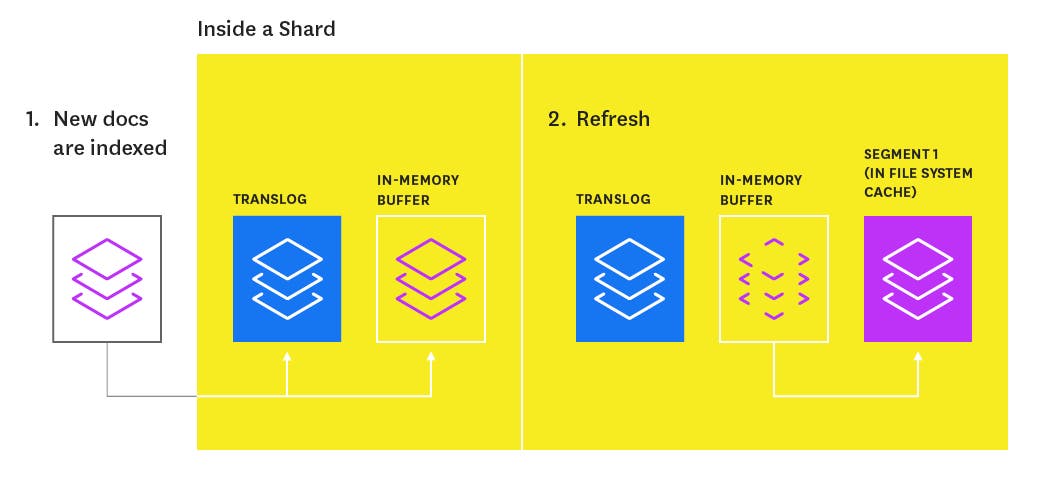
A special segment on segments
Shards of an index are composed of multiple segments. The core data structure from Lucene, a segment is essentially a change set for the index. These segments are created with every refresh and subsequently merged together over time in the background to ensure efficient use of resources (each segment uses file handles, memory, and CPU).
Segments are mini-inverted indices that map terms to the documents that contain those terms. Every time an index is searched, a primary or replica version of each shard must be searched by, in turn, searching every segment in that shard.
A segment is immutable, so updating a document means:
writing the information to a new segment during the refresh process
marking the old information as deleted
The old information is eventually deleted when the outdated segment is merged with another segment.
Index flush
At the same time that newly indexed documents are added to the in-memory buffer, they are also appended to the shard's translog: a persistent, write-ahead transaction log of operations. Every 30 minutes, or whenever the translog reaches a maximum size (by default, 512MB), a flush is triggered. During a flush, any documents in the in-memory buffer are refreshed (stored on new segments), all in-memory segments are committed to disk, and the translog is cleared.
The translog helps prevent data loss in the event that a node fails. It is designed to help a shard recover operations that may otherwise have been lost between flushes. The log is committed to disk every 5 seconds, or upon each successful index, delete, update, or bulk request (whichever occurs first).
The flush process is illustrated below:
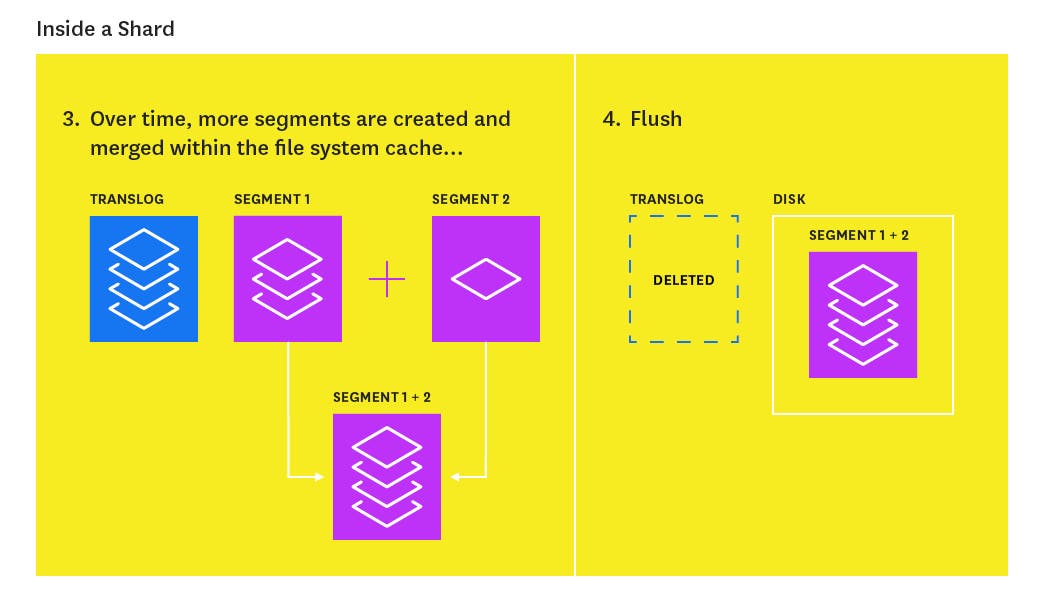
Elasticsearch provides a number of metrics that you can use to assess indexing performance and optimize the way you update your indices.
| Metric description | Name | Metric type |
|---|---|---|
| Total number of documents indexed | indices.indexing.index_total | Work: Throughput |
| Total time spent indexing documents | indices.indexing.index_time_in_millis | Work: Performance |
| Number of documents currently being indexed | indices.indexing.index_current | Work: Throughput |
| Total number of index refreshes | indices.refresh.total | Work: Throughput |
| Total time spent refreshing indices | indices.refresh.total_time_in_millis | Work: Performance |
| Total number of index flushes to disk | indices.flush.total | Work: Throughput |
| Total time spent on flushing indices to disk | indices.flush.total_time_in_millis | Work: Performance |
Indexing performance metrics to watch
Indexing latency: Elasticsearch does not directly expose this particular metric, but monitoring tools can help you calculate the average indexing latency from the available index_total and index_time_in_millis metrics. If you notice the latency increasing, you may be trying to index too many documents at one time (Elasticsearch's documentation recommends starting with a bulk indexing size of 5 to 15 megabytes and increasing slowly from there).
If you are planning to index a lot of documents and you don't need the new information to be immediately available for search, you can optimize for indexing performance over search performance by decreasing refresh frequency until you are done indexing. The index settings API enables you to temporarily disable the refresh interval:
curl -XPUT <nameofhost>:9200/<name_of_index>/_settings -d '{ "index" : { "refresh_interval" : "-1" }}'You can then revert back to the default value of "1s" once you are done indexing. This and other indexing performance tips will be explained in more detail in part 4 of this series.
Flush latency: Because data is not persisted to disk until a flush is successfully completed, it can be useful to track flush latency and take action if performance begins to take a dive. If you see this metric increasing steadily, it could indicate a problem with slow disks; this problem may escalate and eventually prevent you from being able to add new information to your index. You can experiment with lowering the index.translog.flush_threshold_size in the index's flush settings. This setting determines how large the translog size can get before a flush is triggered. However, if you are a write-heavy Elasticsearch user, you should use a tool like iostat or the Datadog Agent to keep an eye on disk IO metrics over time, and consider upgrading your disks if needed.
Memory usage and garbage collection
When running Elasticsearch, memory is one of the key resources you'll want to closely monitor. Elasticsearch and Lucene utilize all of the available RAM on your nodes in two ways: JVM heap and the file system cache. Elasticsearch runs in the Java Virtual Machine (JVM), which means that JVM garbage collection duration and frequency will be other important areas to monitor.
JVM heap: A Goldilocks tale
Elasticsearch stresses the importance of a JVM heap size that's "just right"—you don't want to set it too big, or too small, for reasons described below. In general, Elasticsearch's rule of thumb is allocating less than 50 percent of available RAM to JVM heap, and never going higher than 32 GB.
The less heap memory you allocate to Elasticsearch, the more RAM remains available for Lucene, which relies heavily on the file system cache to serve requests quickly. However, you also don't want to set the heap size too small because you may encounter out-of-memory errors or reduced throughput as the application faces constant short pauses from frequent garbage collections. Consult this guide, written by one of Elasticsearch's core engineers, to find tips for determining the correct heap size.
Elasticsearch's default installation sets a JVM heap size of 1 gigabyte, which is too small for most use cases. You can export your desired heap size as an environment variable and restart Elasticsearch:
$ export ES_HEAP_SIZE=10gThe other option is to set the JVM heap size (with equal minimum and maximum sizes to prevent the heap from resizing) on the command line every time you start up Elasticsearch:
$ ES_HEAP_SIZE="10g" ./bin/elasticsearchIn both of the examples shown, we set the heap size to 10 gigabytes. To verify that your update was successful, run:
$ curl -XGET http://<nameofhost>:9200/_cat/nodes?h=heap.maxThe output should show you the correctly updated max heap value.
Garbage collection
Elasticsearch relies on garbage collection processes to free up heap memory. If you want to learn more about JVM garbage collection, check out this guide.
Because garbage collection uses resources (in order to free up resources!), you should keep an eye on its frequency and duration to see if you need to adjust the heap size. Setting the heap too large can result in long garbage collection times; these excessive pauses are dangerous because they can lead your cluster to mistakenly register your node as having dropped off the grid.
| Metric description | Name | Metric type |
|---|---|---|
| Total count of young-generation garbage collections | jvm.gc.collectors.young.collection_count (jvm.gc.collectors.ParNew.collection_count prior to vers. 0.90.10) | Other |
| Total time spent on young-generation garbage collections | jvm.gc.collectors.young.collection_time_in_millis (jvm.gc.collectors.ParNew.collection_time_in_millis prior to vers. 0.90.10) | Other |
| Total count of old-generation garbage collections | jvm.gc.collectors.old.collection_count (jvm.gc.collectors.ConcurrentMarkSweep.collection_count prior to vers. 0.90.10) | Other |
| Total time spent on old-generation garbage collections | jvm.gc.collectors.old.collection_time_in_millis (jvm.gc.collectors.ConcurrentMarkSweep.collection_time_in_millis prior to vers. 0.90.10) | Other |
| Percent of JVM heap currently in use | jvm.mem.heap_used_percent | Resource: Utilization |
| Amount of JVM heap committed | jvm.mem.heap_committed_in_bytes | Resource: Utilization |
JVM metrics to watch
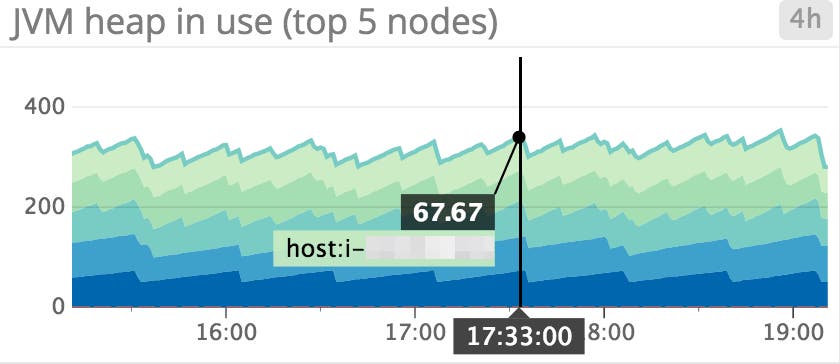
JVM heap in use: Elasticsearch is set up to initiate garbage collections whenever JVM heap usage hits 75 percent. As shown above, it may be useful to monitor which nodes exhibit high heap usage, and set up an alert to find out if any node is consistently using over 85 percent of heap memory; this indicates that the rate of garbage collection isn't keeping up with the rate of garbage creation. To address this problem, you can either increase your heap size (as long as it remains below the recommended guidelines stated above), or scale out the cluster by adding more nodes.
JVM heap used vs. JVM heap committed: It can be helpful to get an idea of how much JVM heap is currently in use, compared to committed memory (the amount that is guaranteed to be available). The amount of heap memory in use will typically take on a sawtooth pattern that rises when garbage accumulates and dips when garbage is collected. If the pattern starts to skew upward over time, this means that the rate of garbage collection is not keeping up with the rate of object creation, which could lead to slow garbage collection times and, eventually, OutOfMemoryErrors.
Garbage collection duration and frequency: Both young- and old-generation garbage collectors undergo "stop the world" phases, as the JVM halts execution of the program to collect dead objects. During this time, the node cannot complete any tasks. Because the primary node checks the status of every other node every 30 seconds, if any node's garbage collection time exceed 30 seconds, it will lead the primary to believe that the node has failed.
Memory usage
As mentioned above, Elasticsearch makes excellent use of any RAM that has not been allocated to JVM heap. Like Kafka, Elasticsearch was designed to rely on the operating system's file system cache to serve requests quickly and reliably.
A number of variables determine whether or not Elasticsearch successfully reads from the file system cache. If the segment file was recently written to disk by Elasticsearch, it is already in the cache. However, if a node has been shut off and rebooted, the first time a segment is queried, the information will most likely have to be read from disk. This is one reason why it's important to make sure your cluster remains stable and that nodes do not crash.
Generally, it's very important to monitor memory usage on your nodes, and give Elasticsearch as much RAM as possible, so it can leverage the speed of the file system cache without running out of space.
Host-level network and system metrics
| Name | Metric type |
|---|---|
| Available disk space | Resource: Utilization |
| I/O utilization | Resource: Utilization |
| CPU usage | Resource: Utilization |
| Network bytes sent/received | Resource: Utilization |
| Open file descriptors | Resource: Utilization |
While Elasticsearch provides many application-specific metrics via API, you should also collect and monitor several host-level metrics from each of your nodes.
Host metrics to alert on
Disk space: This metric is particularly important if your Elasticsearch cluster is write-heavy. You don't want to run out of disk space because you won't be able to insert or update anything and the node will fail. If less than 20 percent is available on a node, you may want to use a tool like Curator to delete certain indices residing on that node that are taking up too much valuable disk space.
If deleting indices is not an option, the other alternative is to add more nodes, and let the primary node take care of automatically redistributing shards across the new nodes (though you should note that this creates additional work for a busy primary node). Also, keep in mind that documents with analyzed fields (fields that require textual analysis—tokenizing, removing punctuation, and the like) take up significantly more disk space than documents with non-analyzed fields (exact values).
Host metrics to watch
I/O utilization: As segments are created, queried, and merged, Elasticsearch does a lot of writing to and reading from disk. For write-heavy clusters with nodes that are continually experiencing heavy I/O activity, Elasticsearch recommends using SSDs to boost performance.

CPU utilization on your nodes: It can be helpful to visualize CPU usage in a heatmap (like the one shown above) for each of your node types. For example, you could create three different graphs to represent each group of nodes in your cluster (data nodes, primary-eligible nodes, and client nodes, for example) to see if one type of node is being overloaded with activity in comparison to another. If you see an increase in CPU usage, this is usually caused by a heavy search or indexing workload. Set up a notification to find out if your nodes’ CPU usage is consistently increasing, and add more nodes to redistribute the load if needed.
Network bytes sent/received: Communication between nodes is a key component of a balanced cluster. You'll want to monitor the network to make sure it's healthy and that it keeps up with the demands on your cluster (e.g., as shards are replicated or rebalanced across nodes). Elasticsearch provides transport metrics about cluster communication, but you can also look at the rate of bytes sent and received to see how much traffic your network is receiving.
Open file descriptors: File descriptors are used for node-to-node communications, client connections, and file operations. If this number reaches your system's max capacity, then new connections and file operations will not be possible until old ones have closed. If over 80 percent of available file descriptors are in use, you may need to increase the system’s max file descriptor count. Most Linux systems ship with only 1,024 file descriptors allowed per process. When using Elasticsearch in production, you should reset your OS file descriptor count to something much larger, like 64,000.
HTTP connections
| Metric description | Name | Metric type |
|---|---|---|
| Number of HTTP connections currently open | http.current_open | Resource: Utilization |
| Total number of HTTP connections opened over time | http.total_opened | Resource: Utilization |
Requests sent in any language but Java will communicate with Elasticsearch using RESTful API over HTTP. If the total number of opened HTTP connections is constantly increasing, it could indicate that your HTTP clients are not properly establishing persistent connections. Reestablishing connections adds extra milliseconds or even seconds to your request response time. Make sure your clients are configured properly to avoid negative impact on performance, or use one of the official Elasticsearch clients, which already properly configure HTTP connections.
Cluster health and node availability
| Metric description | Name | Metric type |
|---|---|---|
| Cluster status (green, yellow, red) | cluster.health.status | Other |
| Number of nodes | cluster.health.number_of_nodes | Resource: Availability |
| Number of initializing shards | cluster.health.initializing_shards | Resource: Availability |
| Number of unassigned shards | cluster.health.unassigned_shards | Resource: Availability |
Cluster status: If the cluster status is yellow, at least one replica shard is unallocated or missing. Search results will still be complete, but if more shards disappear, you may lose data.
A red cluster status indicates that at least one primary shard is missing, and you are missing data, which means that searches will return partial results. You will also be blocked from indexing into that shard. Consider setting up an alert to trigger if status has been yellow for more than 5 min or if the status has been red for the past minute.
Initializing and unassigned shards: When you first create an index, or when a node is rebooted, its shards will briefly be in an "initializing" state before transitioning to a status of "started" or "unassigned", as the primary node attempts to assign shards to nodes in the cluster. If you see shards remain in an initializing or unassigned state too long, it could be a warning sign that your cluster is unstable.
Resource saturation and errors
Elasticsearch nodes use thread pools to manage how threads consume memory and CPU. Since thread pool settings are automatically configured based on the number of processors, it usually doesn't make sense to tweak them. However, it's a good idea to keep an eye on queues and rejections to find out if your nodes aren't able to keep up; if so, you may want to add more nodes to handle all of the concurrent requests. Fielddata and filter cache usage is another area to monitor, as evictions may point to inefficient queries or signs of memory pressure.
Thread pool queues and rejections
Each node maintains many types of thread pools; the exact ones you'll want to monitor will depend on your particular usage of Elasticsearch. In general, the most important ones to monitor are search, merge, and bulk (also known as the write thread pool, depending on your version), which correspond to the request type (search, and merge and bulk/write operations). As of version 6.3.x+, the bulk thread pool is now known as the write thread pool. The write thread pool handles each write request, whether it writes/updates/deletes a single document or many documents (in a bulk operation). Starting in version 7.x, the index thread pool will be deprecated, but you may also want to monitor this thread pool if you're using an earlier version of Elasticsearch (prior to 6.x).
The size of each thread pool's queue represents how many requests are waiting to be served while the node is currently at capacity. The queue allows the node to track and eventually serve these requests instead of discarding them. Thread pool rejections arise once the thread pool's maximum queue size (which varies based on the type of thread pool) is reached.
| Metric description | Name | Metric type |
|---|---|---|
| Number of queued threads in a thread pool | thread_pool.search.queuethread_pool.merge.queuethread_pool.write.queue (or thread_pool.bulk.queue*) thread_pool.index.queue* | Resource: Saturation |
| Number of rejected threads a thread pool | thread_pool.search.rejectedthread_pool.merge.rejectedthread_pool.write.rejected (or thread_pool.bulk.rejected*) thread_pool.index.rejected* | Resource: Error |
| *Prior to version 6.3.x |
Metrics to watch
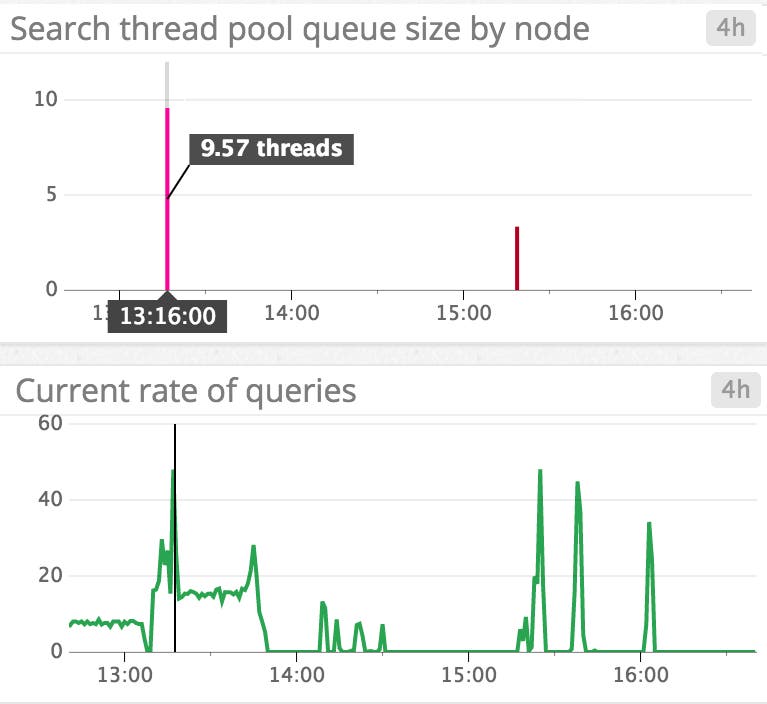
Thread pool queues: Large queues are not ideal because they use up resources and also increase the risk of losing requests if a node goes down. If you see the number of queued and rejected threads increasing steadily, you may want to try slowing down the rate of requests (if possible), increasing the number of processors on your nodes, or increasing the number of nodes in the cluster. As shown in the screenshot below, query load spikes correlate with spikes in search thread pool queue size, as the node attempts to keep up with rate of query requests.
Bulk rejections and bulk queues: Bulk operations are a more efficient way to send many requests at one time. Generally, if you want to perform many actions (create an index, or add, update, or delete documents), you should try to send the requests as a bulk operation instead of many individual requests.
Bulk rejections are usually related to trying to index too many documents in one bulk request. According to Elasticsearch's documentation, bulk rejections are not necessarily something to worry about. However, you should try implementing a linear or exponential backoff strategy to efficiently deal with bulk rejections.
Cache usage metrics
Each query request is sent to every shard in an index, which then hits every segment of each of those shards. Elasticsearch caches queries on a per-segment basis to speed up response time. On the flip side, if your caches hog too much of the heap, they may slow things down instead of speeding them up!
In Elasticsearch, each field in a document can be stored in one of two forms: as an exact value or as full text. An exact value, such as a timestamp or a year, is stored exactly the way it was indexed because you do not expect to receive to query 1/1/16 as "January 1st, 2016." If a field is stored as full text, that means it is analyzed—basically, it is broken down into tokens, and, depending on the type of analyzer, punctuation and stop words like "is" or "the" may be removed. The analyzer converts the field into a normalized format that enables it to match a wider range of queries.
For example, let's say that you have an index that contains a type called location; each document of the type location contains a field, city, which is stored as an analyzed string. You index two documents: one with "St. Louis" in the city field, and the other with "St. Paul". Each string would be lowercased and transformed into tokens without punctuation. The terms are stored in an inverted index that looks something like this:
| Term | Doc1 | Doc2 |
|---|---|---|
| st | x | x |
| louis | x | |
| paul | x |
The benefit of analysis is that you can search for "st." and the results would show that both documents contain the term. If you had stored the city field as an exact value, you would have had to search for the exact term, "St. Louis", or "St. Paul", in order to see the resulting documents.
Elasticsearch uses two main types of caches to serve search requests more quickly: fielddata and filter.
Fielddata cache
The fielddata cache is used when sorting or aggregating on a field, a process that basically has to uninvert the inverted index to create an array of every field value per field, in document order. For example, if we wanted to find a list of unique terms in any document that contained the term "st" from the example above, we would:
Scan the inverted index to see which documents contain that term (in this case, Doc1 and Doc2)
For each of the documents found in step 1, go through every term in the index to collect tokens from that document, creating a structure like the below:
| Doc | Terms |
|---|---|
| Doc1 | st, louis |
| Doc2 | st, paul |
Now that the inverted index has been "uninverted," compile the unique tokens from each of the docs (st, louis, and paul). Compiling fielddata like this can consume a lot of heap memory, especially with large numbers of documents and terms. All of the field values are loaded into memory.
For versions prior to 1.3, the fielddata cache size was unbounded. Starting in version 1.3, Elasticsearch added a fielddata circuit breaker that is triggered if a query tries to load fielddata that would require over 60 percent of the heap.
Filter cache
Filter caches also use JVM heap. In versions prior to 2.0, Elasticsearch automatically cached filtered queries with a max value of 10 percent of the heap, and evicted the least recently used data. Starting in version 2.0, Elasticsearch automatically began optimizing its filter cache, based on frequency and segment size (caching only occurs on segments that have fewer than 10,000 documents or less than 3 percent of total documents in the index). As such, filter cache metrics are only available to Elasticsearch users who are using a version prior to 2.0.
For example, a filter query could return only the documents for which values in the year field fall in the range 2000–2005. During the first execution of a filter query, Elasticsearch will create a bitset of which documents match the filter (1 if the document matches, 0 if not). Subsequent executions of queries with the same filter will reuse this information. Whenever new documents are added or updated, the bitset is updated as well. If you are using a version of Elasticsearch prior to 2.0, you should keep an eye on the filter cache as well as eviction metrics (more about that below).
| Metric description | Name | Metric type |
|---|---|---|
| Size of the fielddata cache (bytes) | indices.fielddata.memory_size_in_bytes | Resource: Utilization |
| Number of evictions from the fielddata cache | indices.fielddata.evictions | Resource: Saturation |
| Size of the filter cache (bytes) (only pre-version 2.x) | indices.filter_cache.memory_size_in_bytes | Resource: Utilization |
| Number of evictions from the filter cache (only pre-version 2.x) | indices.filter_cache.evictions | Resource: Saturation |
Cache metrics to watch
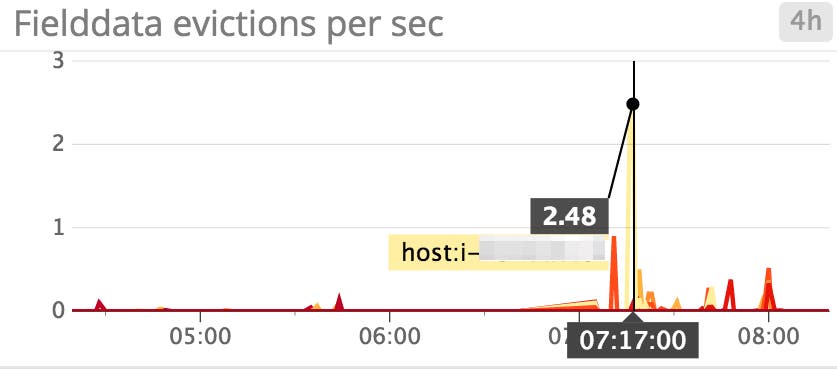
Fielddata cache evictions: Ideally, you want to limit the number of fielddata evictions because they are I/O intensive. If you're seeing a lot of evictions and you cannot increase your memory at the moment, Elasticsearch recommends a temporary fix of limiting fielddata cache to 20 percent of heap; you can do so in your config/elasticsearch.yml file. When fielddata reaches 20 percent of the heap, it will evict the least recently used fielddata, which then allows you to load new fielddata into the cache.
Elasticsearch also recommends using doc values whenever possible because they serve the same purpose as fielddata. However, because they are stored on disk, they do not rely on JVM heap. Although doc values cannot be used for analyzed string fields, they do save fielddata usage when aggregating or sorting on other types of fields. In version 2.0 and later, doc values are automatically built at document index time, which has reduced fielddata/heap usage for many users. However, if you are using a version between 1.0 and 2.0, you can also benefit from this feature—simply remember to enable them when creating a new field in an index.
Filter cache evictions: As mentioned earlier, filter cache eviction metrics are only available if you are using a version of Elasticsearch prior to 2.0. Each segment maintains its own individual filter cache. Since evictions are costlier operations on large segments than small segments, there’s no clear-cut way to assess how serious each eviction may be. However, if you see evictions occurring more often, this may indicate that you are not using filters to your best advantage—you could just be creating new ones and evicting old ones on a frequent basis, defeating the purpose of even using a cache. You may want to look into tweaking your queries (for example, using a bool query instead of an and/or/not filter).
Pending tasks
| Metric description | Name | Metric type |
|---|---|---|
| Number of pending tasks | pending_task_total | Resource: Saturation |
| Number of urgent pending tasks | pending_tasks_priority_urgent | Resource: Saturation |
| Number of high-priority pending tasks | pending_tasks_priority_high | Resource: Saturation |
Pending tasks can only be handled by primary nodes. Such tasks include creating indices and assigning shards to nodes. Pending tasks are processed in priority order—urgent comes first, then high priority. They start to accumulate when the number of changes occurs more quickly than the primary can process them. You want to keep an eye on this metric if it keeps increasing. The number of pending tasks is a good indication of how smoothly your cluster is operating. If your primary node is very busy and the number of pending tasks doesn't subside, it can lead to an unstable cluster.
Unsuccessful GET requests
| Metric description | Name | Metric type |
|---|---|---|
| Total number of GET requests where the document was missing | indices.get.missing_total | Work: Error |
| Total time spent on GET requests where the document was missing | indices.get.missing_time_in_millis | Work: Error |
A GET request is more straightforward than a normal search request—it retrieves a document based on its ID. An unsuccessful get-by-ID request means that the document ID was not found. You shouldn't usually have a problem with this type of request, but it may be a good idea to keep an eye out for unsuccessful GET requests when they happen.
Conclusion
In this post, we’ve covered some of the most important areas of Elasticsearch to monitor as you grow and scale your cluster:
Search and indexing performance
Memory and garbage collection
Host-level system and network metrics
Cluster health and node availability
Resource saturation and errors
As you monitor Elasticsearch metrics along with node-level system metrics, you will discover which areas are the most meaningful for your specific use case. Read Part 2 to learn how to start collecting and visualizing the Elasticsearch metrics that matter most to you, or check out Part 3 to see how you can monitor Elasticsearch metrics, request traces, and logs in one platform. In Part 4, we'll discuss how to solve five common Elasticsearch performance and scaling problems.
Source Markdown for this post is available on GitHub. Questions, corrections, additions, etc.? Please let us know.

