
Emily Chang
Editor’s note: Elastisearch uses the term “master node” to describe its architecture and certain metric names. Datadog does not use this term. Within this blog post, we will refer to this term as “leader node”, except for the sake of clarity in instances where we must reference a specific metric name.
This post is part 3 of a 4-part series on monitoring Elasticsearch performance. Part 1 provides an overview of Elasticsearch and its key performance metrics, Part 2 explains how to collect these metrics, and Part 4 describes how to solve five common Elasticsearch problems.If you’ve read our post on collecting Elasticsearch metrics, you already know that the Elasticsearch APIs are a quick way to gain a snapshot of performance metrics at any particular moment in time. However, to truly get a grasp on performance, you need to track Elasticsearch metrics over time and monitor them in context with the rest of your infrastructure.
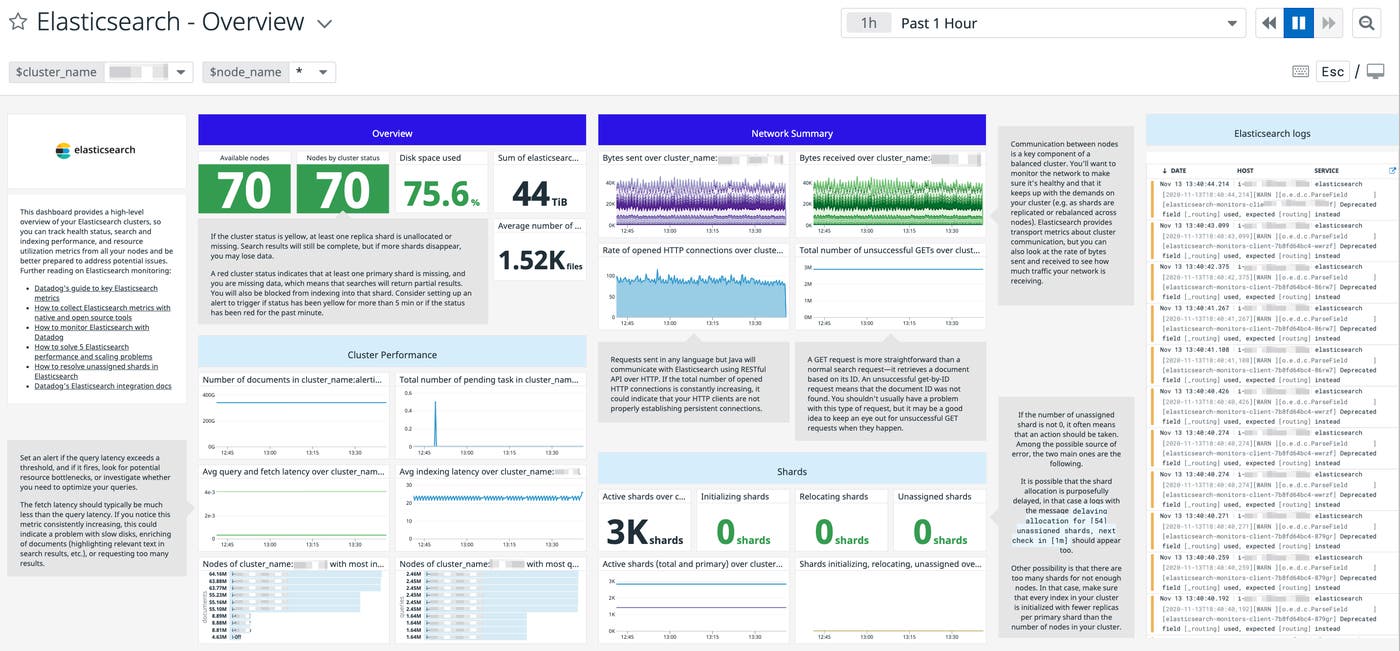
This post will show you how to set up Datadog to automatically collect the key metrics discussed in Part 1 of this series. We’ll also show you how to use Datadog to collect and monitor distributed request traces and logs from Elasticsearch. Finally, we’ll walk through creating alerts and using tags to effectively monitor your clusters by focusing on the metrics that matter most to you.
Cost-effectively collect, process, search, and analyze logs at scale with Logging without Limits™.
Set up Datadog to fetch Elasticsearch metrics
Datadog’s integration enables you to automatically collect, tag, and graph all of the performance metrics covered in Part 1, and correlate that data with the rest of your infrastructure.
Install the Datadog Agent
The Datadog Agent is open source software that collects and reports metrics, request traces, and logs from each of your nodes, so you can view and monitor them in one place.
Installing the Agent usually only takes a single command. View installation instructions for various platforms here. You can also install the Agent automatically with configuration management tools like Chef or Puppet.
Configure the Agent
After you have installed the Agent, it’s time to create your integration configuration file. In your Agent integration configuration directory, you should see an elastic.d subdirectory that contains a sample Elasticsearch config file named conf.yaml.example. Make a copy of the file in the same directory and save it as conf.yaml.
Modify conf.yaml with your instance URL, and set pshard_stats to true if you wish to collect metrics specific to your primary shards, which are prefixed with elasticsearch.primaries. For example, elasticsearch.primaries.docs.count tells you the document count across all primary shards, whereas elasticsearch.docs.count is the total document count across all primary and replica shards. In the example configuration file below, we’ve indicated that we want to collect primary shard metrics. We have also added two custom tags:elasticsearch-role:data-node, to indicate that this is a data node, and service:gob_test to tag metrics with the name of our Elasticsearch service. We will need to use this service tag again when we set up Datadog APM.
init_config:
instances:
- url: http://localhost:9200 # username: username # password: password # cluster_stats: false pshard_stats: true # pending_task_stats: true # ssl_verify: false # ssl_cert: /path/to/cert.pem # ssl_key: /path/to/cert.key tags: - 'elasticsearch-role:data-node' - 'service:gob_test'Save your changes and verify that the integration is properly configured by restarting the Agent and running the Datadog status command. If everything is working properly, you should see an elastic section in the output, similar to the below:
Running Checks ==============
[...]
elastic ------- Total Runs: 1 Metrics: 179, Total Metrics: 179 Events: 1, Total Events: 1 Service Checks: 2, Total Service Checks: 2The last step is to navigate to Elasticsearch’s integration tile in your Datadog account and click on the Install Integration button under the “Configuration” tab. Once the Agent is up and running, you should see your hosts reporting metrics in Datadog, as shown below:

Dig into the metrics!
Once the Agent is configured on your nodes, you should see an Elasticsearch screenboard among your list of integration dashboards.
Datadog’s out-of-the-box dashboard displays many of the key performance metrics presented in Part 1 and is a great starting point to help you gain more visibility into your clusters. You may want to clone and customize it by adding system-level metrics from your nodes, like I/O utilization, CPU, and memory usage, as well as metrics from other elements of your infrastructure.
Tag your metrics
In addition to any tags assigned or inherited from your nodes’ other integrations (e.g., Chef role, AWS availability-zone, etc.), the Agent will automatically tag your Elasticsearch metrics with host and url. Starting in Agent 5.9.0, Datadog also tags your Elasticsearch metrics with cluster_name and node_name, which are pulled from cluster.name and node.name in the node’s Elasticsearch configuration file (located in elasticsearch/config). If you do not provide a cluster.name, it will default to elasticsearch.
You can also add custom tags in the conf.yaml file, such as the node type and environment, in order to slice and dice your metrics and alert on them accordingly.
For example, if your cluster includes dedicated leader, data, and client nodes, you may want to create an elasticsearch-role tag for each type of node in the conf.yaml configuration file. You can then use these tags in Datadog to view and alert on metrics from only one type of node at a time.
Now that you are collecting health and performance metrics from your Elasticsearch clusters, you can get even more comprehensive insights into Elasticsearch by deploying APM and log management. Distributed tracing and APM will help you track the applications and services that rely on your clusters, while log management can provide more visibility into log data from your clusters.
Tracing Elasticsearch queries with APM
Starting in version 5.13+ of the Datadog Agent, APM is already enabled by default. Tagging your APM metrics and request traces with the correct environment helps provide context and also enables you to quickly isolate your service-level data in the Datadog UI. To configure tagging for APM, you’ll need to update the apm_config section of the Datadog Agent configuration file (datadog.yaml). The location of your Agent config file varies according to your platform; consult the documentation for more details.
Navigate to the apm_config section of your datadog.yaml file and add your desired environment:
# Trace Agent Specific Settings#apm_config:# Whether or not the APM Agent should run enabled: true# The environment tag that Traces should be tagged with# Will inherit from "env" tag if none is applied here env: gobtestingSave and exit the file. The Agent will now add this env tag to any request traces and application performance metrics it collects from this host.
Auto-instrument your application
Datadog APM includes support for applications in a growing number of languages, including auto-instrumentation of popular frameworks and libraries. This example shows you how to deploy Datadog APM on a Flask application that uses the Python Elasticsearch library.
Install the required Python libraries
You’ll need to install Datadog’s open source Python tracing client in your environment, as well as the Blinker library, which the Agent will use to trace requests to the Flask app:
pip install ddtracepip install blinkerConfigure auto-instrumentation in your Flask app
Now you simply need to import the ddtrace and blinker libraries, and create a TraceMiddleware object that will automatically time requests and template rendering.
from flask import Flask, render_template, redirect, request, url_forfrom elasticsearch import Elasticsearchimport blinkerfrom ddtrace import tracerfrom ddtrace.contrib.flask import TraceMiddlewarefrom ddtrace import patch_all
patch_all()
app = Flask(__name__)
tracer.debug_logging = Truetraced_app = TraceMiddleware(app, tracer, service="gob_test", distributed_tracing=False)Note that we have specified the same service as the one we configured earlier in the Agent integration file for Elasticsearch (elastic.d/conf.yaml). We are also using the patch_all() method to auto-instrument the elasticsearch library. Save and exit the file.
Off to the traces
To deploy Datadog APM on the Flask app, you simply need to preface your usual startup command with ddtrace-run:
ddtrace-run python app.pyThe Agent will start auto-instrumenting requests to your Flask application and reporting them to Datadog, so that you can visualize and alert on performance metrics. You should see your services appear in the page for the environment you specified in the apm_config section of your Datadog Agent configuration file.

If you click on the elasticsearch service, you can see an overview of key service-level metrics (request throughput, errors, and latency), as well as a latency distribution of requests to this service. In the resource stats section, you can see a list of which resources, or endpoints, the application has accessed. In this case, the resources correspond to the Flask application’s requests to the Python Elasticsearch library. For example, the GET /dd_blogs/_search endpoint tracks the performance of search requests sent to the dd_blogs index.
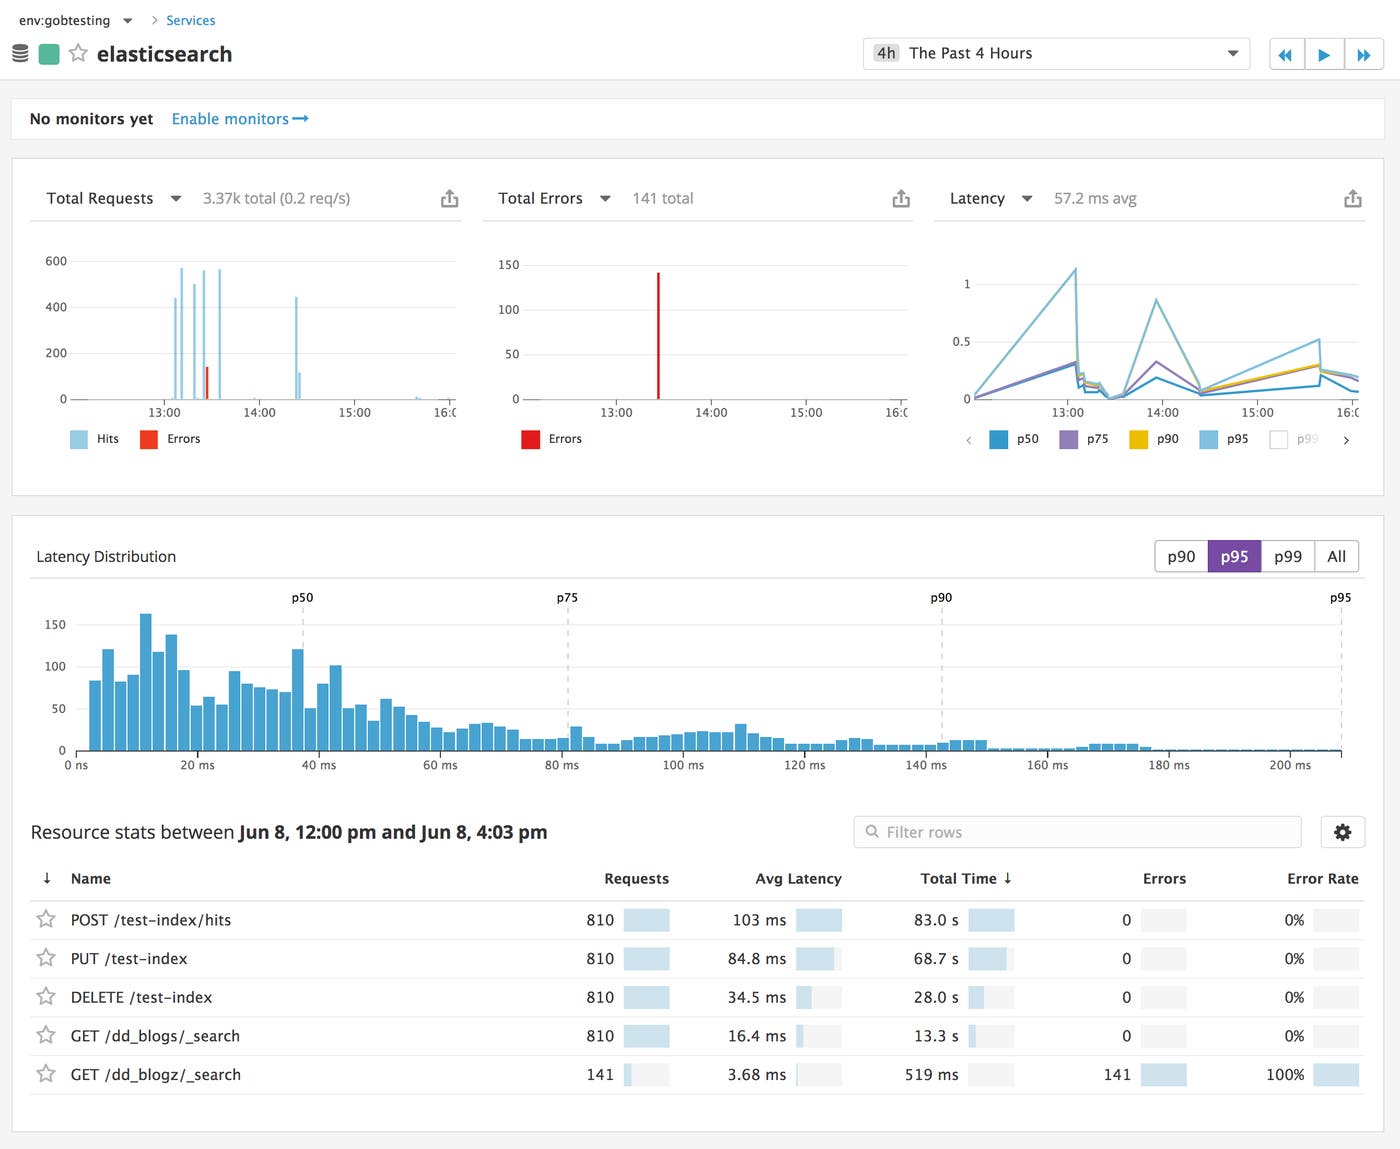
In this case, it looks like a spike in errors occurred around 1:27 p.m. The resource stats indicate that one particular endpoint returned the greatest number of errors: GET /dd_blogz/_search.
You can investigate further by clicking on the name of the resource and then inspecting a sampled request trace in more detail. If you click to inspect a flame graph, you can see the full stack trace, and use that information to help you troubleshoot the issue. In this example, the request to Elasticsearch returned a 404 error because it was trying to query a nonexistent index (dd_blogz). Flask automatically handles this HTTP exception by returning a 500 Internal Server Error. You can also see the body of the Elasticsearch query in the metadata below the stack trace.
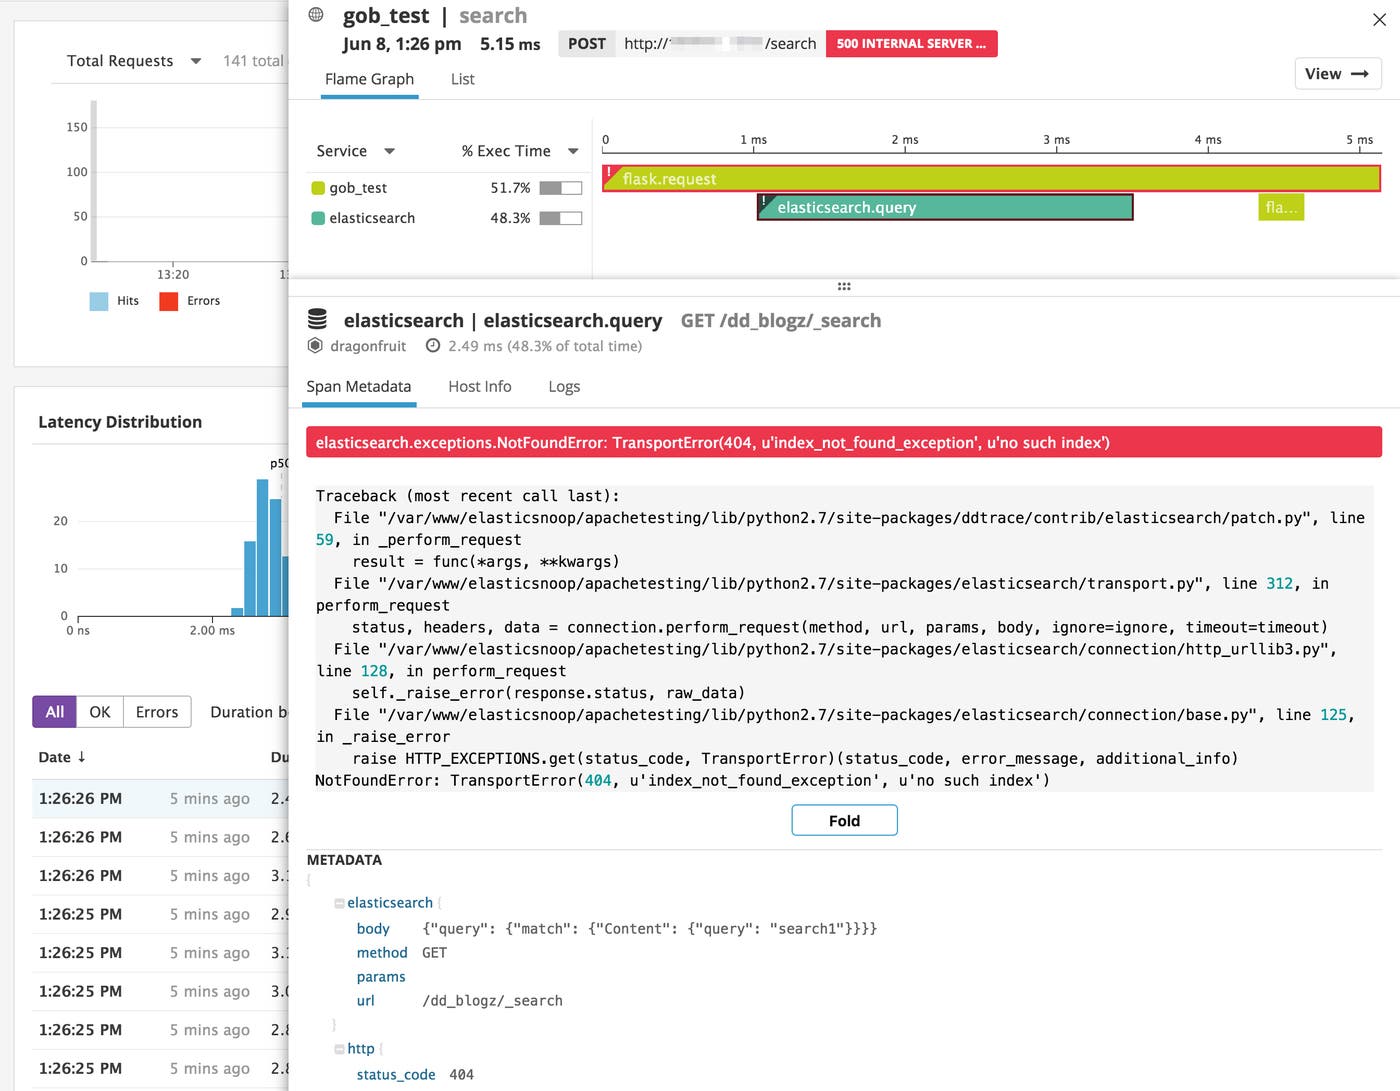
In addition to troubleshooting errors, you can also use distributed tracing and APM to optimize your code. You can inspect detailed flame graphs to identify bottlenecks in slow requests, by analyzing how long each request spent accessing services like Elasticsearch.
In addition to application-level performance metrics and request traces, you can get even more context around Elasticsearch health and performance by implementing log processing and analytics. The next section will show you how to set up Datadog to collect and parse information from your Elasticsearch logs.
Getting more visibility into Elasticsearch with logs
Logs can help provide more context around the real-time health and performance of your Elasticsearch clusters. The Elasticsearch integration includes a log processing pipeline that automatically parses your logs for key information, so you can analyze log activity and correlate it with other sources of monitoring data. Setting up the Agent to collect logs from Elasticsearch takes just a few simple changes to your configuration.
Enable log collection in the Agent
As of version 6.x, log management features are bundled in the Datadog Agent, but log collection is disabled by default. To enable the Agent to collect logs, set the logs_enabled parameter to true in your Agent configuration file (datadog.yaml):
# Logs agent is disabled by defaultlogs_enabled: trueSave and exit the file. The Agent is now able to collect logs, but we still need to tell it where to access those logs.
Configure the Agent to collect Elasticsearch logs
As a final step in configuring the Agent to report logs from Elasticsearch, you need to make a few updates to the Agent’s Elasticsearch integration file (elastic.d/conf.yaml).
In your Elasticsearch integration file, you should see a section that begins with logs, where you can add information that informs the Agent where it can collect logs.
[...]logs: - type: file path: /path/to/<ES_CLUSTER_NAME>_cluster.log source: elasticsearch service: gob_test - type: file path: /path/to/<ES_CLUSTER_NAME>_cluster_index_search_slowlog.log source: elasticsearch service: gob_testThis example configures the Agent to collect logs from two sources: the Elasticsearch cluster’s main log (<ES_CLUSTER_NAME>_cluster.log) and the search slow log (<ES_CLUSTER_NAME>_cluster_index_search_slowlog.log). If you have an indexing-heavy workload, you may choose to collect logs from the index slow log (<ES_CLUSTER_NAME>_cluster_index_indexing_slowlog.log) instead of, or in addition to, the search slow log.
The source parameter is associated with the logging integration (elasticsearch in this case), and will ensure that your logs are automatically routed to the correct processing pipeline. The Agent will also associate each Elasticsearch log entry with the service (service:gob_test). This unifying tag also makes it easier to pivot between correlated logs and request traces that come from the same source.
Save the file and restart the Agent to ensure that your changes take effect.
Exploring your Elasticsearch logs in Datadog
You should see your Elasticsearch logs flowing into the Log Explorer of your Datadog account. You can click on the sidebar to filter for logs from Elasticsearch (source:elasticsearch) and the name of your service. The example below shows a search slow log entry, which has been parsed for key attributes like the duration of the request (in nanoseconds), and the index and shard that actually received this request. The message shows you the body of the search query, along with the number of shards it was executed on.
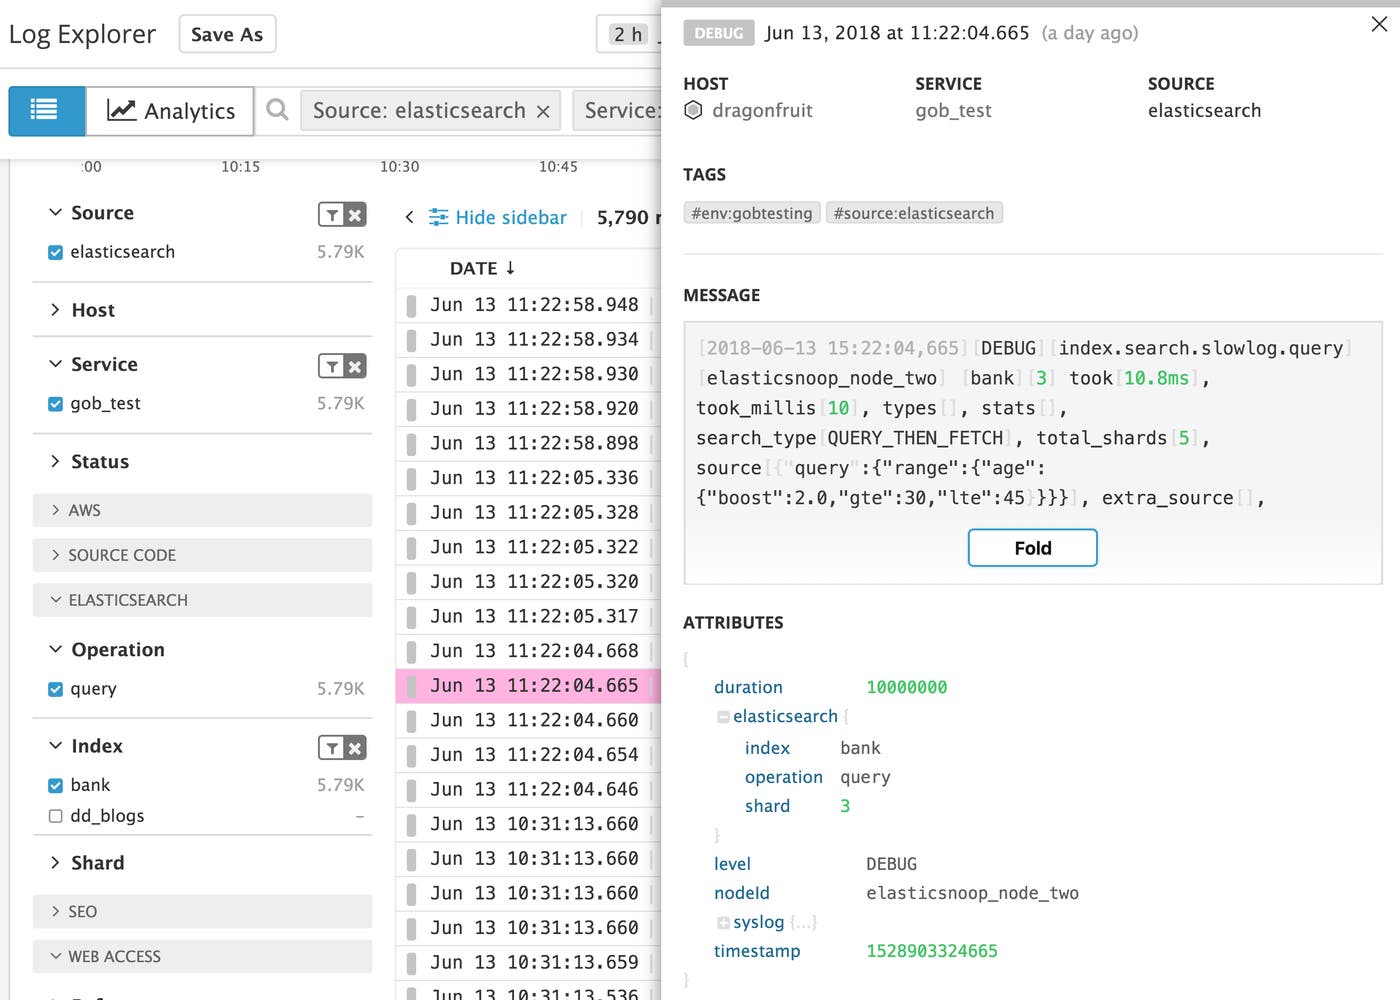
Since the queried Elasticsearch index is automatically parsed as a facet, we can use this facet to analyze the slow query duration metric in a graph. To switch to the analytics view, click on the Analytics icon in the upper-left corner of the Log Explorer. Below, we can see the duration of slow queries, collected from the Elasticsearch slow query logs, in a timeseries graph. The graph breaks down the metric by the Index facet so we can see exactly which indices were associated with requests that crossed the undesirable latency threshold specified in the slow query log configuration.
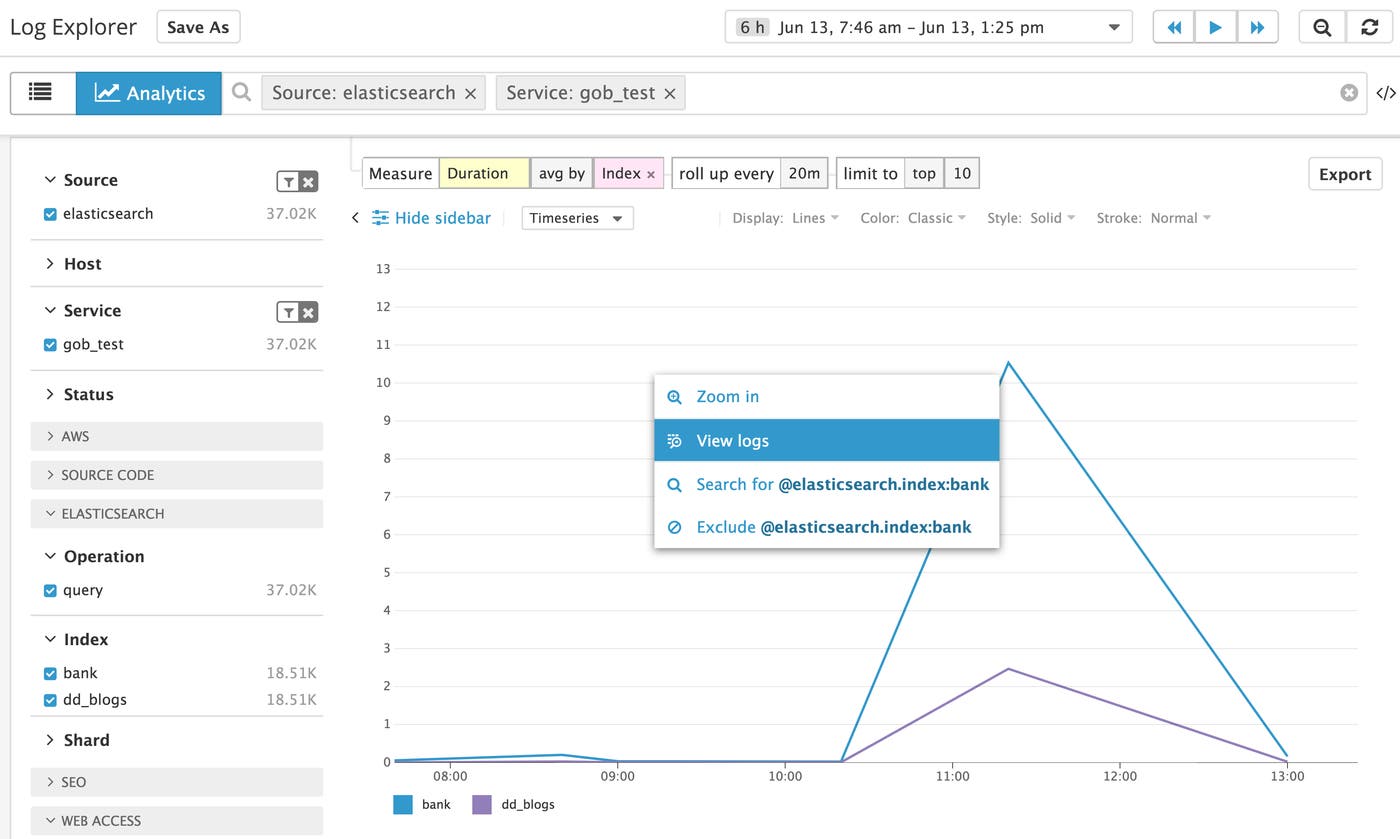
If you see a spike in duration, you can click on the graph to switch back to inspecting the actual log events that were generated by those slow searches. You can export this graph to any dashboard in Datadog, which will enable you to correlate Elasticsearch service-level latency with data from 1,000+ technologies across the rest of your infrastructure.
Building custom Elasticsearch dashboards
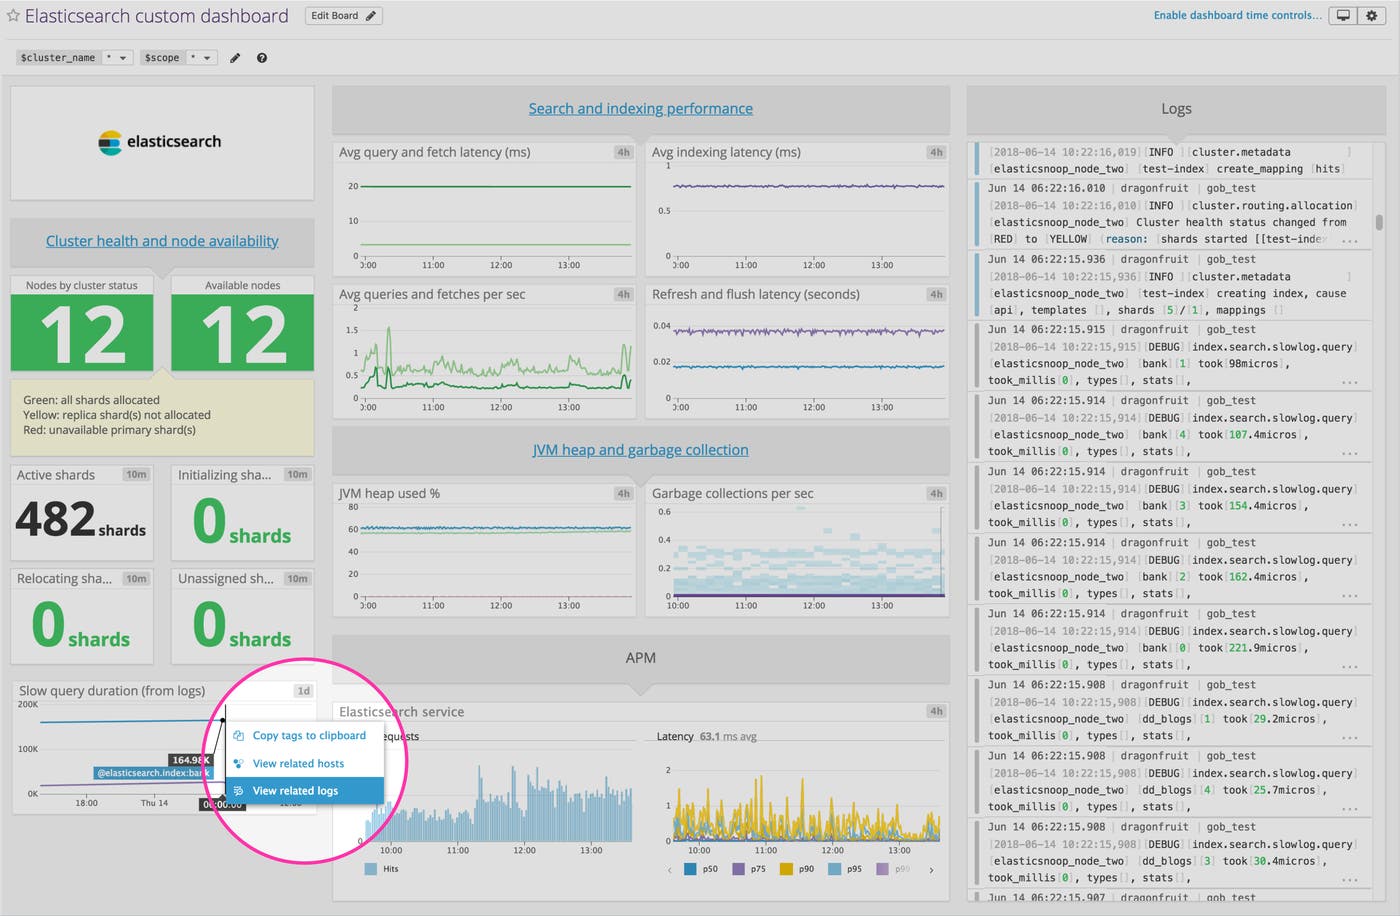
Now that you’ve set up Datadog to collect all your Elasticsearch metrics, traces, and logs in one place, you can pivot between all of these sources of monitoring data in order to investigate and debug issues. Setting up custom dashboards is a great way to ensure that you have complete visibility into the data you care about most, so you can track your Elasticsearch clusters and their services, and quickly investigate potential issues. The example below shows how you can easily click on any point of a query latency graph to view related logs from that time period—in this case, the search slow logs collected from search queries to the bank index of the Elasticsearch cluster.
Alerts
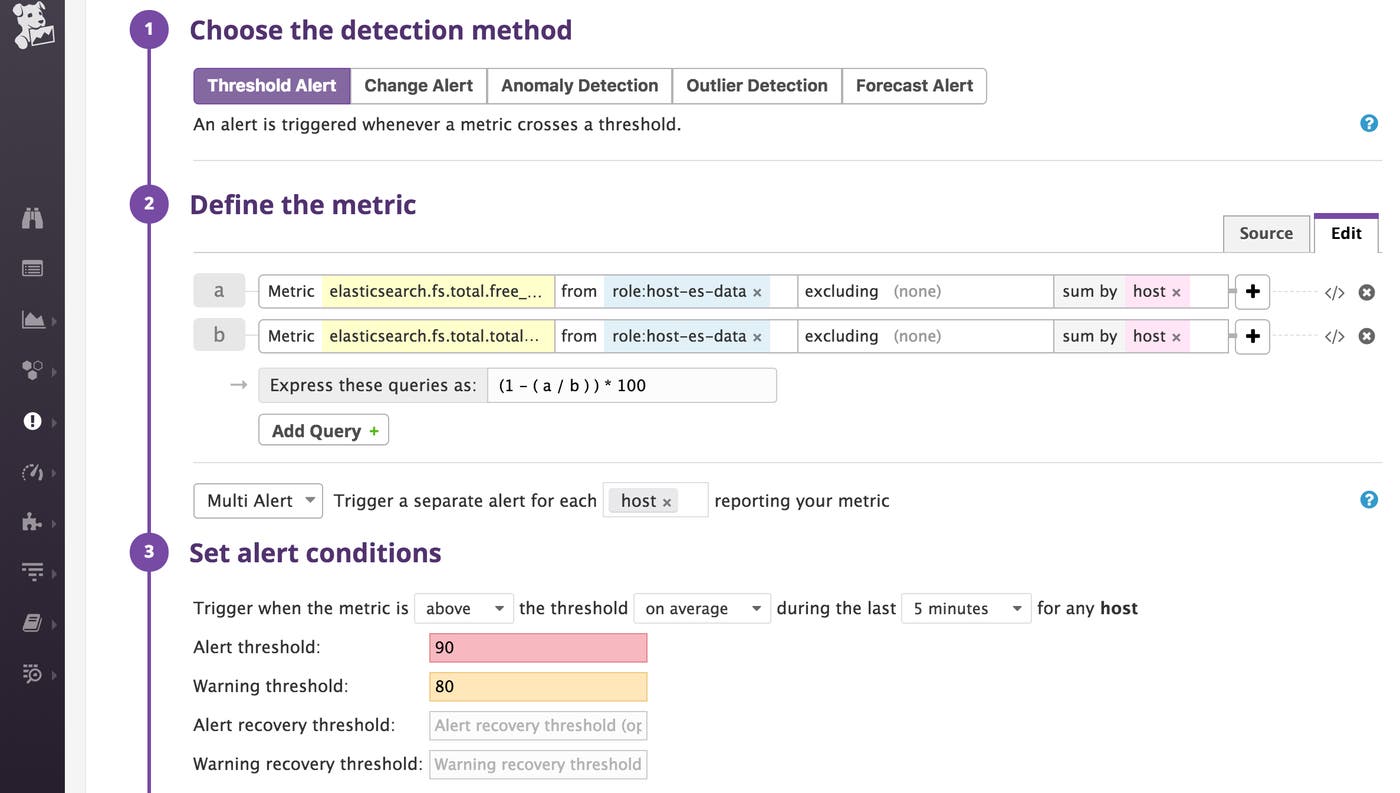
Tagging your nodes enables you to set up smarter, targeted Elasticsearch alerts to watch over your metrics and loop in the appropriate people when issues arise. In the screenshot below, we set up an alert to notify team members when any data node (tagged with role:host-es-data in this case) starts running out of disk space. The role tag is quite useful for this alert—we can exclude dedicated leader-eligible nodes, which don’t store any data.
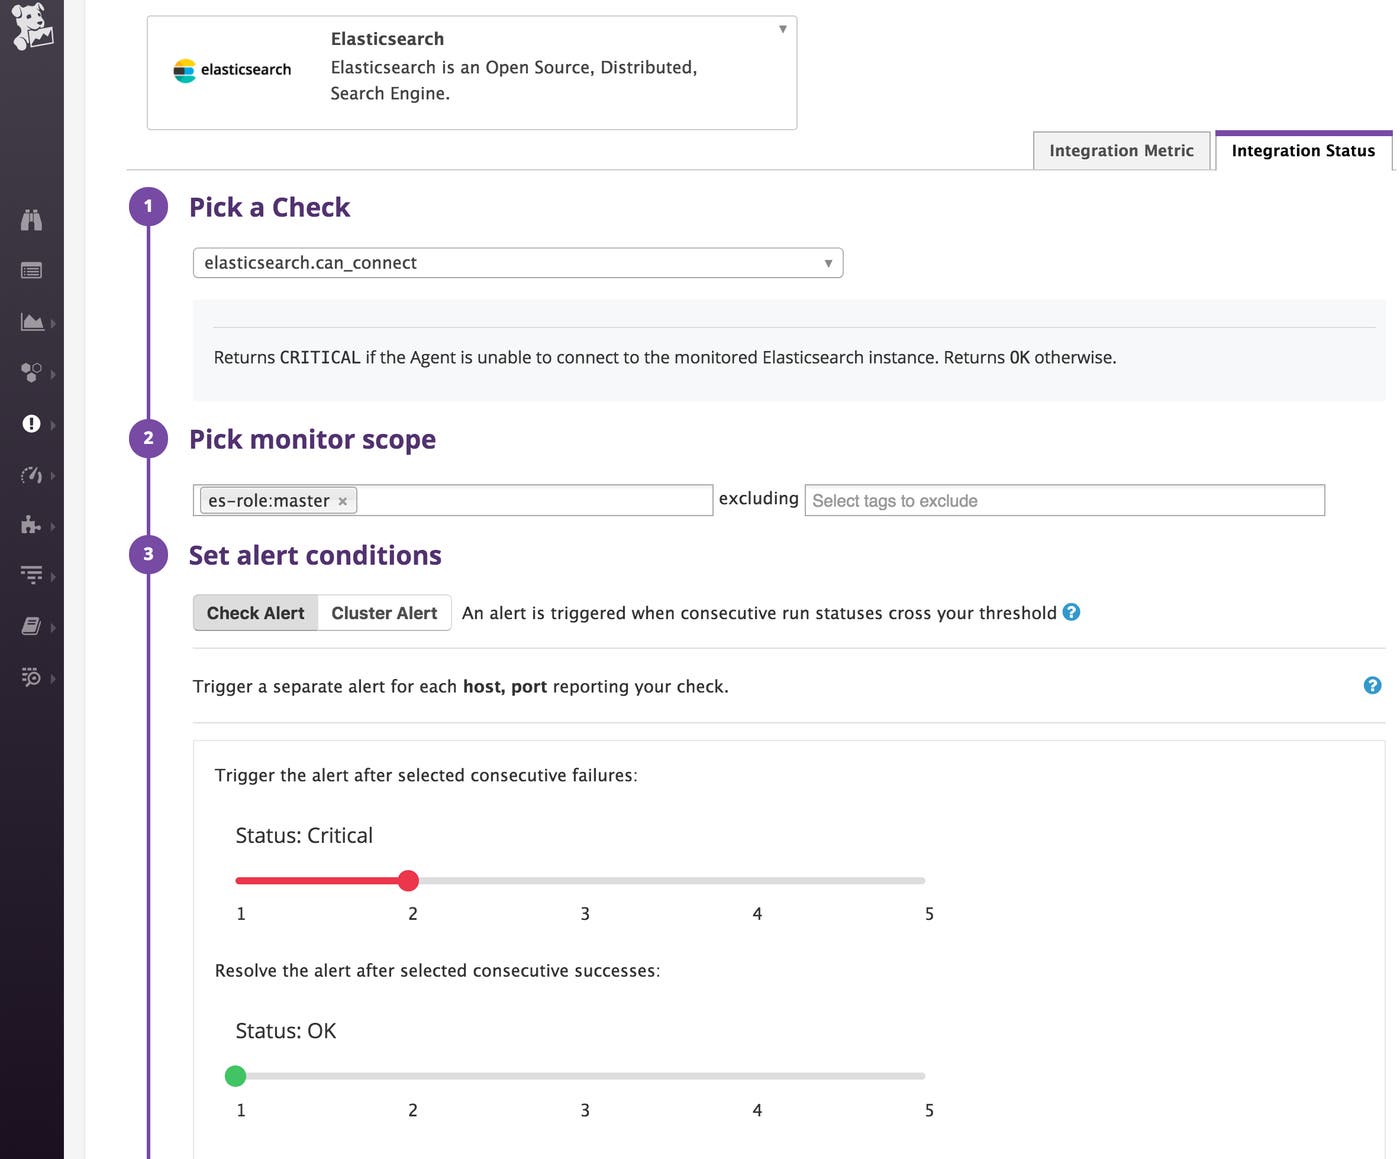
You can also set up alerts based on other useful alert triggers such as long garbage collection times and search latency thresholds. You might also want to set up an Elasticsearch integration check in Datadog to find out if any of your leader-eligible nodes have failed to connect to the Agent in the past five minutes, as shown below:
Start monitoring Elasticsearch with Datadog
In this post, we’ve walked through how to use Datadog to collect, visualize, and alert on your Elasticsearch performance data. If you’ve followed along with your Datadog account, you should now have greater visibility into the state of your clusters and be better prepared to address potential issues. The next part in this series describes how to solve five common Elasticsearch scaling and performance issues.
If you don’t yet have a Datadog account, you can start monitoring Elasticsearch right away with a free trial.
Source Markdown for this post is available on GitHub. Questions, corrections, additions, etc.? Please let us know.


