Rishabh Moudgil
Elastic Load Balancing (ELB), offered by Amazon Web Services (AWS), is a service that routes traffic to multiple targets, ensuring that each target does a similar amount of work. There are two main types of ELBs—Classic Load Balancers and Application Load Balancers—which perform a similar function, with some important differences.
Classic Load Balancers route traffic from clients to a backend pool of EC2 instances, which may be spread across multiple availability zones. In a previous series of articles, we explained how to monitor classic ELB performance metrics, whether or not you use Datadog.
Application Load Balancers (ALB) perform a similar role, but they support routing to multiple ports on the same instance. ALBs also support path-based routing, enabling you to route requests to a particular service based on the content of a URL.
Monitoring your load balancer is important because it serves as the primary gateway for clients to your application. Unexpected issues with your load balancer could result in a target being overwhelmed with requests, or even complete application downtime. By collecting load balancer metrics such as end-to-end application latency, error code responses, request throughput, and other high-value metrics, you can be well prepared to quickly combat any issues that come your way.
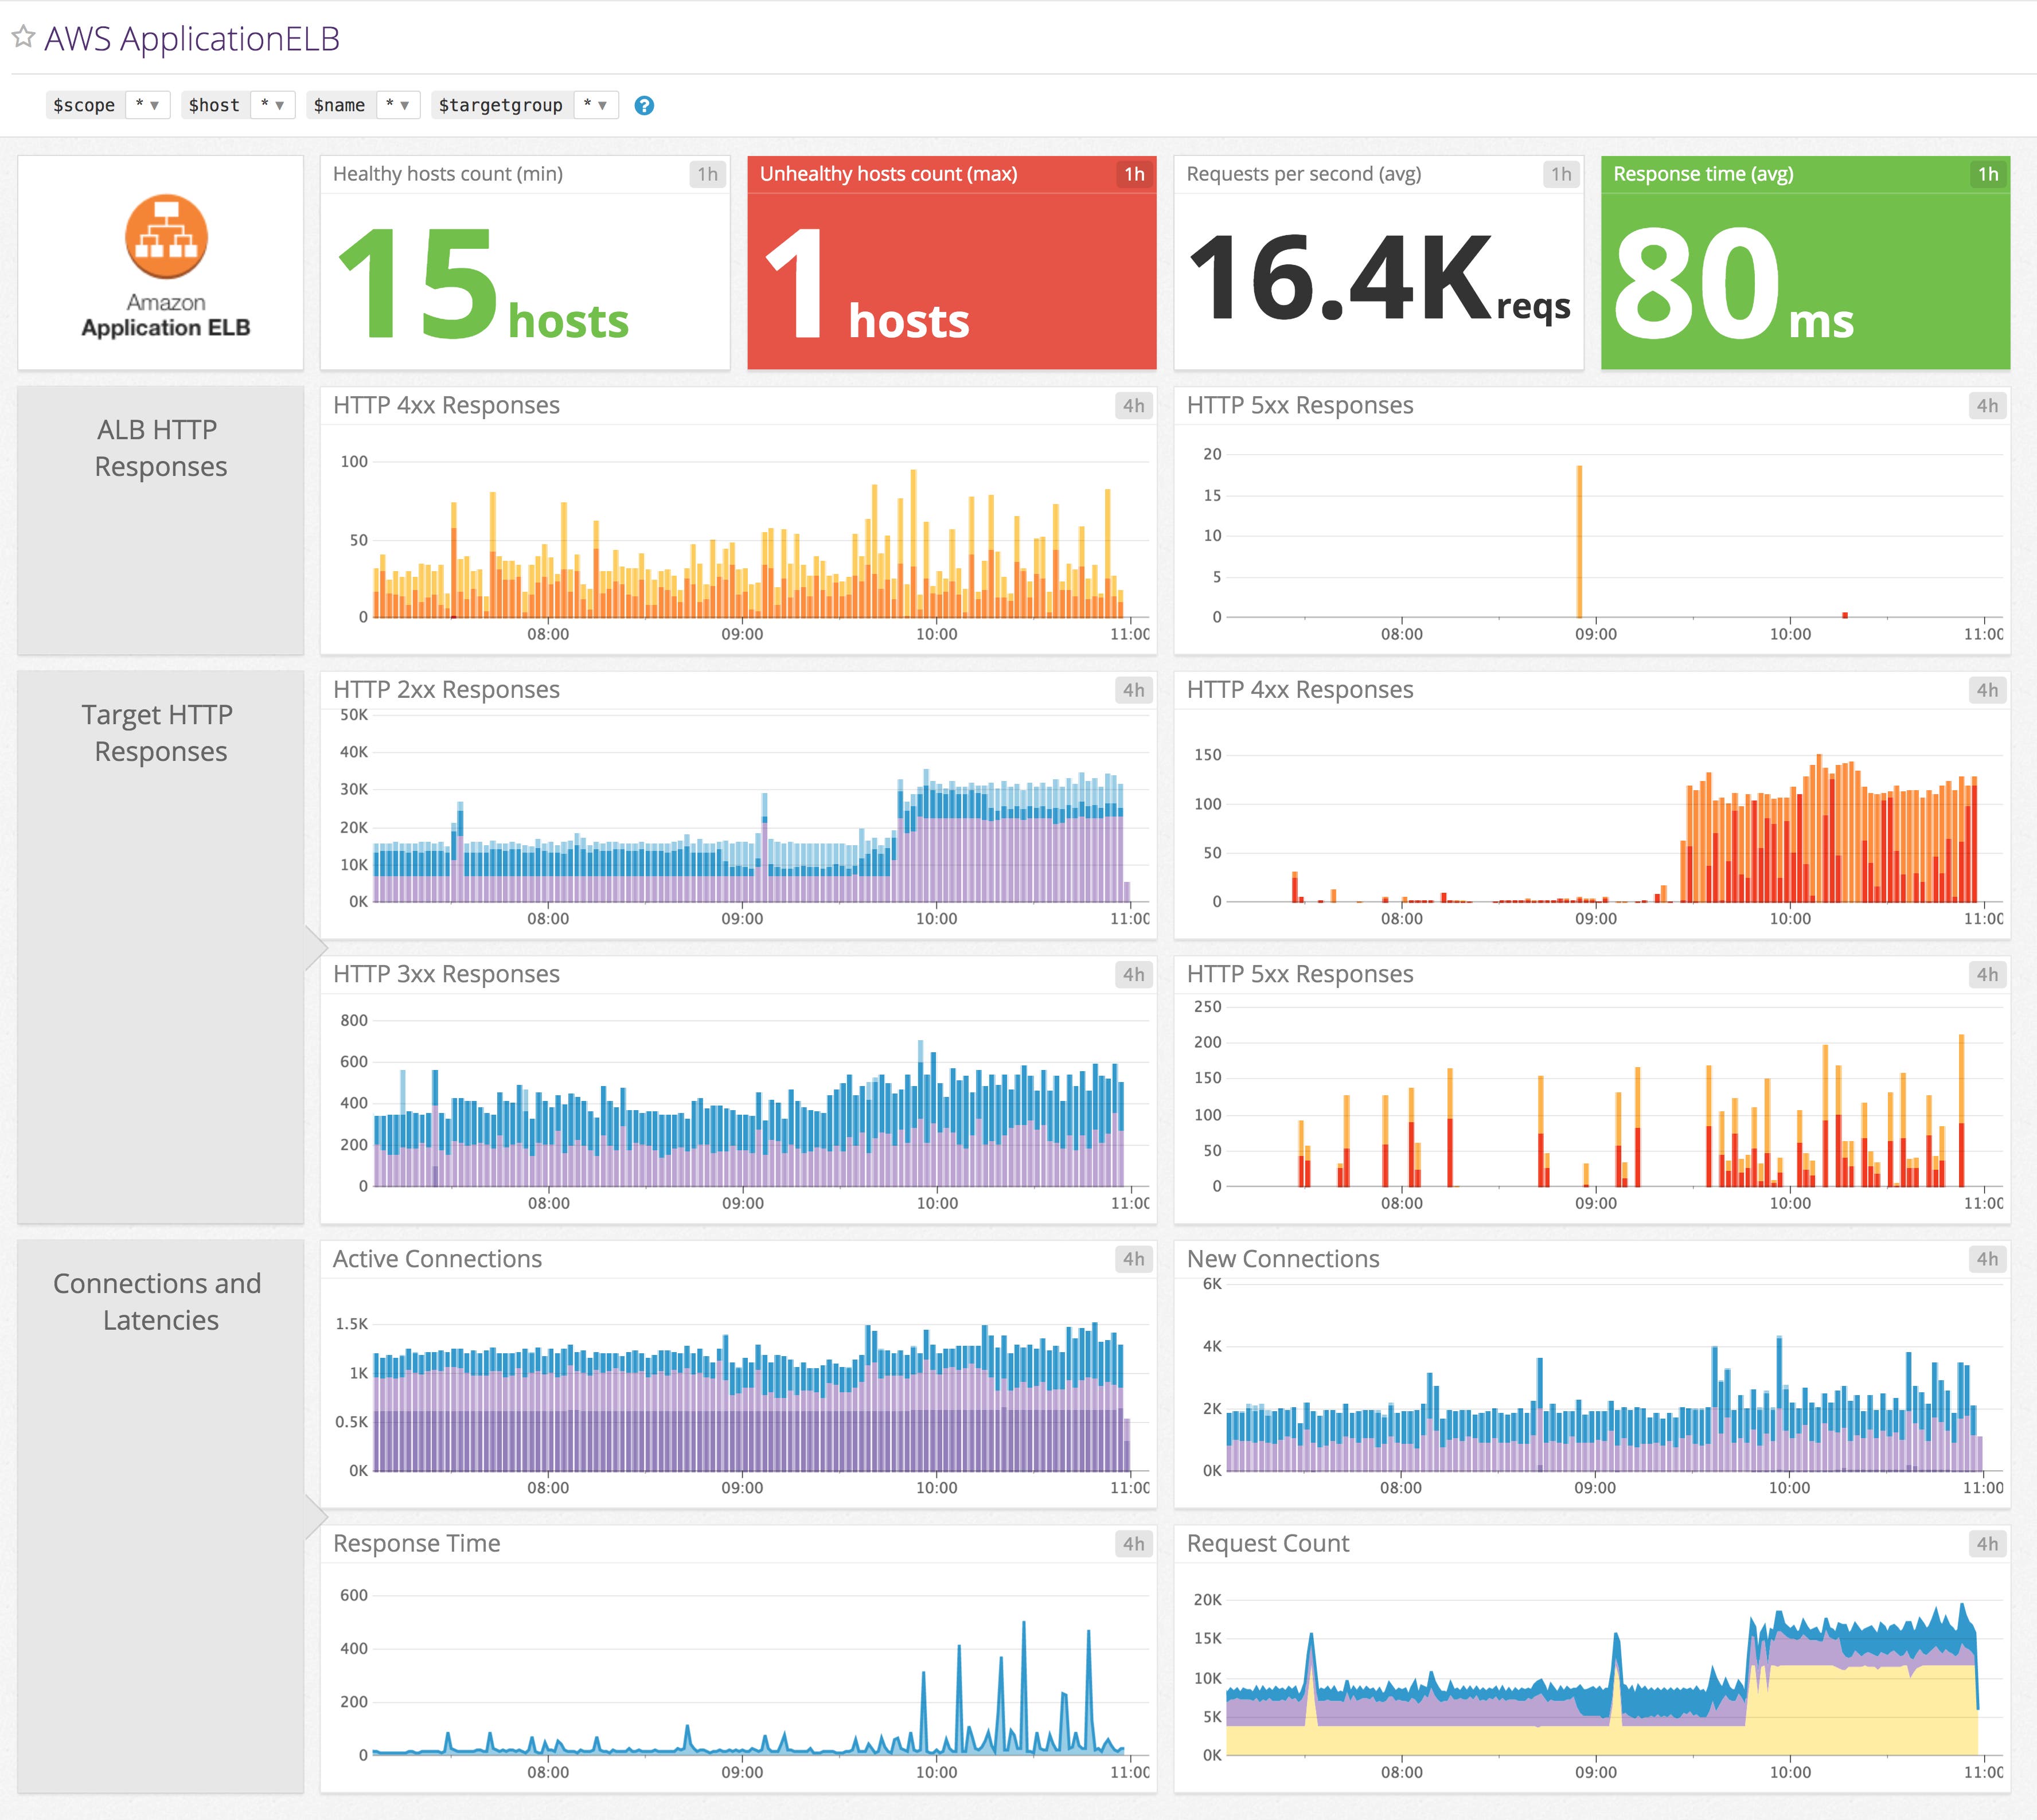
In addition to collecting classic ELB metrics, you can easily view and collect ALB metrics after integrating Datadog with AWS. You can then access an out-of-the-box ALB dashboard that displays key metrics such as the number of healthy and unhealthy hosts, and a full breakdown of HTTP response codes.

You can clone this dashboard and build on it by adding your own graphs and status checks to correlate metrics across your infrastructure.
Track the number of healthy hosts
It is important to ensure that you always have enough healthy hosts in your backend to handle the volume of incoming requests. You can monitor the health of your backend using the data ALB generates from its host health checks. Once a target exceeds the unhealthy threshold configured in the ALB, the ALB considers the target as unhealthy and stops routing requests to it. If there are too many unhealthy targets in your system, your healthy targets may not be able to keep up with the increased workload and requests may be dropped.

By correlating the health of your instances with other metrics in your infrastructure, such as database latency and request count, you can better diagnose points of failures. You can also set up an alert so you can be promptly notified if the number of unhealthy hosts starts to climb.
Monitor ALB traffic
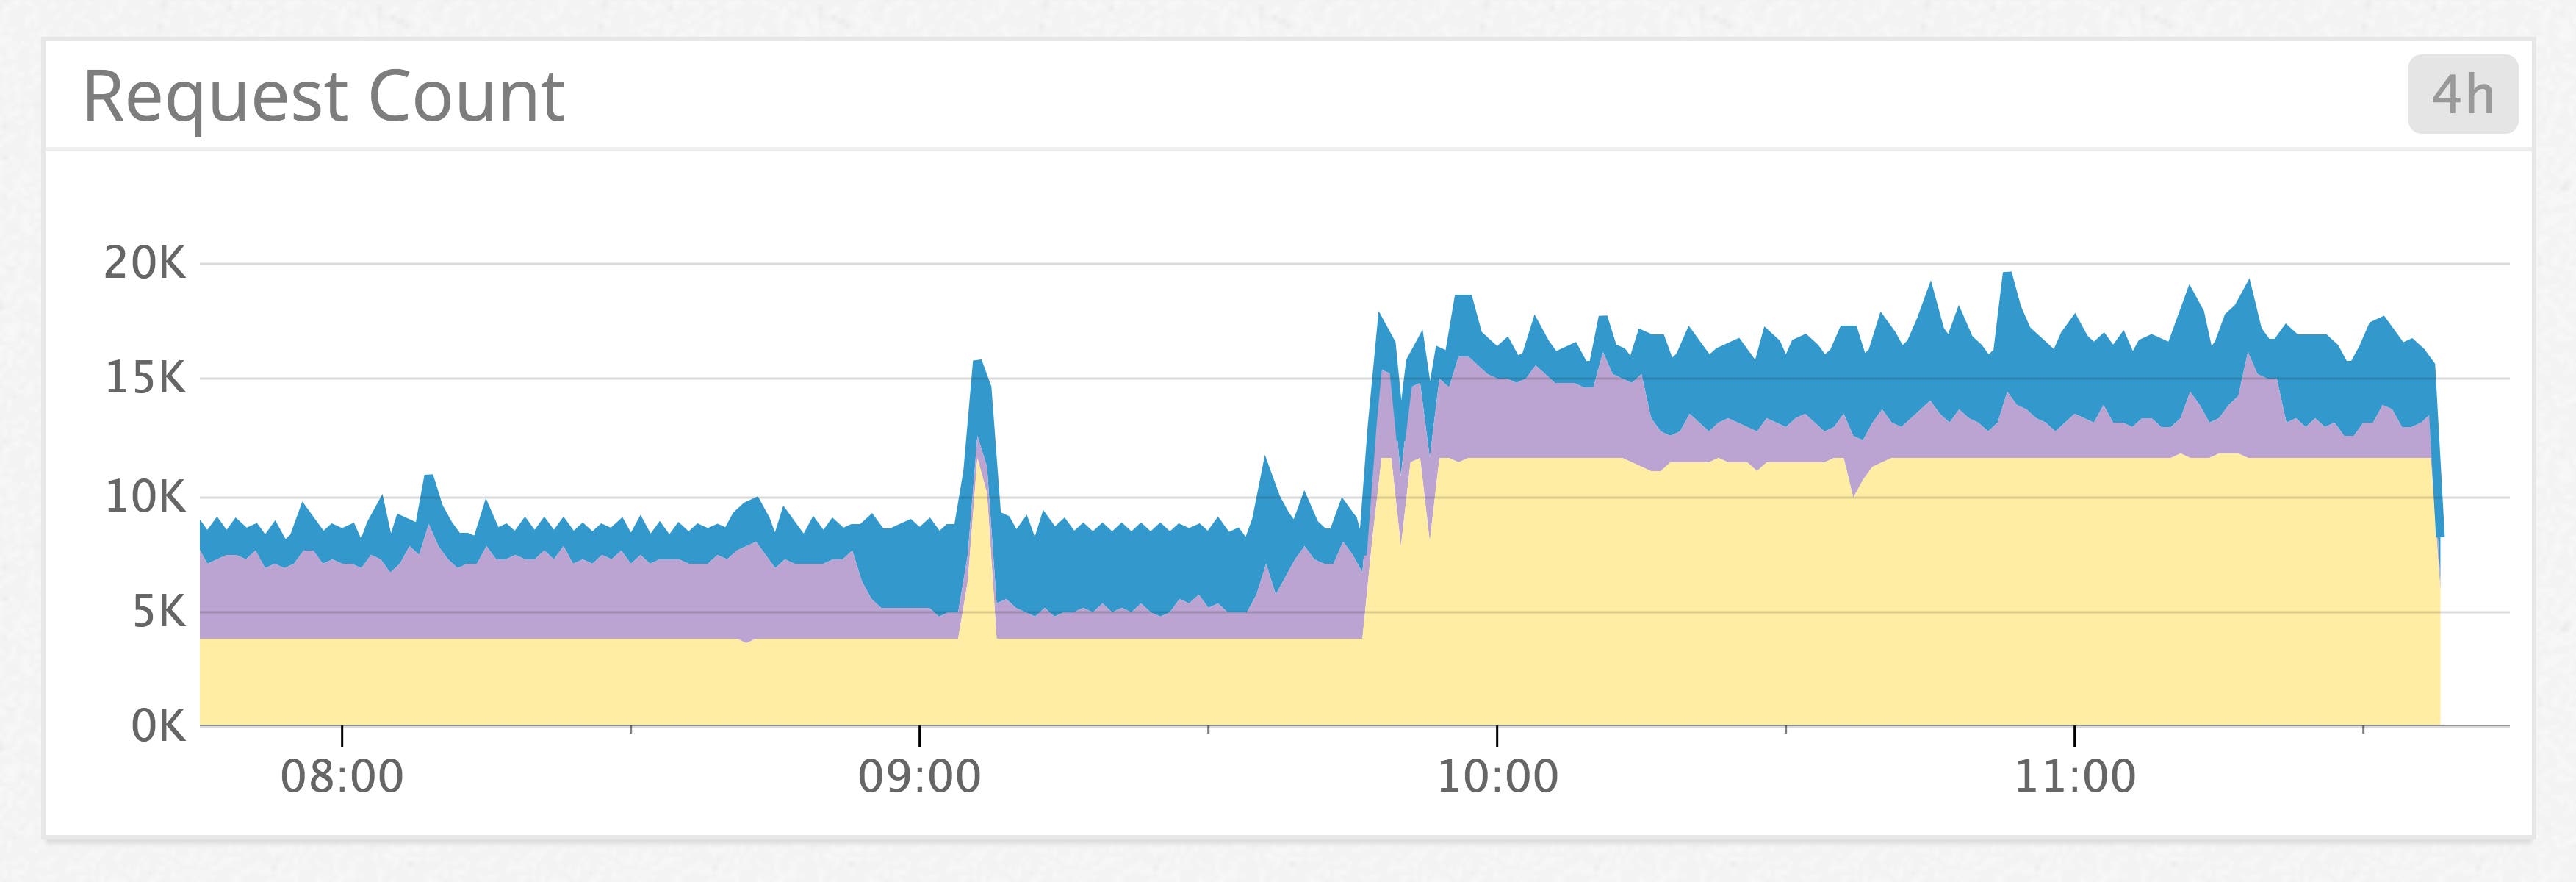
To measure the amount of traffic your application receives, you can track the number of requests handled by your load balancer. If you are not using Auto Scaling, monitoring this metric will help you quickly adjust the number of targets in your backend to efficiently handle changes in your load.
Since this metric can depend on your users’ productive hours, unexpected spikes or drops can be difficult to automatically detect. By using Datadog’s anomaly detection features, you can choose to be alerted when Datadog identifies out-of-the-ordinary activity.

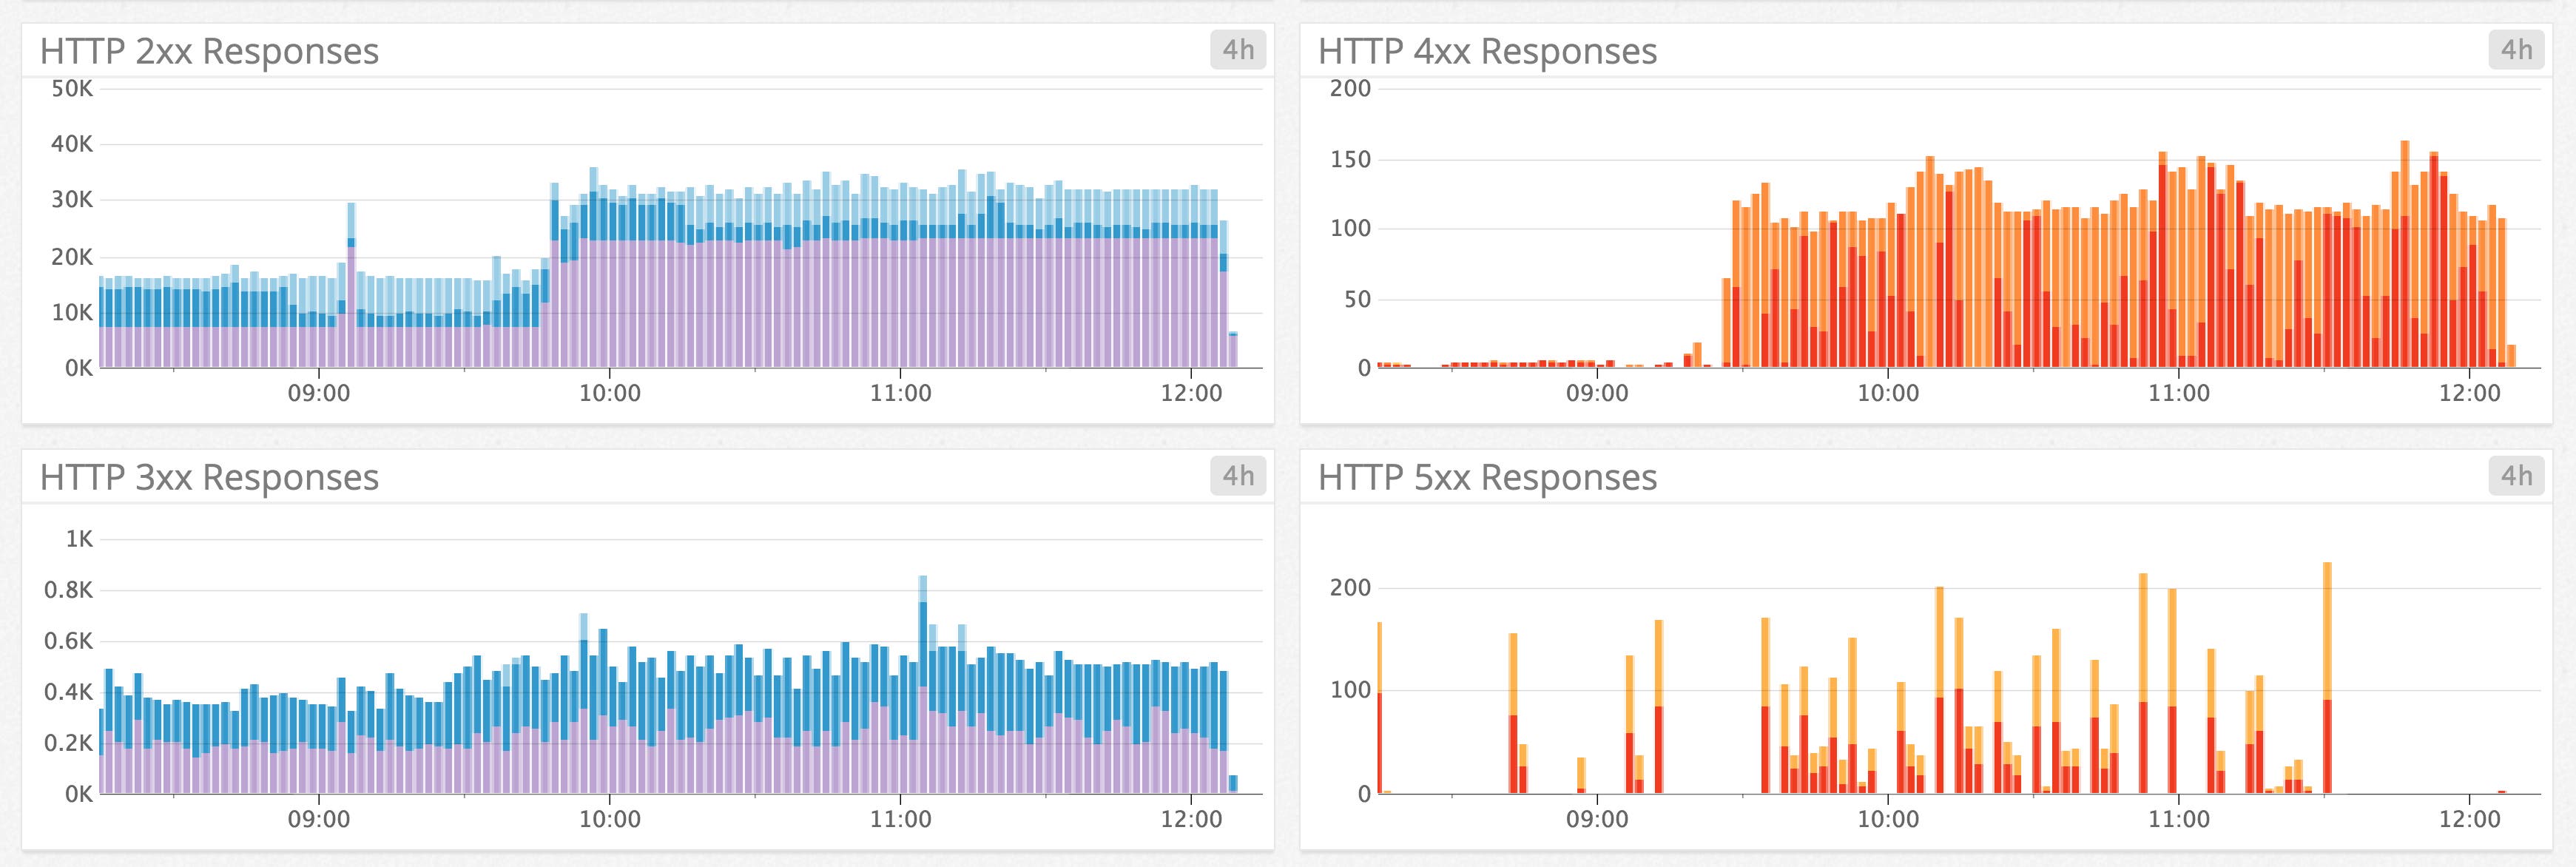
You can also monitor any HTTP error codes generated directly by the ALB in response to incoming requests. If your ALB is sending out too many 5xx errors, you should troubleshoot any network or infrastructure issues you might be having.

Gauge target performance
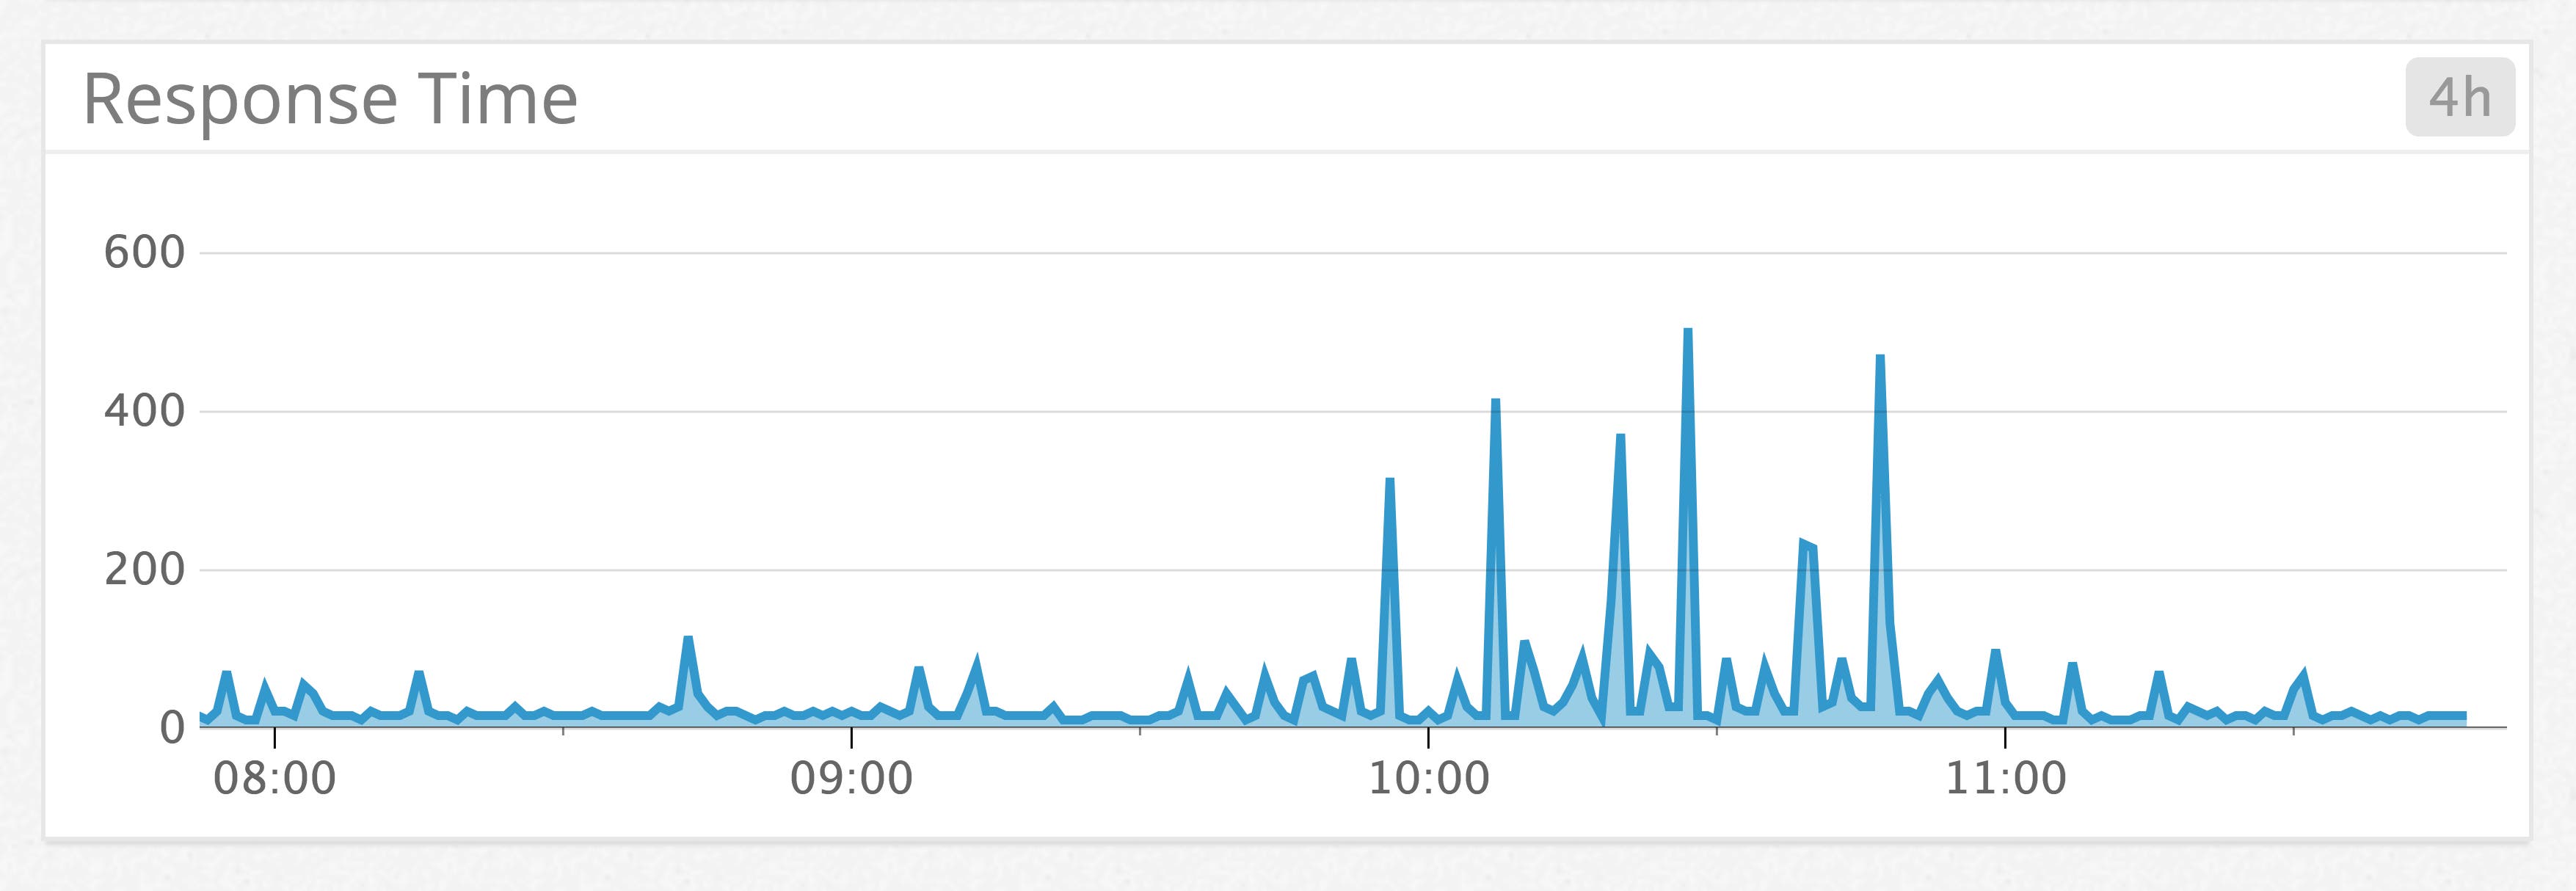
A great way to measure how well your backend is performing overall is by monitoring the time elapsed after a request leaves the load balancer until a response is received. If the value is high, there may be network problems, your targets may be overloaded, or there may be issues in your databases or other application infrastructure.
To help troubleshoot the slowdown, you can correlate ALB latency with metrics from your backend infrastructure. For example, an app server could be saturating its disk I/O or CPU, which would explain an increase in response time.

You can also see the number of different kinds of responses generated by the targets behind the ALB. For instance, a target would return an HTTP 404 code if a request was made for a nonexistent resource.

To gather further insight into your backend performance, you can use Datadog’s application performance monitoring (APM) to trace actual requests in detailed flame graphs that break down which services, resources, and queries are contributing to overall latency.
Get started
If you are already using Datadog, you can start monitoring your ALBs and the rest of your AWS infrastructure by following our integration guide. If you are not using Datadog yet, you can sign up for a 14-day free trial.


