
Allen Zhou

Eddie Cai
When a PostgreSQL query runs slowly, engineers often start with EXPLAIN ANALYZE. The output is a tree of plan nodes, each one describing a step the database took to execute it. A query with several joins and a subquery can produce 20 or more nodes. But the plan gives no visual indication of which node corresponds to each clause in the SQL text. Diagnosing the problem means viewing the plan in one window and the query in another, manually tracing connections between them. Even a single misread can send the investigation in the wrong direction.
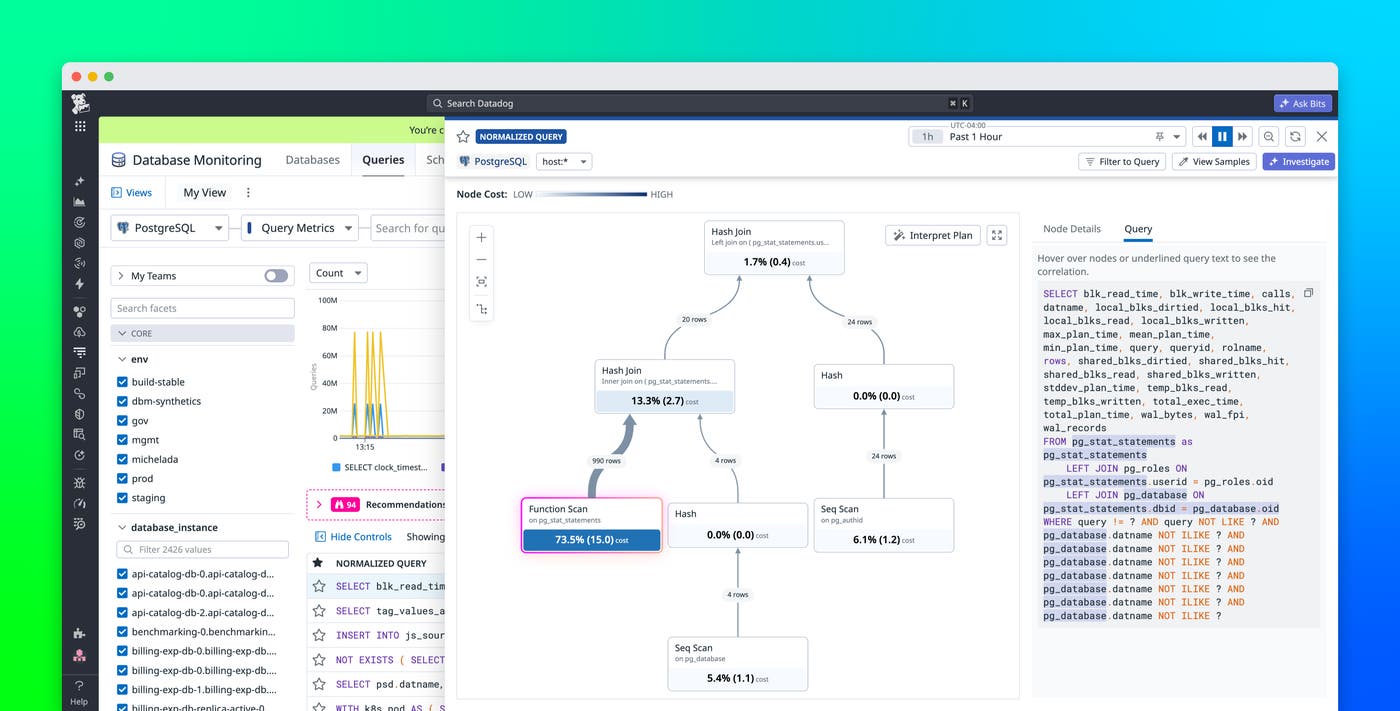
Explain plan correlation in Datadog Database Monitoring closes that gap for both EXPLAIN ANALYZE and EXPLAIN plans by linking each plan node directly to the SQL clause it represents. You can explore this relationship by hovering over a node to see which clause it maps to. The same interaction works in reverse. Selecting a clause in the SQL text highlights the corresponding plan node, and the mapping remains consistent across parameterized queries and table aliases.
In this post, we’ll show how to use explain plan correlation to:
Understand how explain plan nodes map to SQL text
Explain plan correlation is available in the normalized query panel and on the Explain Plan Samples page for PostgreSQL queries in Database Monitoring. In both views, the explain plan and SQL text appear together, so you can inspect the plan without switching context.
From there, you can move between the plan and the SQL to understand how each operation connects to the query. Hovering over a node in the explain plan tree highlights the clause it maps to in the SQL text.
In the explain plan view, a “View in Query” button appears in the node tooltip, letting you jump directly to the matched fragment, even when the clause appears deep in a long query.
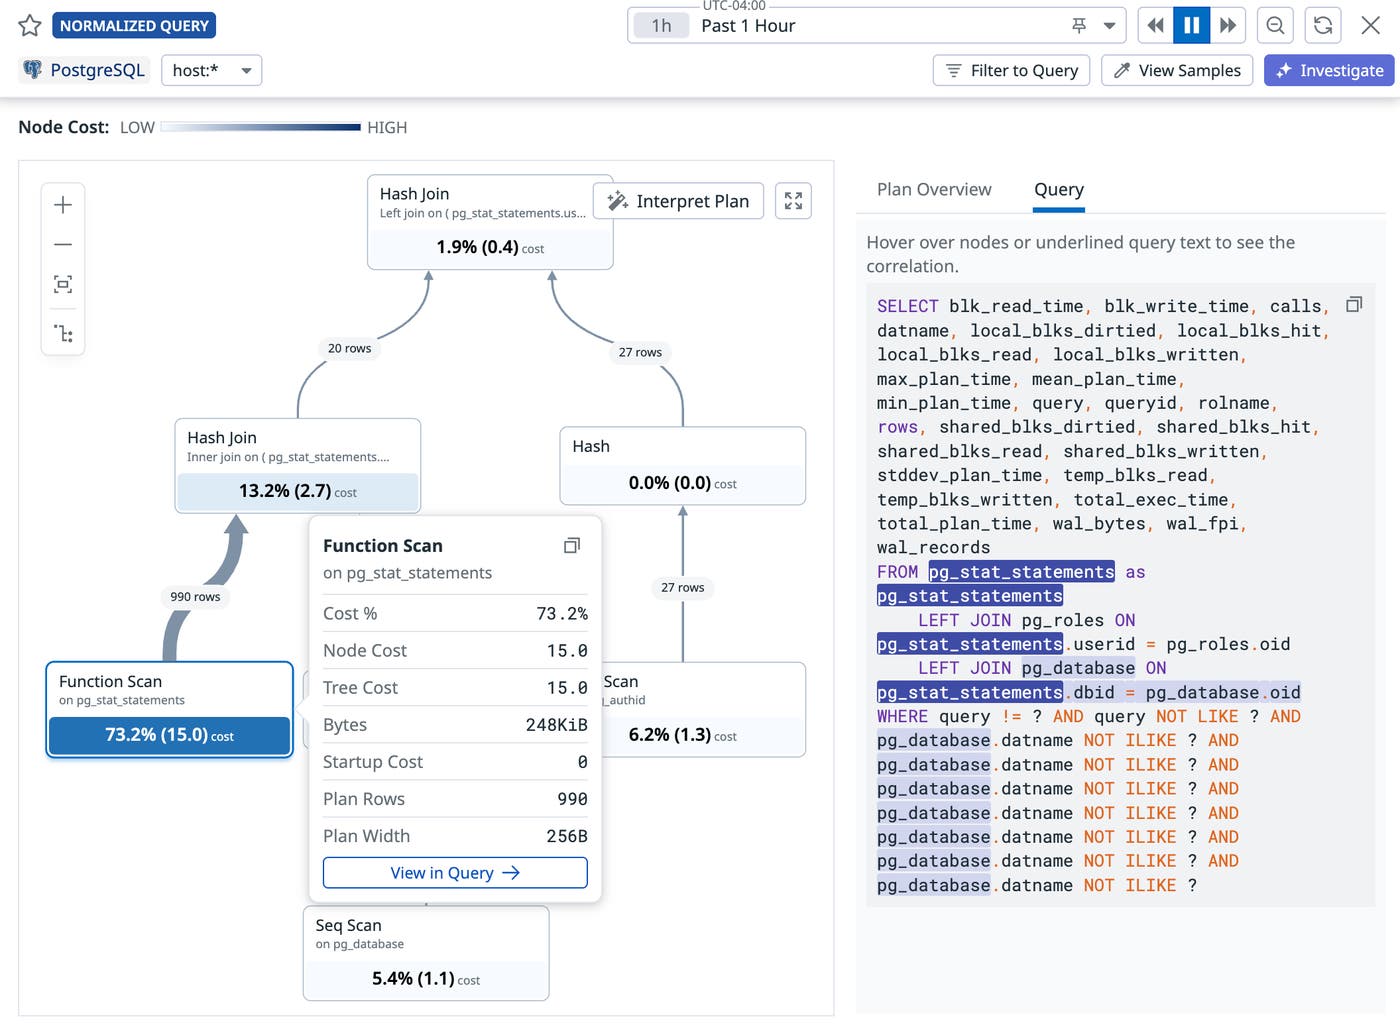
Database Monitoring uses metadata from the execution plan, such as the table being scanned, join keys, filter conditions, and sort operations, to match plan nodes to the corresponding clauses in the original SQL query.
The same node-to-SQL correlation is also available in Datadog’s public explain plan visualizer. Paste any PostgreSQL plan into the tool and open the Query Shape tab to explore the feature without a Datadog account.
Identify costly nodes in multi-join queries
Multi-join queries can produce plan trees with 20 or more nodes. With this mapping, you can identify which parts of the query contribute most to execution cost.
For example, while investigating Datadog’s own Agent query to pg_stat_statements, we identified a Function Scan node that accounted for 73.3% of the total plan cost. Because the node maps to the pg_stat_statements reference in the FROM clause, it was clear that the cost came from the function call itself.
Get started with explain plan correlation in Datadog Database Monitoring
Database Monitoring surfaces the relationship between plan structure and SQL directly in the plan view. This makes it easier to understand how PostgreSQL queries are executed and which parts of the query account for most of its execution time.
For more information on explain plan correlation and PostgreSQL support, see our Database Monitoring documentation.
If you’re not already a Datadog customer, sign up for a 14-day free trial.
