

Natasha Silva
Technical Content Writer
In some organizations, high token counts have become a proxy for productivity. Some engineering teams are being pushed to max out context windows and wire in sprawling tool sets. More tokens can mean better agent reasoning and richer context during development, but token costs compound in production. Tokens accumulate across sessions, users, and tool calls in ways that are easy to overlook.
Datadog’s 2026 State of AI Engineering report quantifies the scale of this problem. Our research found that token usage per request more than doubled for median customers year over year and quadrupled for 90th-percentile power users among Datadog-monitored services.
This guide covers where agentic token costs actually come from, how to control them, and specific techniques to make token costs visible, so you can catch problems before they become expensive. None of them can be validated without token visibility, so that instrumentation should be in place before you make changes.
Where agentic token costs come from and how to control them
In a single-turn prompt, cost is straightforward: input + output = total. Agentic systems work differently. Costs compound across repeated tool calls, growing session history, and retrieval loops in ways that are easy to miss until you are in production.
Tool definitions
Every tool an agent can access has a schema that describes what the function does, what parameters it accepts, and how to call it. Those schemas get loaded into context on every call, whether they are needed or not.
Agents connected to tool catalogs via MCP servers, provider-native function calling, or APIs can accumulate dozens of schemas. A complex schema with nested objects and parameter descriptions can consume hundreds to thousands of tokens. That cost is paid on every single call, before any user interaction begins.
Fix: Trim the tool catalog
The solution is to load only what the current task requires. Rather than registering the full catalog on every call, determine the user’s intent upfront and pass only the relevant tool subset to the model. For example, a customer support agent might load billing tools for payment questions and a separate set for account management requests.
If you prefer a more nuanced approach than binary pruning, consider progressive discovery. Load only tool names and descriptions at startup, then fetch full schemas on demand when the agent actually needs them. This preserves capability while significantly reducing baseline token cost. To verify the impact, capture the same request before and after and compare their agent traces, checking the input token count on each. Most providers return this in the response metadata as a usage count (check your provider’s documentation for the exact field name), which gives you a way to compare and benchmark the two.
For tools that must load on every call, such as system prompts and static instructions, take advantage of prompt caching. This technique is supported by most major providers and avoids reprocessing tokens that haven’t changed.
Prompt caching saves the most for agentic systems with large tool catalogs, since those schemas are loaded on every call. It can be enabled at the API level either by explicitly marking content blocks for caching or automatically depending on your provider. Note that caching applies to content at a fixed context position, so dynamically loaded or mid-context tool schemas may not be eligible depending on your provider. To verify impact, compare input token costs before and after enabling caching on your system prompt and tool definitions.
One caveat specific to tool pruning is that dynamically adding or removing tools mid-session may invalidate the key-value cache for subsequent actions, though behavior varies by provider. In this case, aggressive dynamic pruning can reintroduce token costs that offset the savings. Changes to the tool catalog are best made at session boundaries where possible.
Session history
Multi-turn agents carry the full conversation forward on each call, including accumulated tool results and reasoning traces. In a ReAct-style agent, every tool invocation appends to context, including API responses, file contents, and error traces. Without compression, the window fills quickly, displacing the system instructions and early task context the model needs.
Fix: Cap history growth
Context windowing and history summarization are the primary tools for controlling session history growth. Implement one of them to cap how much history travels forward on each turn.
A sliding window keeps only the N most recent messages, dropping older turns. This is effective for token control but risks losing critical early context. History summarization periodically compresses older turns into a summary, trading some detail for a smaller context footprint. The expected signal that either approach is working is a token growth curve that flattens over the course of a session. If counts keep climbing, check that compaction or truncation runs before the history is passed to the model on each turn. Applying it after the response is received leaves the full history intact. Track input token counts per turn over a session to confirm it’s working.
The right approach depends on the agent. A task-focused agent where early turns become irrelevant quickly is a good candidate for windowing. A coding assistant that needs to remember decisions made earlier in the conversation is better served by summarization.
Retrieval loops
In agentic systems, the large language model (LLM) governs when and what to retrieve, which means retrieval decisions can compound unpredictably. Each retrieval cycle injects chunks into context. Without controls to detect and deduplicate redundant retrievals, an agent can loop excessively, inflating costs and degrading model attention.
Fix: Cut redundant retrievals
Deduplicate retrieved chunks across loop iterations and tune chunk size and retrieval depth to the minimum needed for accuracy. To verify, log token counts on retrieval spans specifically. Any tracing framework that instruments your pipeline can capture this data, and any unusual growth there is a signal worth investigating. If token counts on retrieval spans keep growing, check whether your deduplication compares chunk content rather than just metadata identifiers, since vector stores commonly index identical passages as separate entries.
How to make token costs visible
Before tuning tool catalogs, compressing history, or tightening retrieval loops, you need visibility into where tokens are actually going. The data that matters breaks down into four categories.
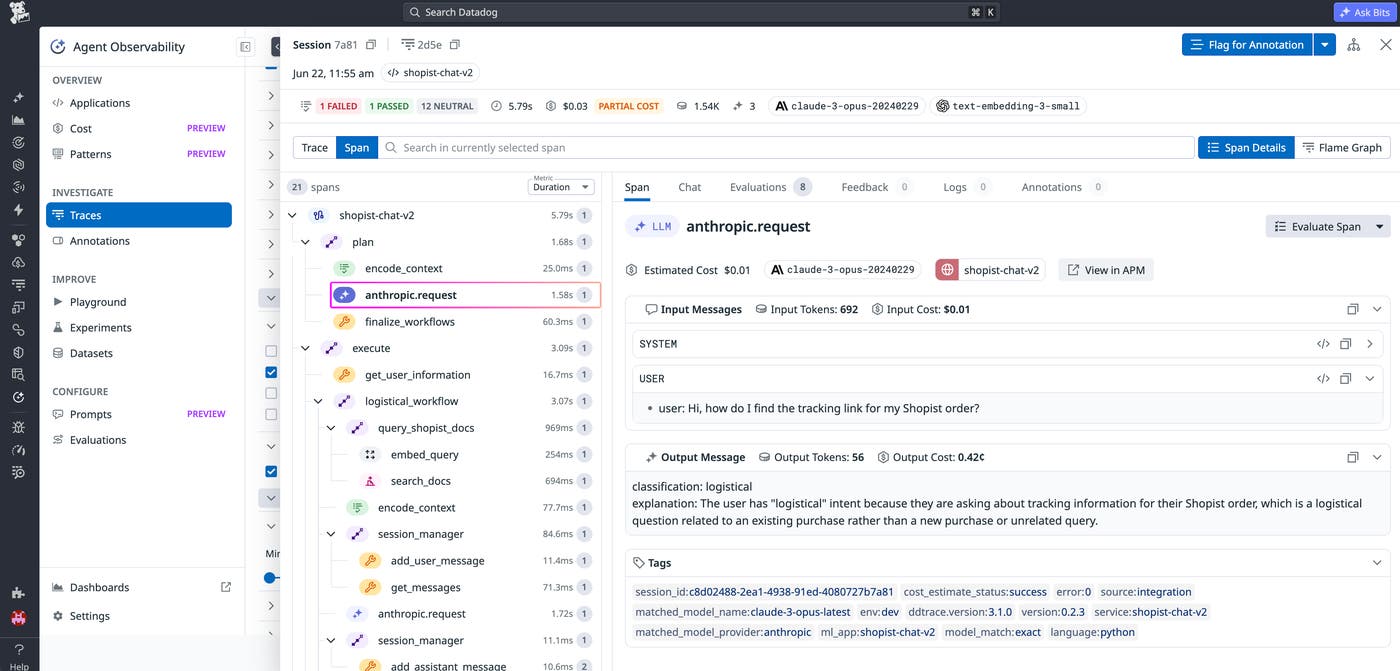
Cost broken down by LLM call, tool invocation, and retrieval step. These individual operations are captured as spans within a trace. Seeing that distribution tells you whether the problem is a large system prompt, an accumulating session history, or a retrieval loop that fires too many times.
Input vs. output token splits. Ideally with component-level detail separating user queries, system prompts, and injected tool schemas. Output tokens are typically more expensive per token, as reflected in the pricing of major providers such as Anthropic, OpenAI, and Google. That said, input token bloat from tool definitions and history is often the bigger driver at scale, particularly when agents connect to MCP servers that load large tool catalogs on every call.
Per-session and per-turn token trends over time. A single aggregate cost figure hides the compounding behavior described above. Plotting input token count per turn over a session reveals whether history is accumulating unchecked.
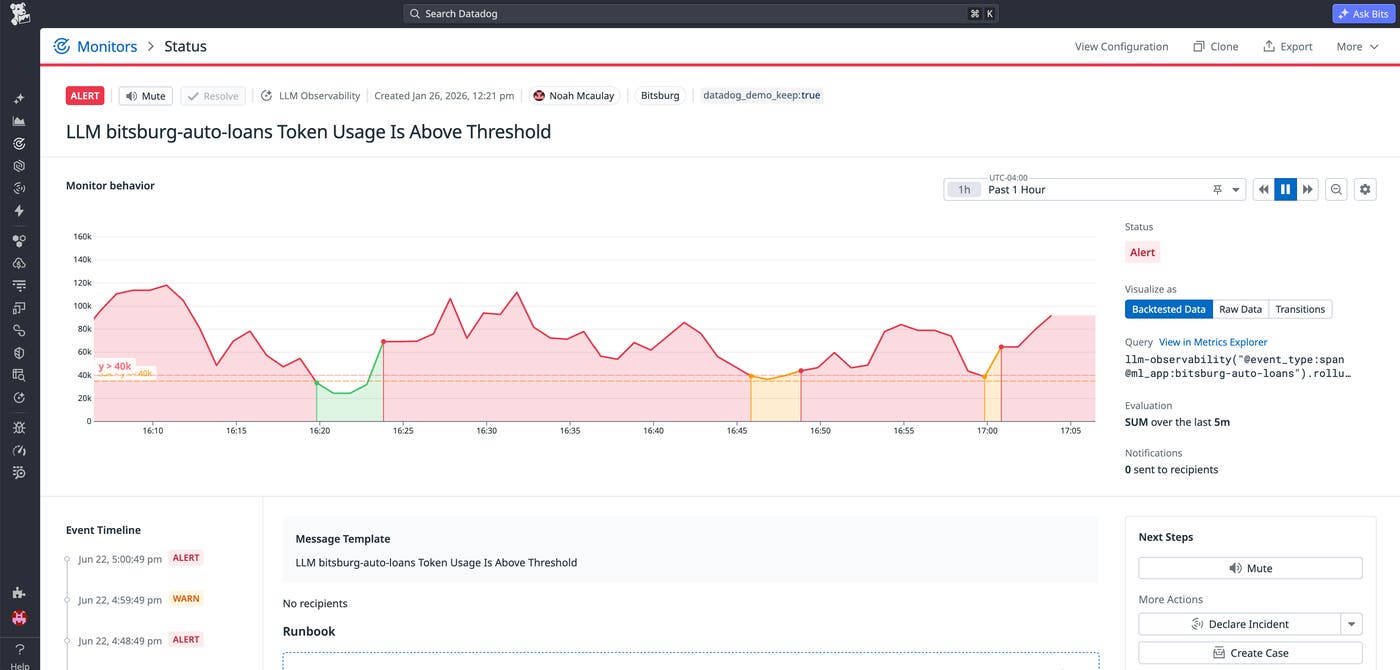
Alerting on token cost anomalies. Once you have a baseline, set threshold or anomaly-detection monitors on token spend. Cost spikes often signal bugs (an agent looping unexpectedly, a retrieval system misfiring, a context window accidentally set to its maximum), not just increased usage.
Most LLM providers expose token counts in their API responses, and any properly instrumented tracing framework can record them regardless of tooling. What matters is measuring at the right granularity: aggregate dashboards may make a problem obvious, but only span-level traces tell you where it is.
Datadog Agent Observability provides this visibility. It includes per-call cost breakdowns calculated from providers’ public pricing, span-level traces with input and output token counts, and metrics you can wire into dashboards and monitors. To get started, instrument your application or agent using the SDK or HTTP API, capturing detailed traces, metrics, and evaluations.
Balance efficiency against capability
With token costs visible, the next step is making sure the techniques covered above don’t quietly compromise your agent’s capability. A long-running session with a large tool catalog and several retrieval cycles can make a single agent run cost far more than a naive per-token estimate would suggest.
These techniques often have tradeoffs. Pruning tools can limit agent capability, and history compaction can drop important earlier context.
The right choice depends on where token costs are highest in the workflow and what your agent can least afford to lose. For example, a customer support agent connected to a large tool catalog might prune tools to cut input tokens, only to find it can no longer handle edge-case requests.
Getting the balance right requires measuring token impact alongside quality signals (error rates, task completion, evaluation scores) so that changes are driven by data. A practical way to do this is to test configurations offline before shipping them, running each approach against a fixed set of representative cases so you can compare their impact and catch regressions before they reach production.
Setting and enforcing token budgets
Measurement alone isn’t enough. Once token costs are visible, engineering leaders need a governance layer to keep them from drifting.
Assign token budgets per agent, service, or team the same way you assign memory or compute limits. A reasonable starting point is to baseline current spend per agent over a representative period using Agent Observability, then set a budget threshold and alert on anomalies from there.
Token spend metrics from Agent Observability can be wired directly into Datadog Monitors to enforce these thresholds, connecting visibility to policy enforcement in a single workflow.
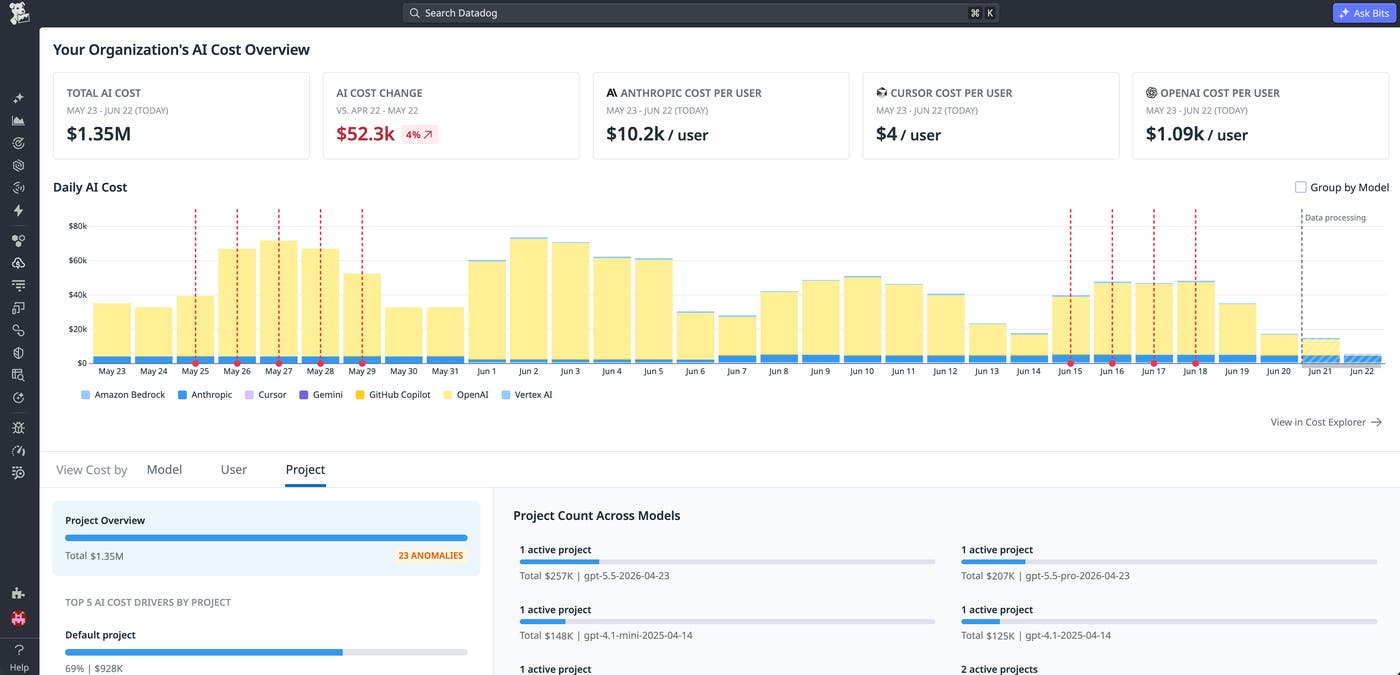
Without explicit budgets, costs aggregate until a billing cycle forces a reckoning. For teams that want to reconcile estimated costs against actual billing data, Datadog’s AI Costs in Cloud Cost Management shows which teams, services, and users are driving spend so that budget conversations are grounded in real numbers.
Encode token budget constraints directly into agent configuration, such as maximum context window per session, maximum tool catalog size, and maximum retrieval depth. Making these limits explicit and visible gives every developer the data they need to self-regulate. In large engineering organizations, that transparency scales far better than centralized enforcement alone. Revisit these constraints whenever agents are updated or expanded. New tools, retrieval sources, and use cases change the token cost profile in ways that aren’t always obvious.
Build for efficiency from the start
Token costs compound quickly in agentic systems. The techniques in this guide reduce waste across tool definitions, session history, and retrieval loops.
Datadog gives you the visibility to make those improvements measurable: Agent Observability surfaces span-level cost breakdowns, Monitors enforce budget thresholds and alert on anomalies, and AI Costs in Cloud Cost Management ties observability data to actual billing so you always know where spend is coming from.
Start on the free tier of Agent Observability and get the runway to find these issues at scale and iterate against them. To learn more, check out the Agent Observability documentation. If you want the full platform, you can also sign up for a free 14-day trial.
