Jean-Mathieu Saponaro
This post is the last of a 3-part series on how to monitor DynamoDB performance. Part 1 explores its key performance metrics, and Part 2 explains how to collect these metrics.
Medium launched to the public in 2013 and has grown quickly ever since. Growing fast is great for any company, but requires continuous infrastructure scaling—which can be a significant challenge for any engineering team (remember the fail whale?). Anticipating their growth, Medium used DynamoDB as one of its primary data stores, which successfully helped them scale up rapidly. In this article we share with you DynamoDB lessons that Medium learned over the last few years, and discuss the tools they use to monitor DynamoDB and keep it performant.
Throttling: the primary challenge
As explained in Part 1, throttled requests are the most common cause of high latency in DynamoDB, and can also cause user-facing errors. Properly monitoring requests and provisioned capacity is essential for Medium in order to ensure an optimal user experience.
Simple view of whole-table capacity
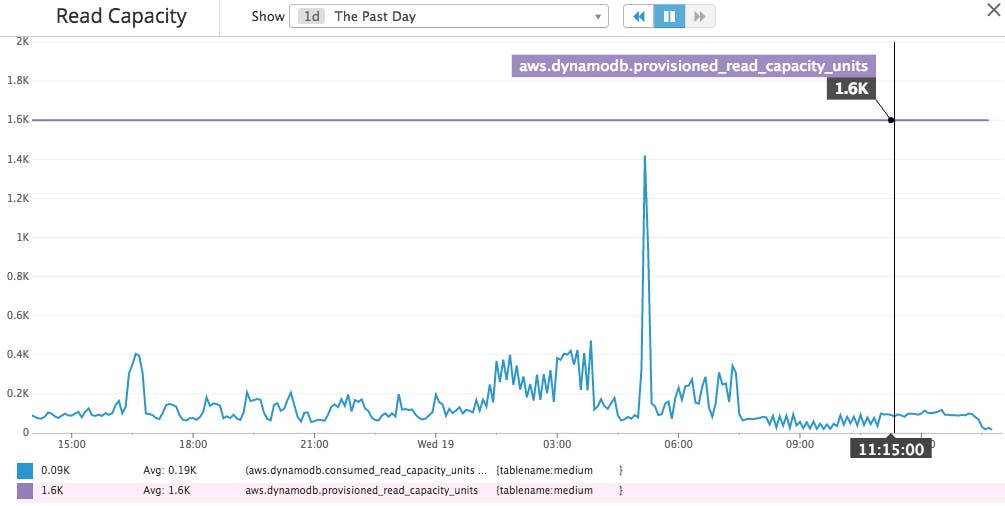
Medium uses Datadog to track the number of reads and writes per second on each of their tables, and to compare the actual usage to provisioned capacity. A snapshot of one of their Datadog graphs is below. As you can see, except for one brief spike their actual usage is well below their capacity.
Invisibly partitioned capacity
Unfortunately, tracking your remaining whole-database capacity is only the first step toward accurately anticipating throttling. Even though you can provision a specific amount of capacity for a table (or a Global Secondary Index), the actual request-throughput limit can be much lower. As described by AWS here, DynamoDB automatically partitions your tables behind the scenes, and divides their provisioned capacity equally among these smaller partitions.
That’s not a big issue if your items are accessed uniformly, with each key requested at about the same frequency as others. In this case, your requests will be throttled about when you reach your provisioned capacity, as expected.
However, some elements of a Medium “story” can’t be cached, so when one of them goes viral, some of its assets are requested extremely frequently. These assets have “hot keys” which create an extremely uneven access pattern. Since Medium’s tables can go up to 1 TB and can require tens of thousands of reads per second, they are highly partitioned. For example, if Medium has provisioned 1000 reads per second for a particular table, and this table is actually split into 10 partitions, then a popular post will be throttled at 100 requests per second at best, even if other partitions’ allocated throughput are never consumed.
The challenge is that the AWS console does not expose the number of partitions in a DynamoDB table even if partitioning is well documented. In order to anticipate throttling of hot keys, Medium calculates the number of partitions it expects per table, using the formula described in the AWS documentation. Then they calculate the throughput limit of each partition by dividing their total provisioned capacity by the expected number of partitions.
Next Medium logs each request, and feeds the log to an ELK stack (Elasticsearch, Logstash, and Kibana) so that they can track the hottest keys. As seen in the snapshot below (bottom chart), one post on Medium is getting more requests per second than the next 17 combined. If the number of requests per second for that post starts to approach their estimated partitioned limit, they can take action to increase capacity.
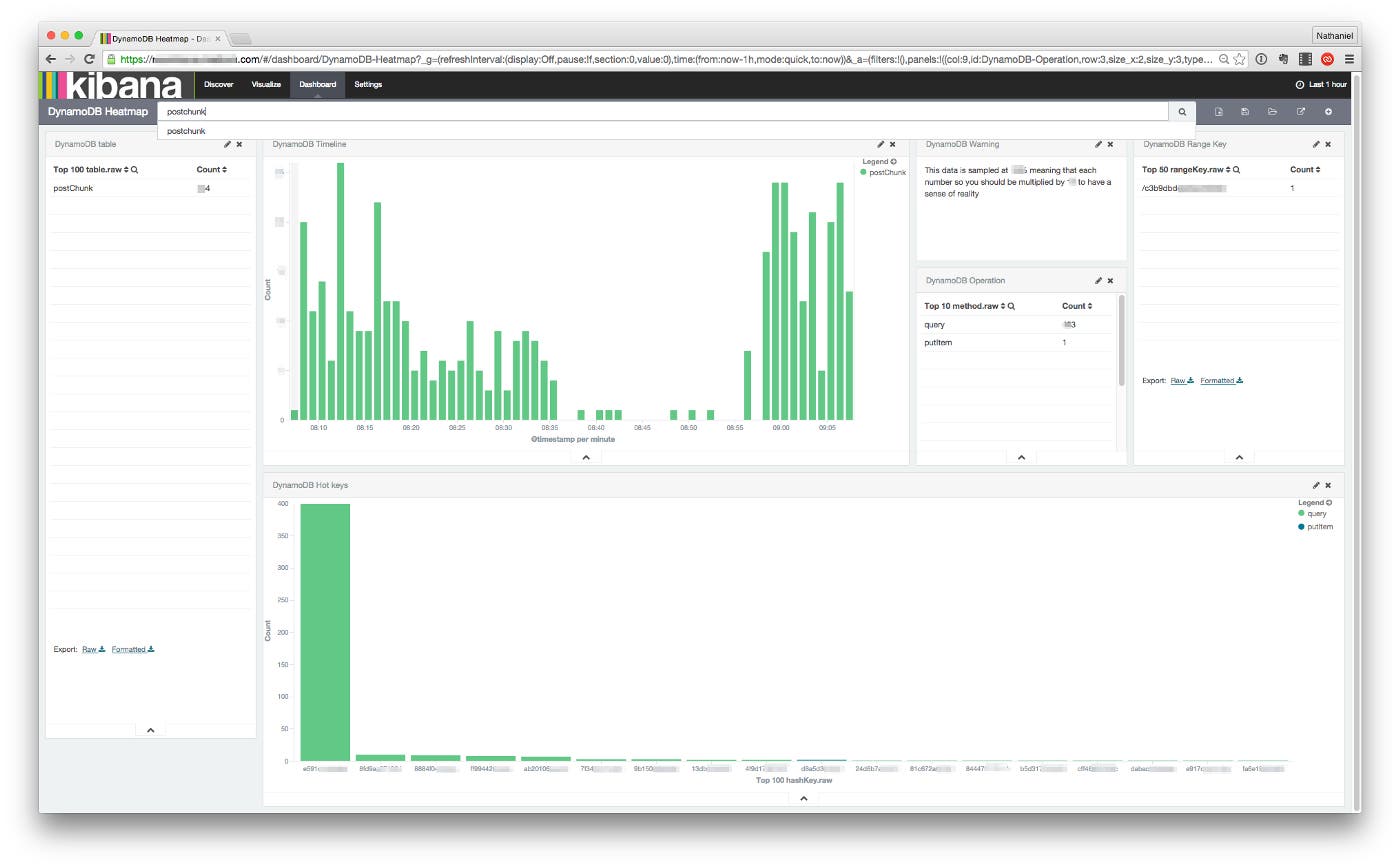
Note that since partitioning is automatic and invisible, two “semi-hot” posts could be in the same partition. In that case, they may be throttled even before this strategy would predict.
Nathaniel Felsen from Medium describes in detail, in this post, how his team tackles the “hot key” issue.
The impact on Medium’s users
Since it can be difficult to predict when DynamoDB will throttle requests on a partitioned table, Medium also tracks how throttling is affecting its users.
DynamoDB’s API automatically retries its queries if they are throttled so the vast majority of Medium’s throttled requests eventually succeed.
Using Datadog, Medium created the two graphs below. The bottom graph tracks each throttled request “as seen by CloudWatch”. The top graph, “as seen by the apps”, tracks requests that failed, despite retries. Note that there are about two orders of magnitude more throttling events than failed requests. That means retries work, which is good since throttling may only slow down page loads, while failed requests can cause user-facing issues.
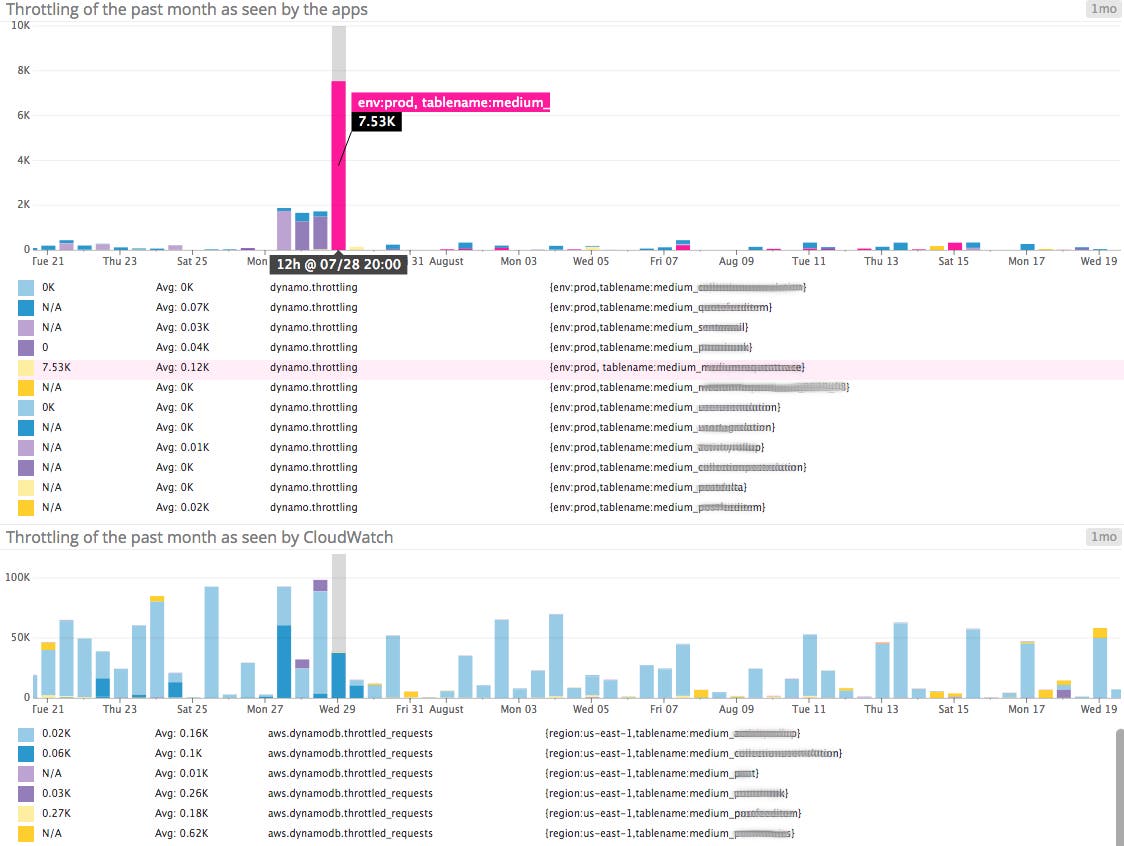
In order to track throttling as seen by the app, Medium created a custom throttling metric: Each time that Medium’s application receives an error response from DynamoDB, it checks the type of error. If it’s a ProvisionedThroughputExceededException, it increments the custom metric. The metric is reported to Datadog via DogStatsD, which implements the StatsD protocol (along with a few extensions for Datadog features). This approach also has the secondary benefit of providing real-time metrics and alerts on user-facing errors, rather than waiting through the slight delay in information from CloudWatch metrics.
In any event, Medium still has some DynamoDB-throttled requests. To reduce throttling frequency, they use Redis as a cache in front of DynamoDB, which at the same time lowers consumed throughput and cost.
Alerting the right people with the right tool
Properly alerting is essential to resolve issues as quickly as possible and preserve application performance. Medium uses Datadog’s alerting features:
- When a table on “staging” or “development” is impacted, only email notifications to people who are on call, and also send them Slack messages.
- When a table on “prod” is impacted, a page alert is also sent via PagerDuty.
Since Datadog alerts can be triggered by any metric (including custom metrics), they set up alerts on their production throttling metrics which are collected by their application for each table:
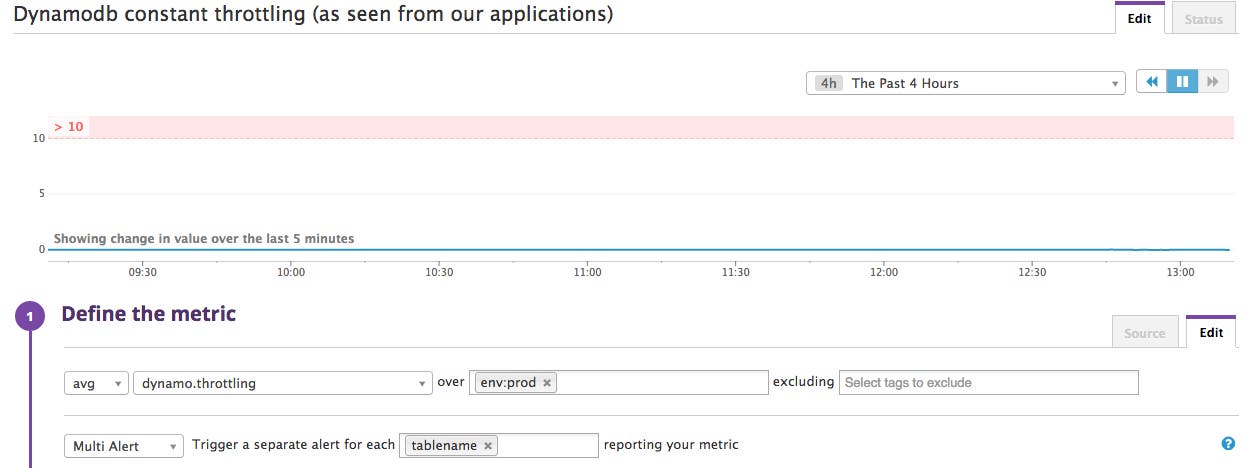
Throttled requests reported by their application mean they failed even after several retries, which means potential user-facing impact. So they send a high-priority alert, set up with the right channels and an adapted message:
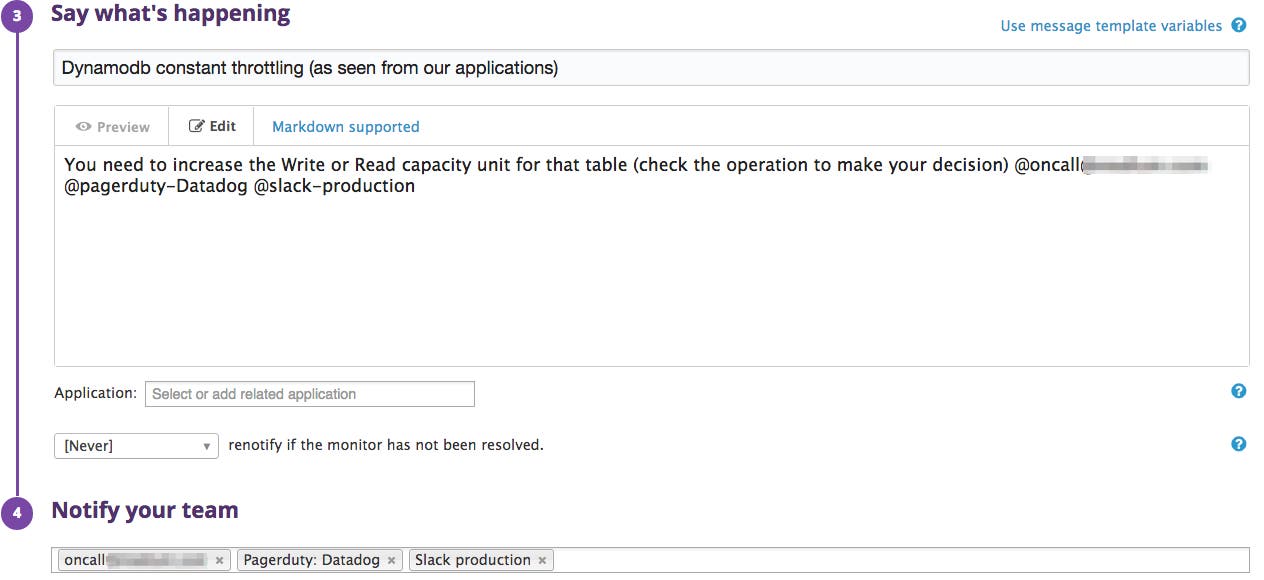
Saving money
By properly monitoring DynamoDB, Medium’s IT team can scale up easily and avoid most throttled requests to ensure an excellent user experience on their platform. But monitoring also helps them identify when they can scale down. Automatically tuning up and down the provisioned throughput for each table is on their road map and will help to optimize their infrastructure expenses.
Tracking backups
Medium’s engineering team created a Last_Backup_Age custom metric which they submit to Datadog via statsd. This metric helps Medium ensure that DynamoDB tables are backed up regularly, which reduces the risk of data loss. They graph the evolution of this metric on their Datadog dashboard and trigger an alert if too much time passes between backups.
Acknowledgments
We want to thank the Medium teams who worked with us to share how they monitor DynamoDB.
If you’re using DynamoDB and Datadog already, we hope that these strategies will help you gain improved visibility into what’s happening in your databases. If you don’t yet have a Datadog account, you can start tracking DynamoDB performance today with a free trial.
Source Markdown for this post is available on GitHub. Questions, corrections, additions, etc.? Please let us know.

