Jean-Mathieu Saponaro
This post is part 1 of a 3-part series on monitoring Amazon DynamoDB. Part 2 explains how to collect its metrics, and Part 3 describes the strategies Medium uses to monitor DynamoDB.
What is DynamoDB?
DynamoDB is a hosted NoSQL database service offered by AWS. Fast and easily scalable, it is meant to serve applications which require very low latency, even when dealing with large amounts of data. It supports both document and key-value store models, and has properties of both a database and a distributed hash table.
Each table of data created in DynamoDB is synchronously replicated across three availability zones (AZs) to ensure high availability and data durability.
With a flexible data model, high performance, reliability, and a simple but powerful API, DynamoDB is widely used by websites, mobile apps, games, and IoT devices. It is also used internally at Amazon to power many of its services, including S3.
Amazon’s original paper on DynamoDB inspired the creation of several other datastores including Cassandra, Aerospike, Voldemort and Riak.
Key DynamoDB performance metrics
In order to correctly provision DynamoDB, and to keep your applications running smoothly, it is important to understand and track key performance metrics in the following areas:
This article references metric terminology introduced in our Monitoring 101 series, which provides a framework for metric collection and alerting.

What DynamoDB can’t see
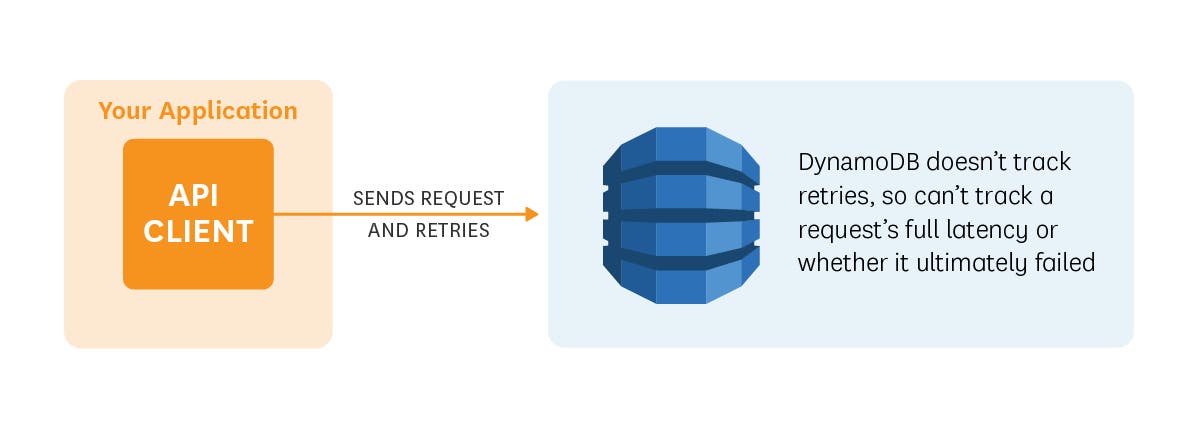
Most DynamoDB API clients automatically implement retries. This is great because if, for example, a request fails due to throttling, it may eventually succeed without sending your application an error. However because retries are completely managed on the client side, DynamoDB can’t track them.

All the metrics discussed in this first post can be collected from DynamoDB via AWS CloudWatch, as detailed in the second post of this series. But since DynamoDB is not aware of retries, metrics do not capture the full lifetime of a request. This means, for example, that SuccessfulRequestLatency only measures the latency of a successful query attempt and doesn’t add latency for retried failures. This can add complexity to your database performance analysis, but other good monitoring strategies exist, such as those employed by Medium, as described in Part 3.
Requests and throttling
Terminology:
Many DynamoDB performance metrics are defined on the basis of a unit.
- A unit of read capacity represents one “strongly consistent” read request per second or two “eventually consistent” reads per second, for items up to 4 KB. See DynamoDB FAQ for the definitions of “strongly” and “eventually consistent”.
- A unit of write capacity represents one write request per second for items as large as 1 KB.
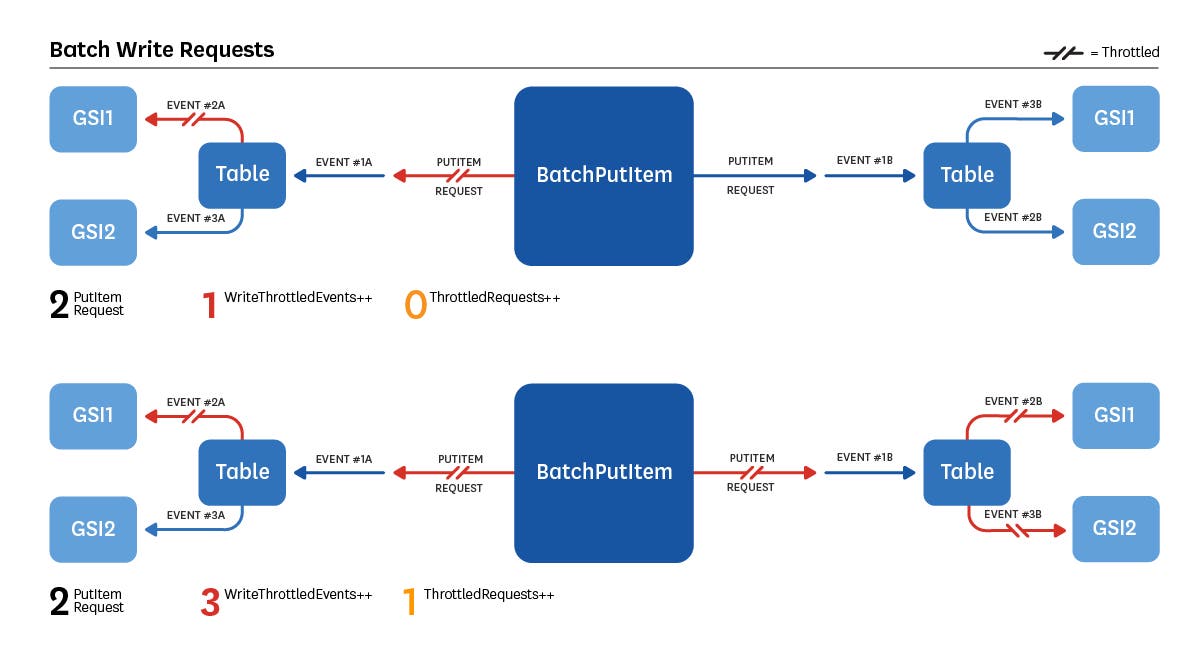
A single request can result in multiple read or write “events”, all consuming throughput. For example:
- A
BatchGetItemrequest which reads five items results in fiveGetItemevents. - A
PutItemrequest (write) on a table with two global secondary indexes triggers three events: one write in the table, and one in each of the two indexes.
Key metrics:
Metrics related to read and write queries should be monitored for each DynamoDB table separately.
| Name | Description | Metric Type |
|---|---|---|
| SuccessfulRequest-Latency | Response time (in ms) of successful requests in the selected time period (min, max, avg). Also can report an estimated number of successful requests (data samples). | Work: Performance |
| ConsumedRead-CapacityUnits | Number of read capacity units consumed during the selected time period (min, max, avg, sum). | Resource: Utilization |
| ConsumedWrite-CapacityUnits | Number of write capacity units consumed during the selected time period (min, max, avg, sum). | Resource: Utilization |
| ProvisionedRead-CapacityUnits | Number of read capacity units you provisioned for a table (or a global secondary index) during the selected time period (min, max, avg, sum). | Other |
| ProvisionedWrite-CapacityUnits | Number of write capacity units you provisioned for a table (or a global secondary index) during the selected time period (min, max, avg, sum). | Other |
| ReadThrottleEvents | Number of read events which exceeded your provisioned read throughput in the selected time period (sum). | Resource: Saturation |
| WriteThrottleEvents | Number of write events which exceeded your provisioned write throughput in the selected time period (sum). | Resource: Saturation |
| ThrottledRequests | Number of user requests containing at least 1 event that exceeded your provisioned throughput in the selected time period (sum). | Resource: Saturation |
ThrottledRequests is not necessarily incremented every time ReadThrottleEvents or WriteThrottleEvents are. The diagrams below illustrate several such scenarios.


Metrics to alert on:
-
SuccessfulRequestLatency: If you see this number increasing above normal levels, you should quickly investigate since it can significantly impact your application’s performance. It can be caused by network issues, or requests taking too much time due to your table design. In this case, using Global Secondary Indexes can help maintain reasonable performance.
As described above,SuccessfulRequestLatencyonly measures successful request attempts. So requests that were retried because of throttling, but then succeeded, will likely still appear to be within normal latency ranges, despite taking longer to complete. -
ConsumedReadCapacityUnitsandConsumedWriteCapacityUnits: Tracking changes in read and write consumed capacity allows you to spot abnormal peaks or drops in read/write activities. In particular you can make sure they don’t exceed their provisioned capacity (ProvisionedReadCapacityUnitsandProvisionedWriteCapacityUnits), which would result in throttled requests. You might want to set up a first alert before you consume your entire capacity—it could trigger at a threshold of 80% for example. This would give you time to scale up capacity before any requests are throttled. This safety margin is especially useful since CloudWatch metrics might be collected with a slight delay, so your requests might be throttled before you know you have exceeded capacity. As discussed in Part 3, automatic table partitioning can confound your ability to anticipate throttling, so we take you behind the scenes with Medium’s engineering team, to learn their tricks for avoiding throttling. -
ReadThrottleEventsandWriteThrottleEvents: These metrics should always be equal to zero. If your provisioned read or write throughput is exceeded by one event, the request is throttled and a 400 error (Bad request) will be returned to the API client, but not necessarily to your application thanks to retries. Note that theUserErrorsmetric mentioned below won’t be incremented.
When a request gets throttled, the DynamoDB API client can automatically retry it. As mentioned above however, this means that there is no DynamoDB performance metric which increments when the request completely fails after all its retries—DynamoDB does not know if another retry will be attempted.
The most important thing you can do to keep DynamoDB healthy is to make sure your provisioned throughput is always sufficient to meet your application needs. As explained, this can be tricky. Some independent tools, such as Dynamic DynamoDB, can help somewhat by automatically adjusting your provisioned capacity according to the consumption variations. However these tools should be configured very carefully since your costs will be impacted.

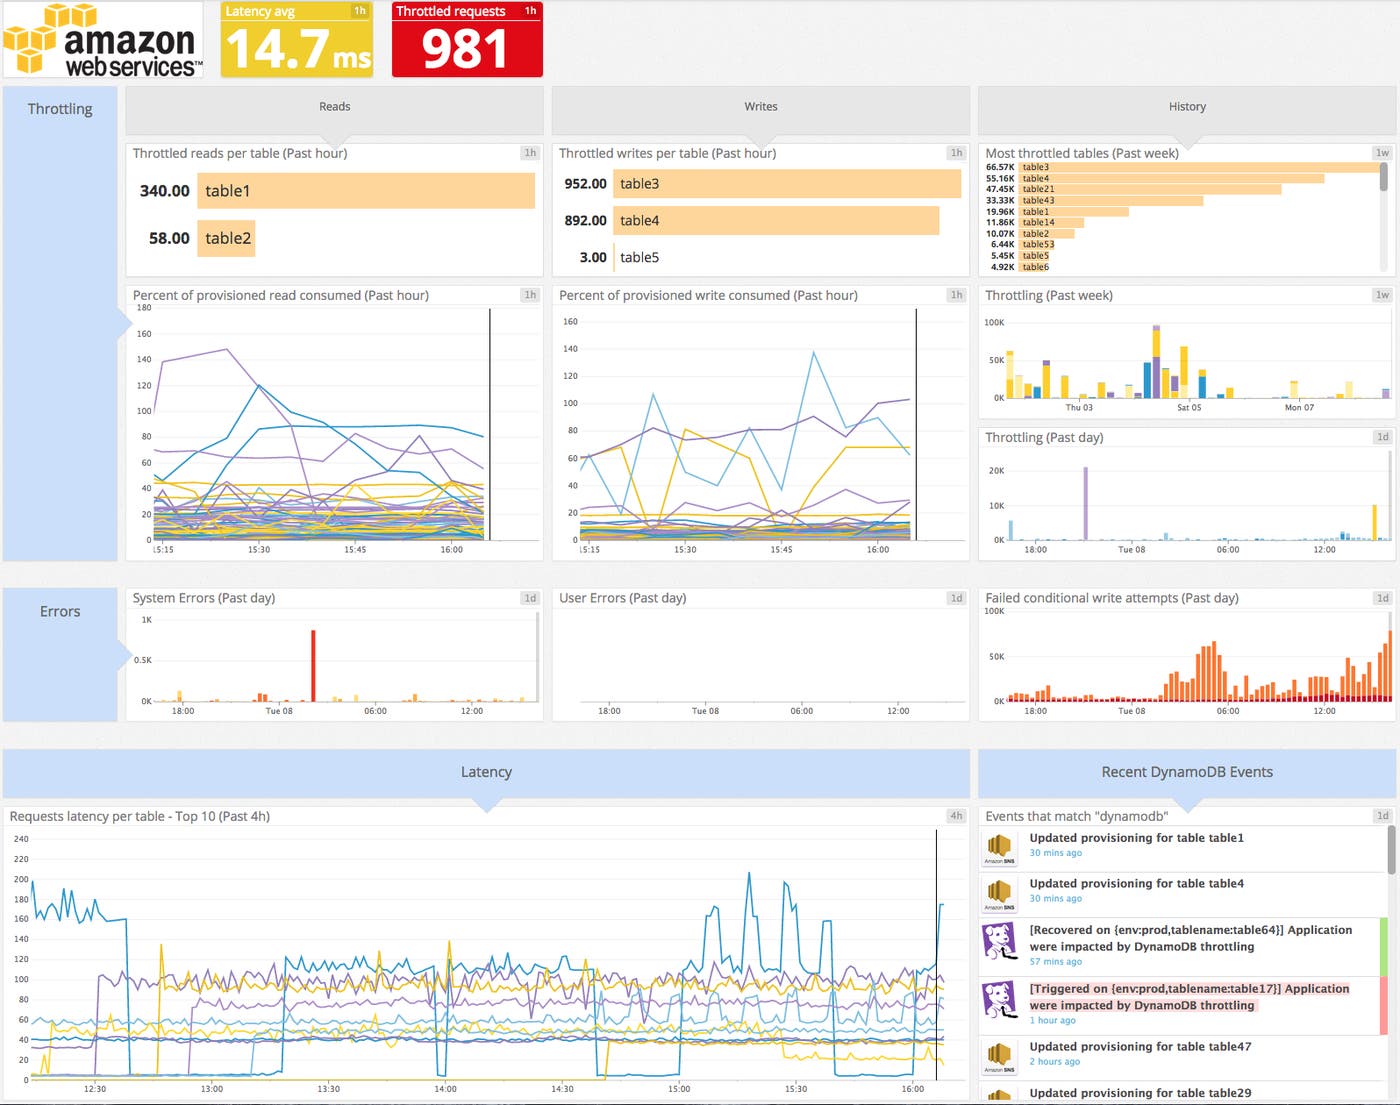
As you can see on these graphs, consumed capacity can briefly spike above 100%. This is because DynamoDB allows a small amount of “burst capacity”. When a table’s throughput is not fully used, DynamoDB saves a portion of this unused capacity for eventual future “bursts” of read or write throughput. However you can’t know exactly how much is available, it can be consumed very quickly, and AWS can use it for background maintenance tasks without warning. For these reasons, it is a bad idea to rely on burst capacity when provisioning your throughput.
Catching throttled requests:
If your application needs to catch throttled read/write requests, look for error code ProvisionedThroughputExceededException, not ThrottlingException. The ThrottlingException error code is reserved for DDL requests (i.e CreateTable, UpdateTable, DeleteTable).
Errors
| Name | Description | Metric Type |
|---|---|---|
| ConditionalCheck-FailedRequests | Number of failed conditional write attempts in the selected time period. | Other |
| UserErrors | Number of requests generating an HTTP 400 error in the selected time period. | Work: Error |
| SystemErrors | Number of requests resulting in an HTTP 500 error in the selected time period. | Work: Error |
Metrics to alert on:
ConditionalCheckFailedRequests: During a write request like PutItem, UpdateItem or DeleteItem operations, you can define a logical condition that defines whether the item can be modified or not: e.g. the item can be updated only if it’s not marked as “protected”. This logical condition has to return “true” to allow the operation to proceed. If it returns “false”, this metric is incremented and a 400 error (Bad request) is returned. Note that it doesn’t incrementUserErrors.UserErrors: If your client application is interacting correctly with DynamoDB, this metric should always be equal to zero. It is incremented for any 400 error listed here except forProvisionedThroughputExceededException, ThrottlingException,andConditionalCheckFailedException. It is usually due to a client error such as an authentication failure.SystemErrors: This metric should always be equal to zero. If it is not, you may want to get involved—perhaps restarting portions of the service, temporarily disabling some functionality in your application, or getting in touch with AWS support.

Global Secondary Index creation
What is a Global Secondary Index?
When creating a new table, you have to select its primary key. If you need to query by other attributes, the request might take a long time. Indeed some of them will need to scan the entire table to retrieve the information requested. To speed up non-primary-key queries, DynamoDB offers Global Secondary Indexes (GSI) which increase the performance of these queries on non-key attributes.
Key metrics to watch when creating a GSI
When creating a Global Secondary Index from a table, DynamoDB has to allocate resources for this new index and then backfill attributes from the table to the GSI which consumes some of your provisioned capacity. This process can take a long time, especially for large tables, so you should monitor related metrics during GSI creation.
| Name | Description | Metric Type |
|---|---|---|
| OnlineIndexConsumedWrite-Capacity | Number of write capacity units consumed when creating a new GSI on a table. | Resource: Utilization |
| OnlineIndexPercentage-Progress | Percentage of completion of the creation of a new GSI. | Other |
| OnlineIndexThrottleEvents | Number of write throttling events that happened when creating a new GSI. | Resource: Saturation |
OnlineIndexPercentageProgress allows you to follow the progress of the creation of a Global Secondary Index. You should keep an eye on this metric and correlate it with the rest of your DynamoDB performance metrics to make sure the index creation doesn’t impact overall performance. If the index takes too much time to build, it might be due to throttled events so you should check the OnlineIndexThrottleEvents metric.
Metrics to watch when creating a GSI:
OnlineIndexConsumedWriteCapacity: This metric should be monitored when a new GSI is being created so you can be aware if you didn’t provisioned enough capacity. If that’s the case, incoming write requests happening during the index building phase might be throttled which will severely slow down its creation and cause upstream delays or problems. You should then adjust the index’s write capacity using theUpdateTableoperation, which can be done even if the index is still being built.
NOTE: This metric doesn’t take into account ordinary write throughput consumed during index creation.OnlineIndexThrottleEvents: Write-throttled events happening when adding a new Global Secondary Index to a table can dramatically slow down its creation. If this metric is not equal to zero, adjust the index’s write capacity usingUpdateTable. You can prevent throttling by properly monitoringOnlineIndexConsumedWriteCapacity.
NOTE: TheWriteThrottleEventsmetric doesn’t count the throttle events happening during the GSI creation.
Conclusion
In this post we have explored the most important metrics you should monitor to keep tabs on Amazon DynamoDB performance. If you are just getting started with DynamoDB, monitoring the metrics listed below will give you great insight into your database’s health and performance. Most importantly they will help you identify when it is necessary to tune the provisioned read and write capacities in order to maintain good application performance.
- Request latency
- Consumed vs. provisioned throughputs (read and write)
- Errors
- Write consumed throughput when creating a Global Secondary Index
Remember to monitor all your tables individually for better insight and understanding.
Part 2 of this post provides instructions for collecting all the metrics you need from DynamoDB.
Source Markdown for this post is available on GitHub. Questions, corrections, additions, etc.? Please let us know.


