
Jordan Obey
Senior Technical Content Writer
In 2020 we released distributed tracing for AWS Lambda functions written in Python, Node.js, and Ruby, providing you with health and performance insights across your serverless applications. Since then, we’ve expanded our support to additional Lambda runtimes such as Java and Go, and are pleased to announce that real-time distributed tracing is now also available for .NET Lambda functions. Our .NET Lambda function tracing feature is powered by the Datadog Lambda Extension to ensure .NET developers can trace all requests across their entire infrastructure with minimal overhead.
In this post, we’ll look at how tracing .NET Lambda functions can help you identify and resolve issues such as exception errors and cold starts, which can degrade performance and negatively impact the end-user experience.
Trace .NET Lambda requests across any infrastructure
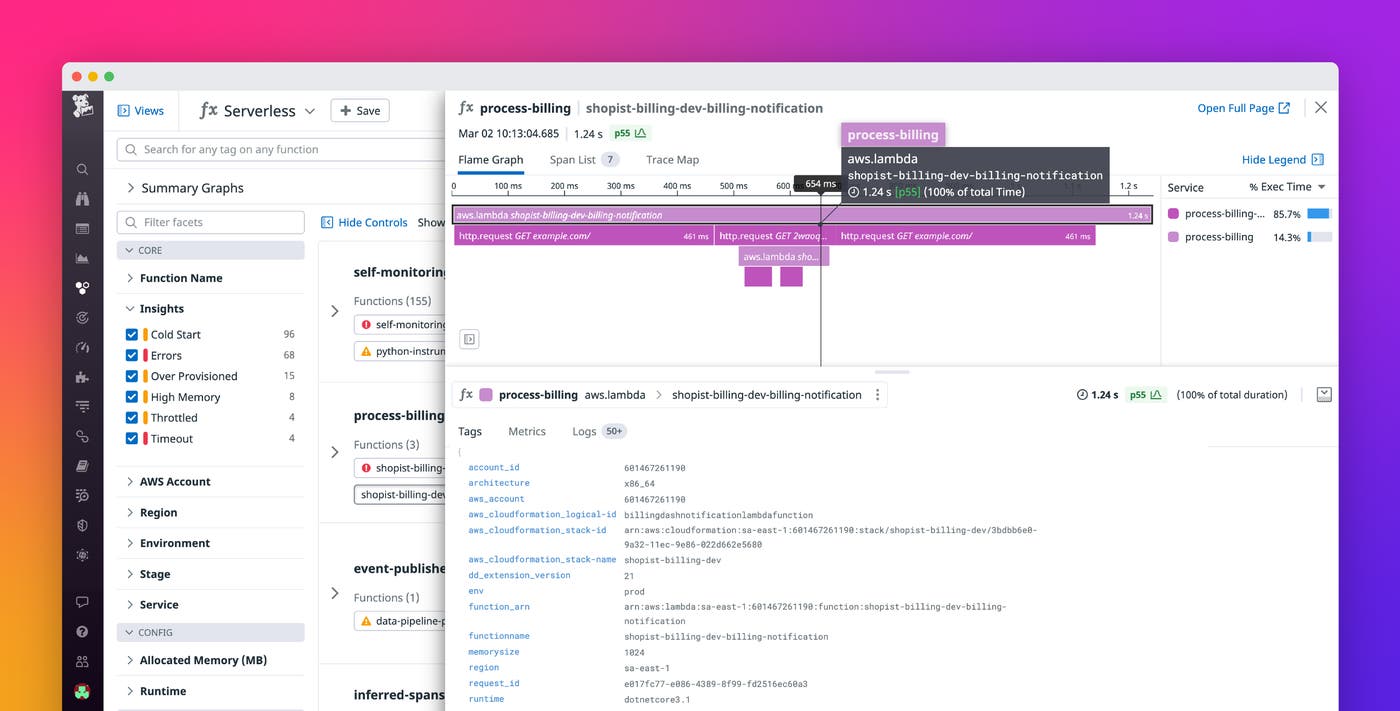
Datadog APM provides an end-to-end view of requests as they traverse any component of your infrastructure, including Lambda functions, containers, and on-prem hosts. This comprehensive visibility enables you to easily spot pain points anywhere in your system without code or configuration changes. For example, your application may run in a hybrid environment with .NET Lambda functions that are invoked by local and cloud-hosted services. If you notice a spike in latency, you can follow request traces across your entire infrastructure to identify bottlenecks and determine whether .NET Lambda function errors are behind the issue.
Spot code-level issues in your .NET Lambda functions
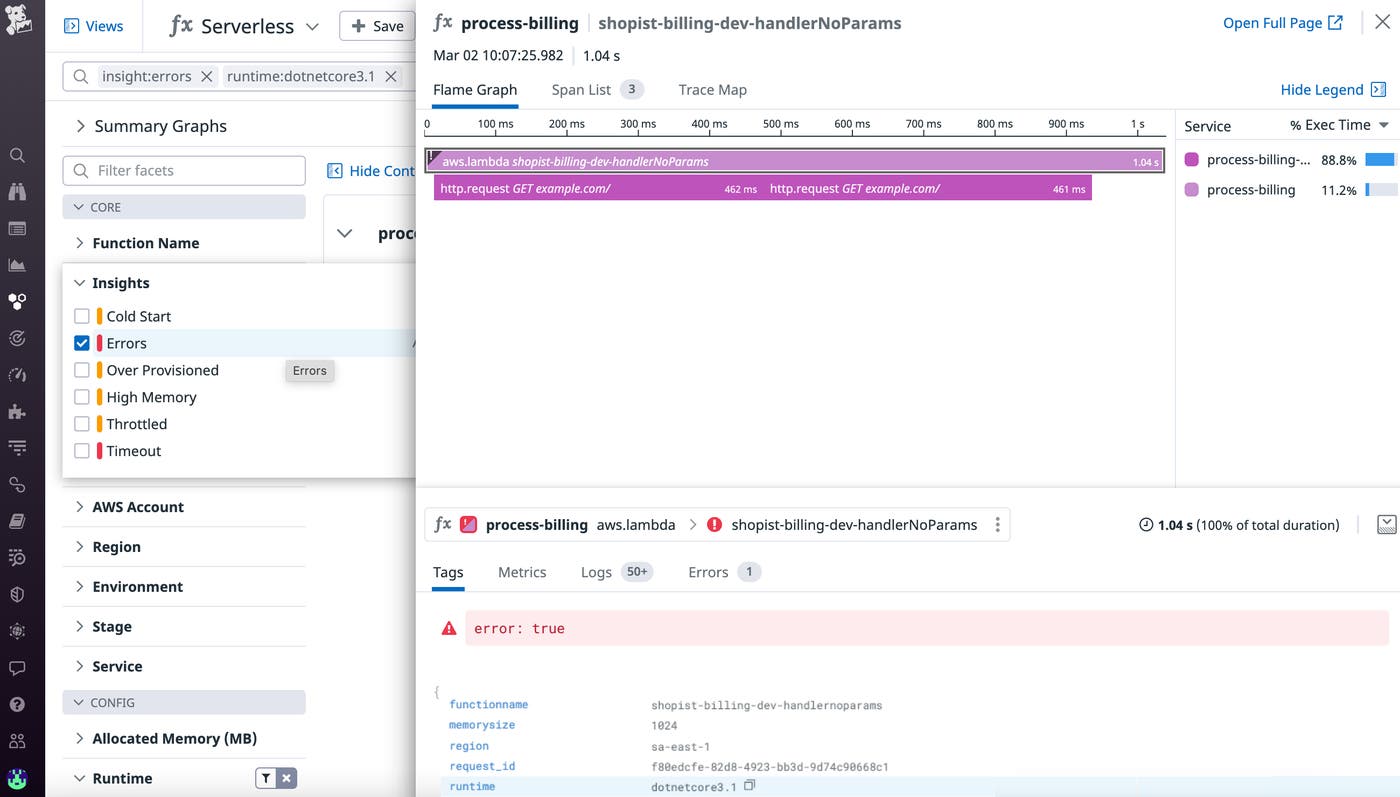
Besides providing you with a high-level view of request paths, Datadog APM can also help you discover code-level issues in your .NET Lambda functions. For example, function spans may be marked with divide-by-zero or null reference errors, indicating that your functions are encountering unexpected exceptions that require mitigation. You can also check whether Lambda functions that include WebRequest.GetResponse methods are returning WebExceptions generated by network errors, which can contribute to latency.
Detect cold starts automatically
Cold starts occur when Lambda functions take longer to initiate after periods of inactivity, and they can negatively impact the overall performance of your serverless application, regardless of runtime. In .NET, a time-consuming process called just-in-time (JIT) compilation, which converts programming languages into machine code as it is being executed, can contribute to the duration of cold starts. Because Datadog automatically flags cold starts with a cold_start tag, you can easily isolate your .NET Lambda traces with cold starts and view their durations. If you discover an increase in the duration of cold starts, consider implementing ReadyToRun (R2R) compilation in your application, which can help reduce cold start times by compiling code before it’s executed.
Get started with .NET Lambda tracing today
Datadog APM, which now includes full support for .NET Lambda functions, helps you gain real-time visibility into your serverless applications by enabling you to view trace requests from end to end. You can also easily correlate .NET traces with other serverless telemetry available through Datadog’s Lambda Library and Lambda Extension, including logs and enhanced metrics, to gain further insight into any issue. To learn more about serverless tracing with Datadog, please read our documentation. If you’re not already a Datadog customer, sign up today for a 14-day free trial.
