Khang Truong

Evan Marcantonio

Capucine Marteau
In the early stages of building a system, a few well-placed dashboards and monitors can provide sufficient visibility into service health and performance. However, as infrastructure scales and teams grow, so does the complexity of the monitoring landscape. In organizations where individual teams manage their own services but rely on a central platform or observability team for tooling and guidance, this complexity can quickly multiply. What starts as a simple observability setup can rapidly evolve into a fragmented ecosystem of redundant dashboards, stale or noisy alerts, and unclear ownership.
Without a deliberate strategy, teams risk being overwhelmed by alert fatigue, misaligned metrics, and dashboards that no longer reflect reality. This post will highlight the pitfalls of a poorly scaled observability system and discuss strategies for designing monitors and dashboards that grow with your organization.
Growing pains of scaling
As systems grow, teams multiply, services scale out, and the simplicity of only a few critical components that represent your observability landscape starts to fade. Dashboards start to pile up, and it becomes difficult to know which ones reflect the current state and which others are abandoned or irrelevant. During an incident, different team members might rely on different dashboards showing slightly different data or have a hard time identifying which dashboards to go to for deeper investigation. There’s no clear source of truth, which slows down triage and creates confusion about what’s actually happening.
New services also bring new monitors, but not always with careful tuning or thoughtful alert thresholds. Teams are often under pressure to just get something in place, and as a result, many alerts fire too often or not when they should. Without ownership or governance, some monitors fall out of sync with the systems they’re meant to observe. The noise creeps in as on-call engineers get paged for issues that don’t matter; or worse, they miss critical ones that do. Over time, teams stop responding to alerts promptly, and the mental cost of navigating incident response increases.
These challenges aren’t signs of failure, but are signs of growth that mark a critical point in an organization’s observability journey. To support scale without sacrificing clarity, you need to shift from ad hoc setups to structured, actionable dashboards and monitors with consistent tagging, effective naming conventions, and clear ownership.
From alert storms to smart signals
At scale, monitor management is less about adding more alerts and more about designing a system that stays clear, actionable, and sustainable as your organization grows. This can include mapping your dependencies for APM, using exponential backoff or service checks, scheduling downtimes, or other systemic techniques that you can read more about in our blog post on reducing alert storms.
But broadly, it means two things: creating monitors that are scalable and manageable, and continuously refining the system to stay effective over time.
Create monitors that scale with your systems
The key to reversing the alert fatigue that comes with increased scale is to treat alerts not just as technical outputs, but as design decisions. Smart signals detect failures but also deliver the right context to the right team at the right time.
Every monitor you create should have a clear purpose: What is it watching? What action should be taken when it triggers? If those answers are unclear, the monitor might be noise waiting to happen. Moving from “just in case” alerting to purpose-driven design helps reduce false positives and improves on-call quality of life.
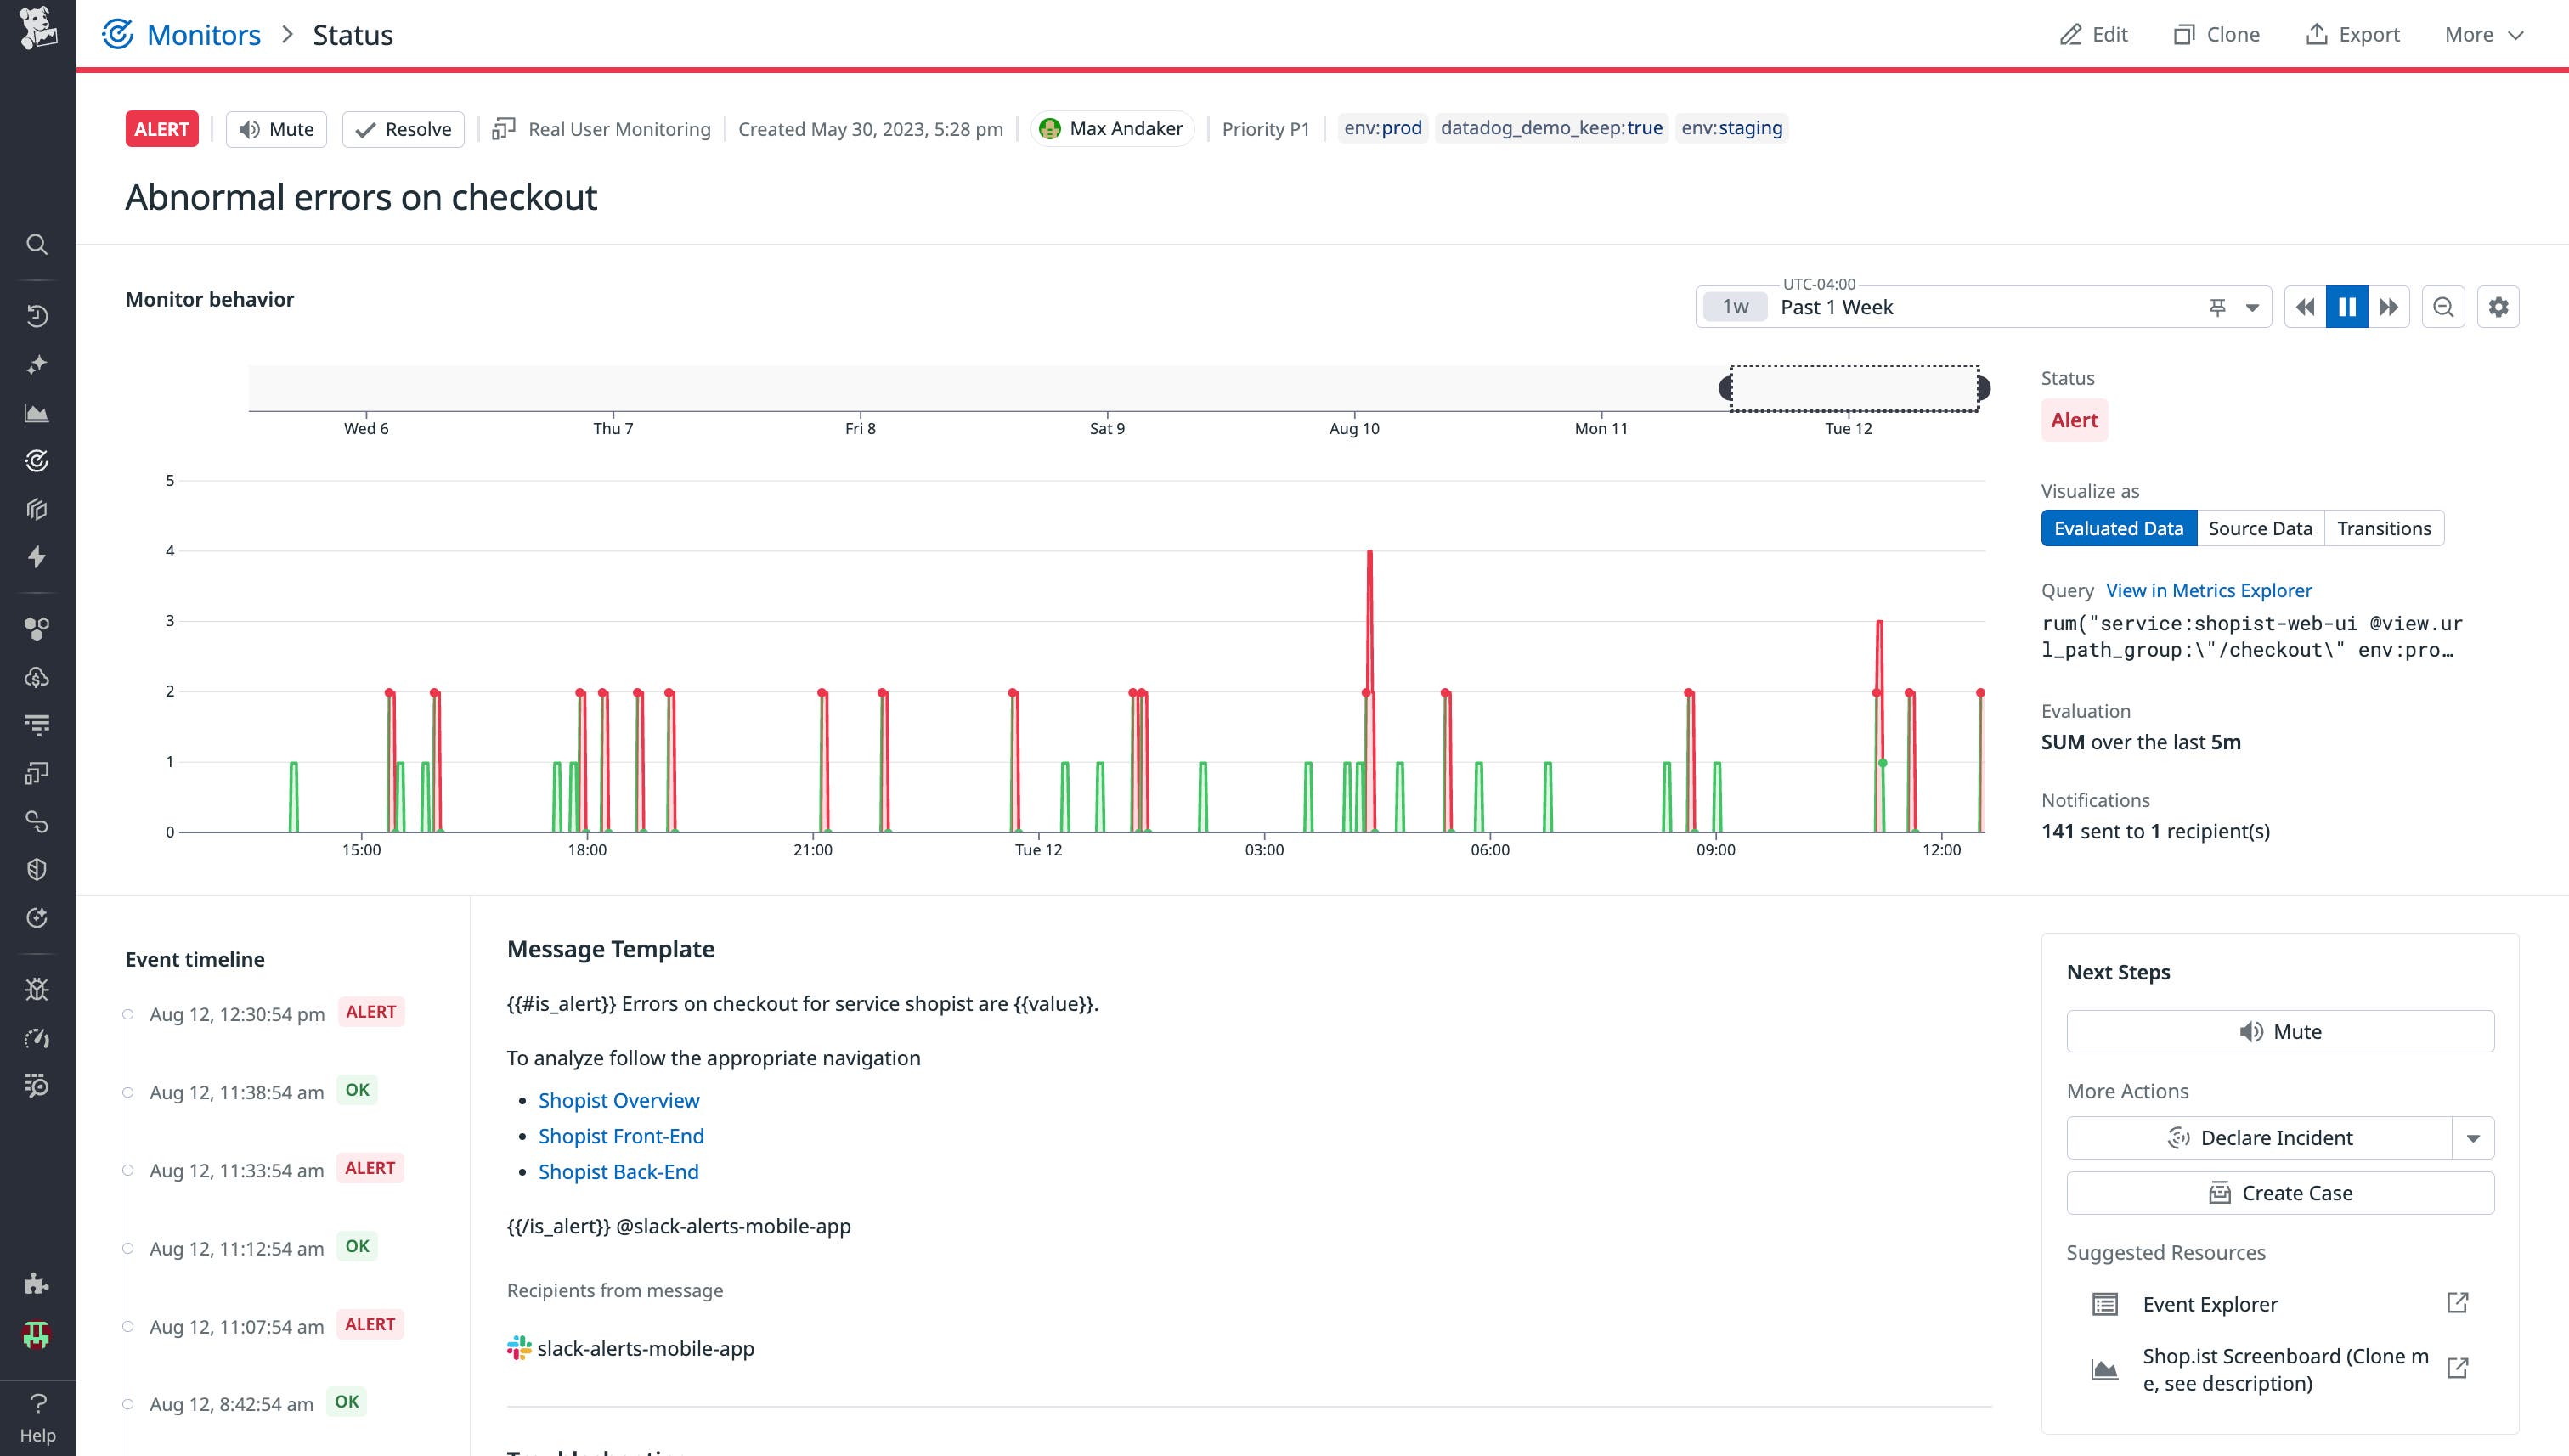
Next, focus on thresholds. Static values work for some metrics, but they don’t scale well with variable workloads or seasonality. Anomaly detection and outlier monitors help teams set dynamic thresholds that flex with real-world usage, catching unusual behavior without flagging every spike. It’s an investment in precision over volume.
Ownership also matters. Clear, team-based alert routing ensures monitors don’t become orphans or fall through the cracks. Monitor search, muting schedules, and notification integrations (like Slack and PagerDuty) make it easy to align alert behavior with team workflows, so people see what matters and ignore what doesn’t. And to take it one step further, you can use a Datadog Workflow to automatically prevent anyone outside of your team from editing your newly created monitor.
To make monitor management even more scalable, Datadog features notification rules: a centralized way to control alert destinations without editing individual monitors. Instead of modifying notification messages one by one, teams can define rules based on monitor attributes like name, status, or tags (e.g., service:web or priority:high) and route alerts to the appropriate Slack channels, PagerDuty services, or email lists.
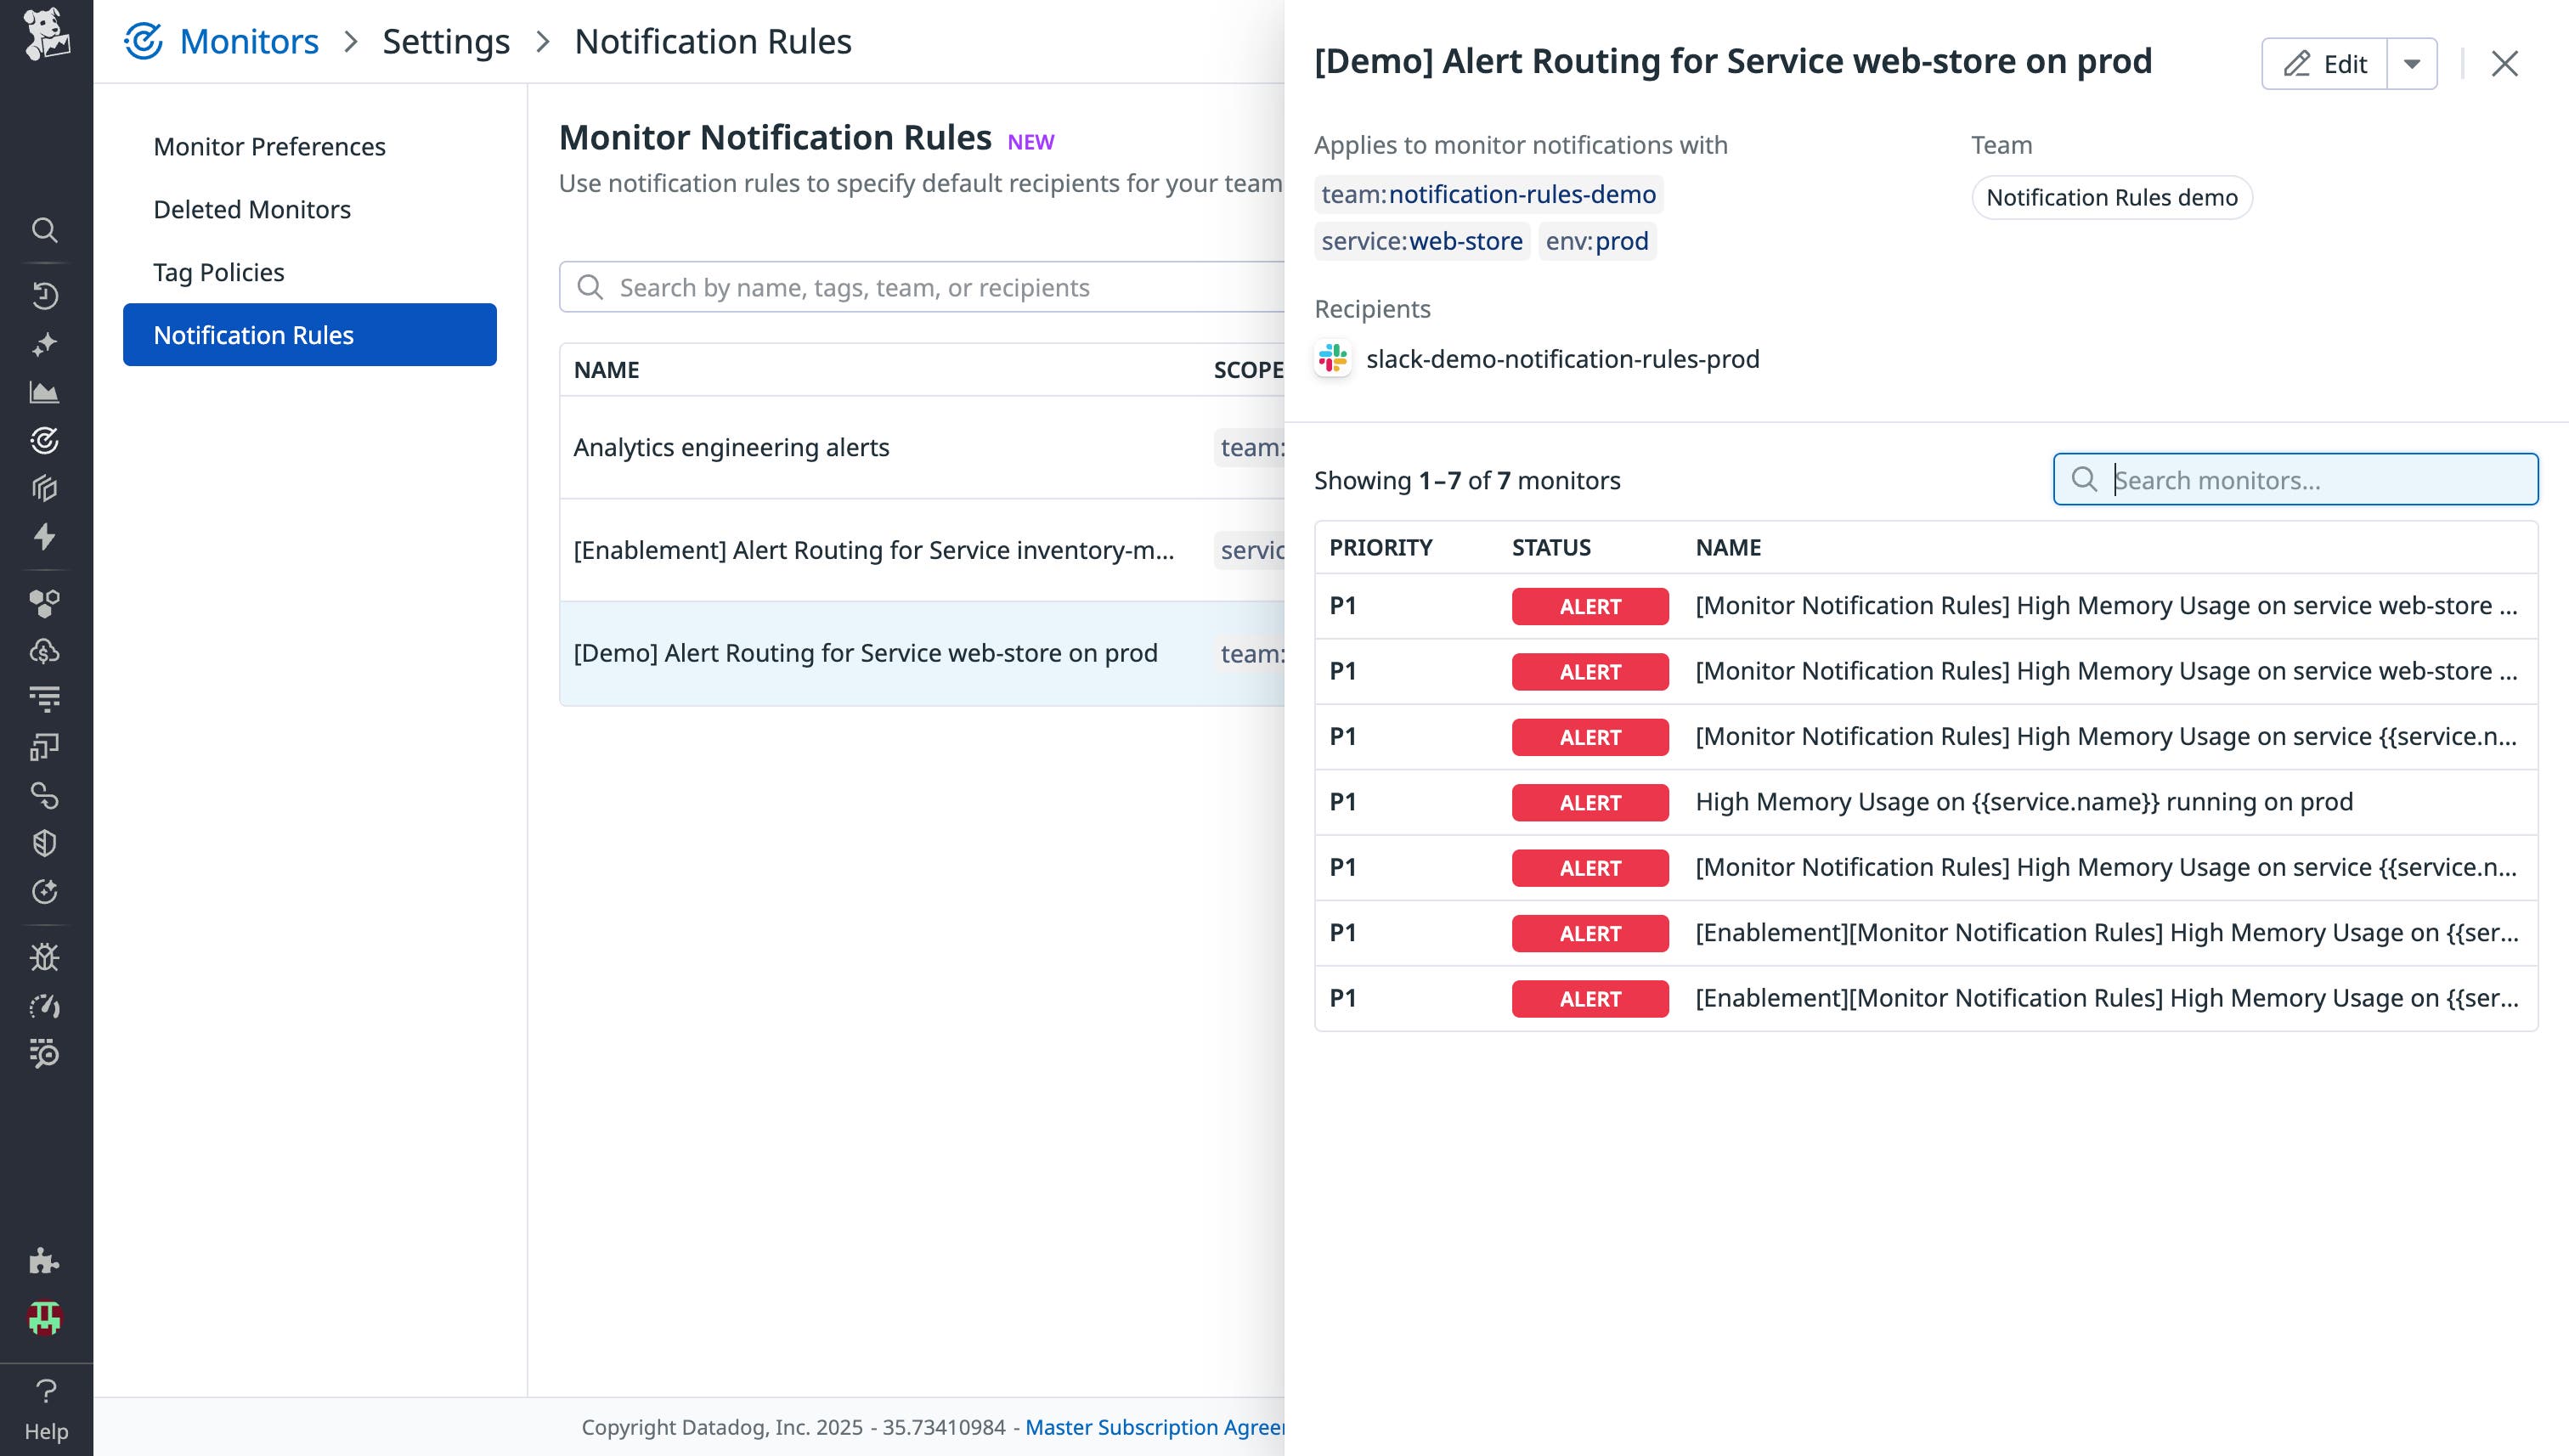
These simple but effective techniques make it much easier to adapt to organizational changes, onboard new teams, or adjust coverage, helping you and your teams alert at scale with consistency and flexibility.
Continuously refine and improve your monitors
Effective monitors are living signals that evolve alongside your systems, and the most effective teams adopt a culture of continuous refinement.
After every incident, take time to review the monitors involved: Did the right one trigger? Was it too noisy? Should the alert have escalated differently? These post-incident reflections are essential but you don’t have to rely on manual reviews alone. Datadog’s Monitor Quality feature surfaces key indicators like flapping alerts and alerts muted for too long or missing a recipient, helping you proactively identify which monitors need attention. It’s a built-in feedback loop that brings visibility to underperforming monitors and gives teams the ability to continuously improve their signal-to-noise ratio at scale.
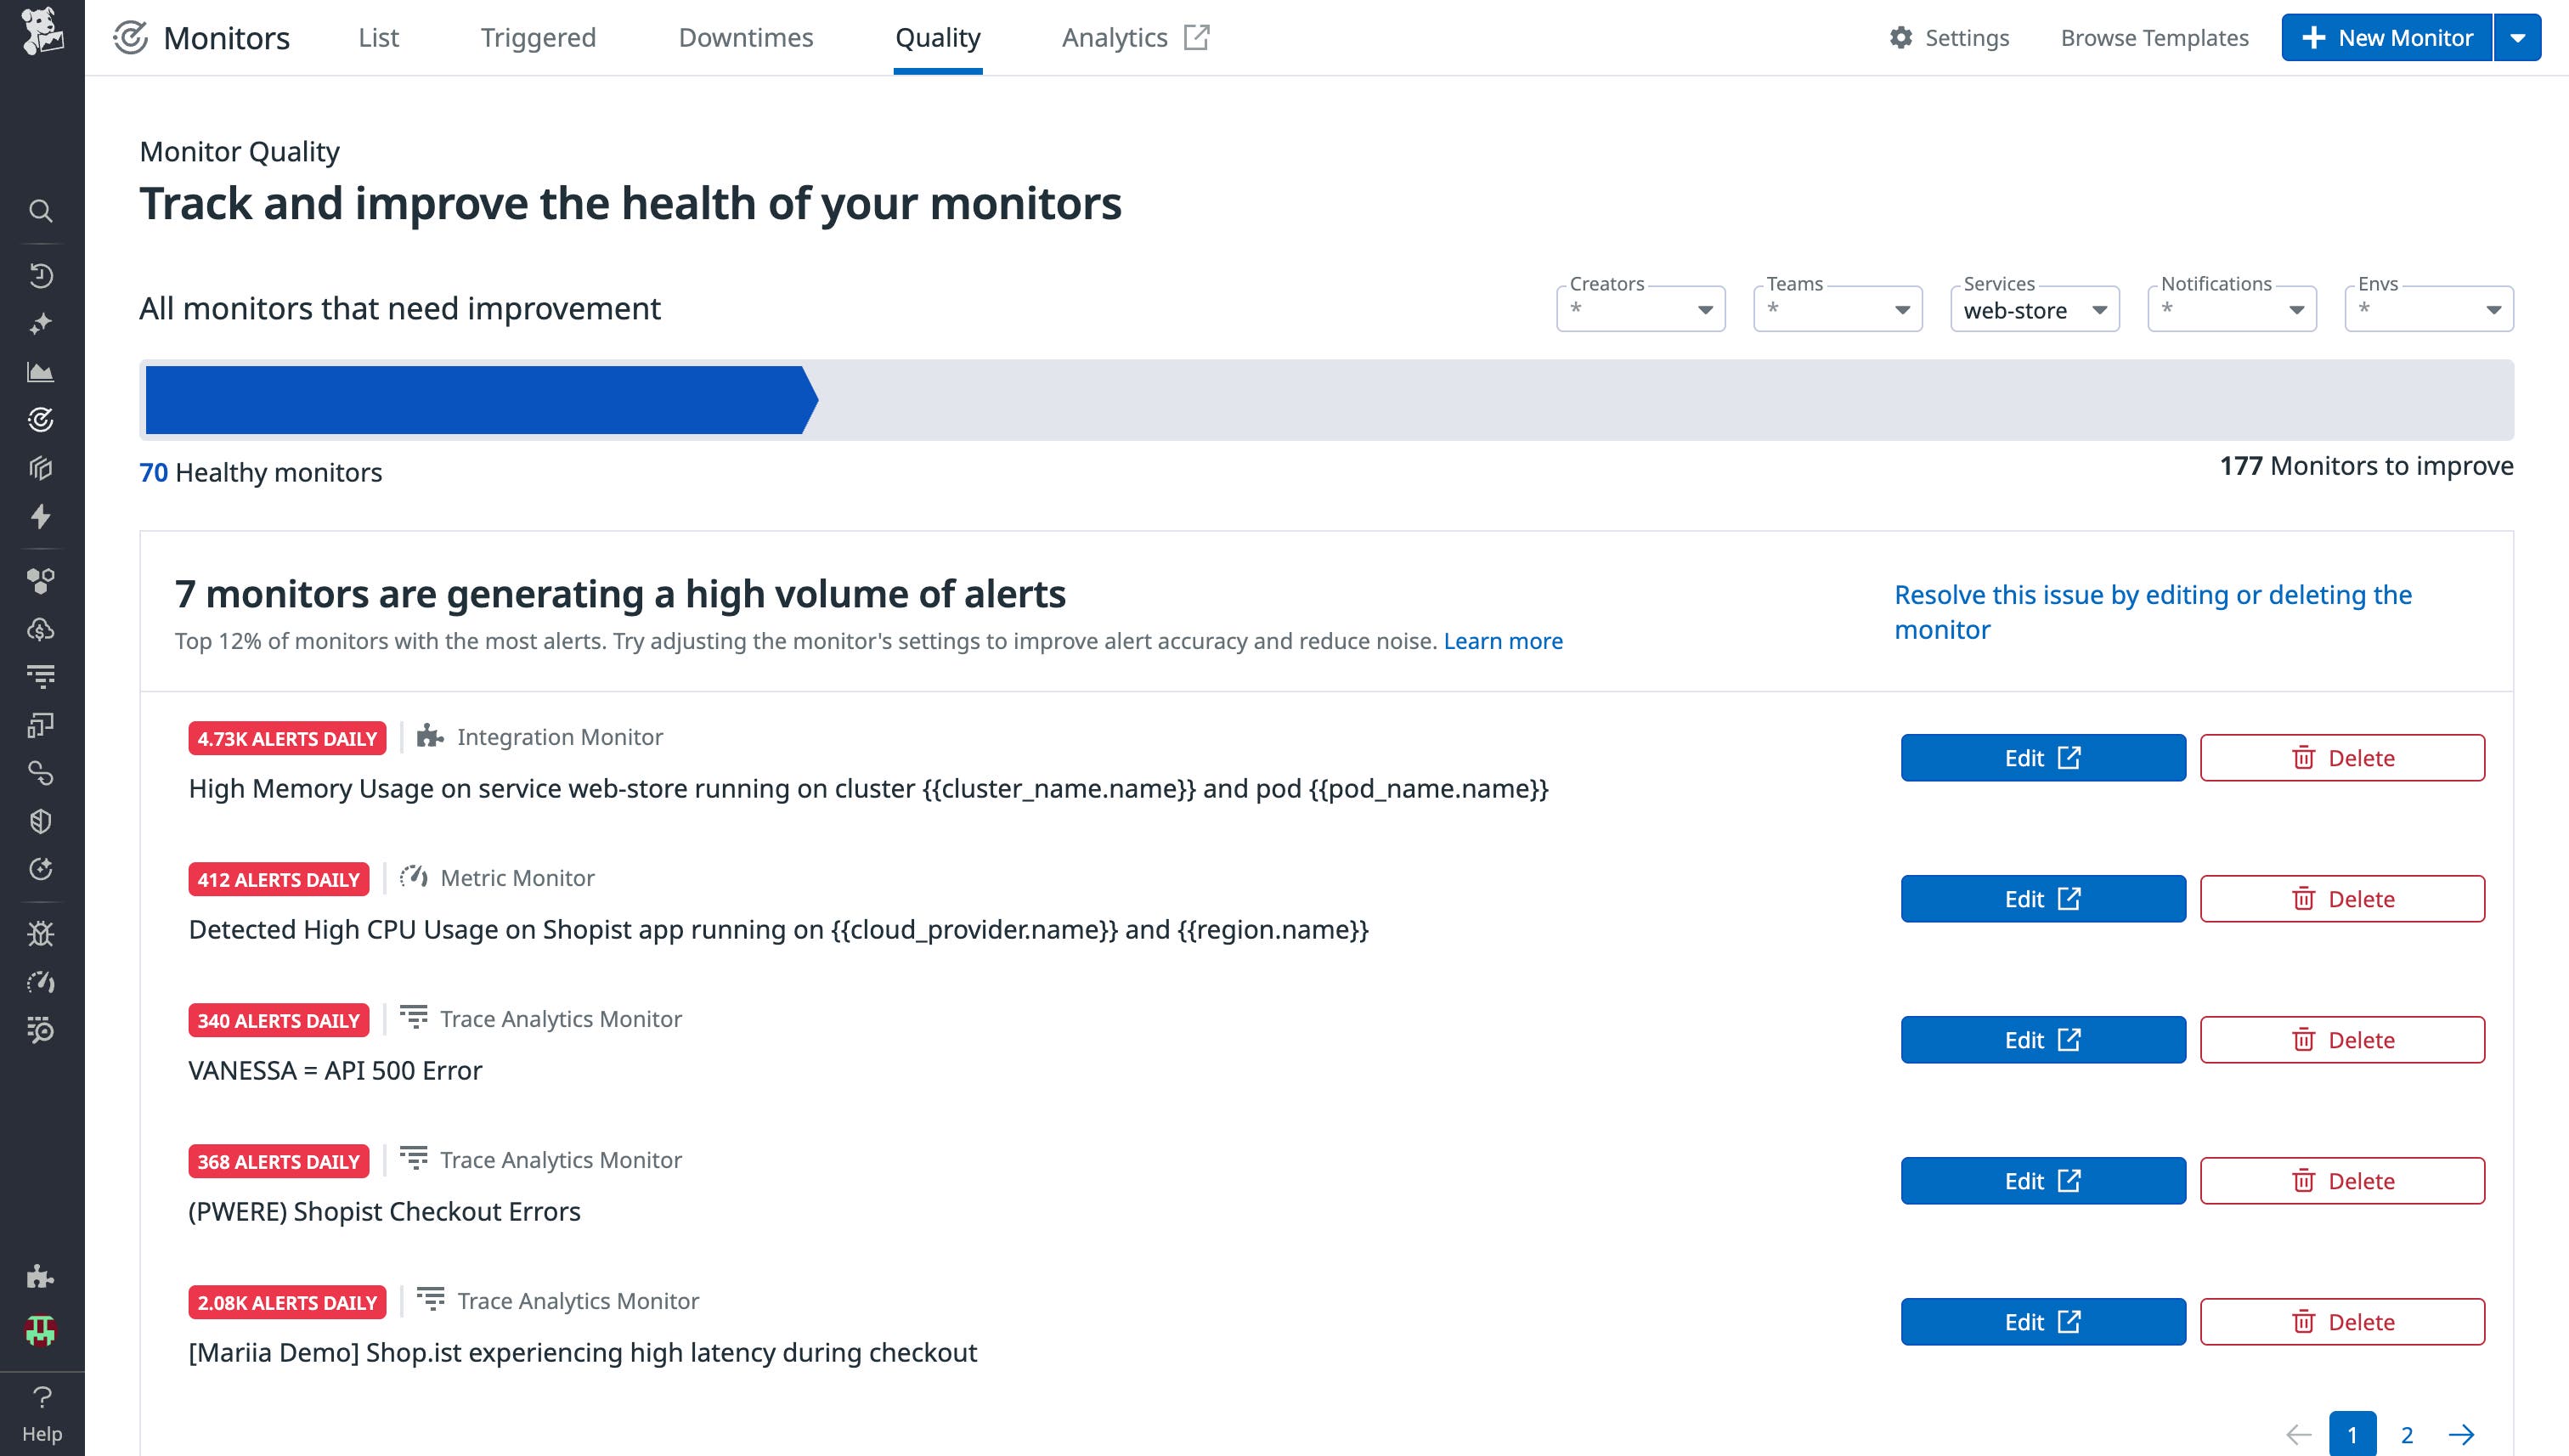
As part of designing better signals, it’s also important to periodically declutter your alerts. Over time, it’s easy for teams to accumulate monitors that were created during past incidents, one-off projects, or temporary experiments—and then never cleaned up. Setting aside time every few months to audit existing monitors can help surface what really matters, such as filtering monitors by tag, creation date, or trigger frequency to identify candidates for cleanup. Monitors that haven’t triggered in months or that overlap with newer alerts are good places to start.
Scaling alerting means designing better signals rather than creating more noise. When teams have confidence in what their monitors are telling them, they move faster, respond smarter, and trust the system they’ve built.
Design dashboards that scale with your organization
A few exploratory graphs can quickly become the foundation for real-time decision-making, cross-team alignment, and incident response. As organizations grow, dashboards are both visual aids and operational tools, and designing them to scale with your organization requires more than just adding more graphs.
The key is to treat dashboards as shared interfaces instead of personal scratchpads. That means being intentional about how they’re structured, what they show, and how they’re made discoverable. A well-designed dashboard should answer clear questions: Is the service healthy? What’s degraded? Where should I look next? To do that, consistency is crucial. Use predictable layouts, common naming patterns, and standardized visual styles so that dashboards are easy to interpret no matter who’s looking at them.
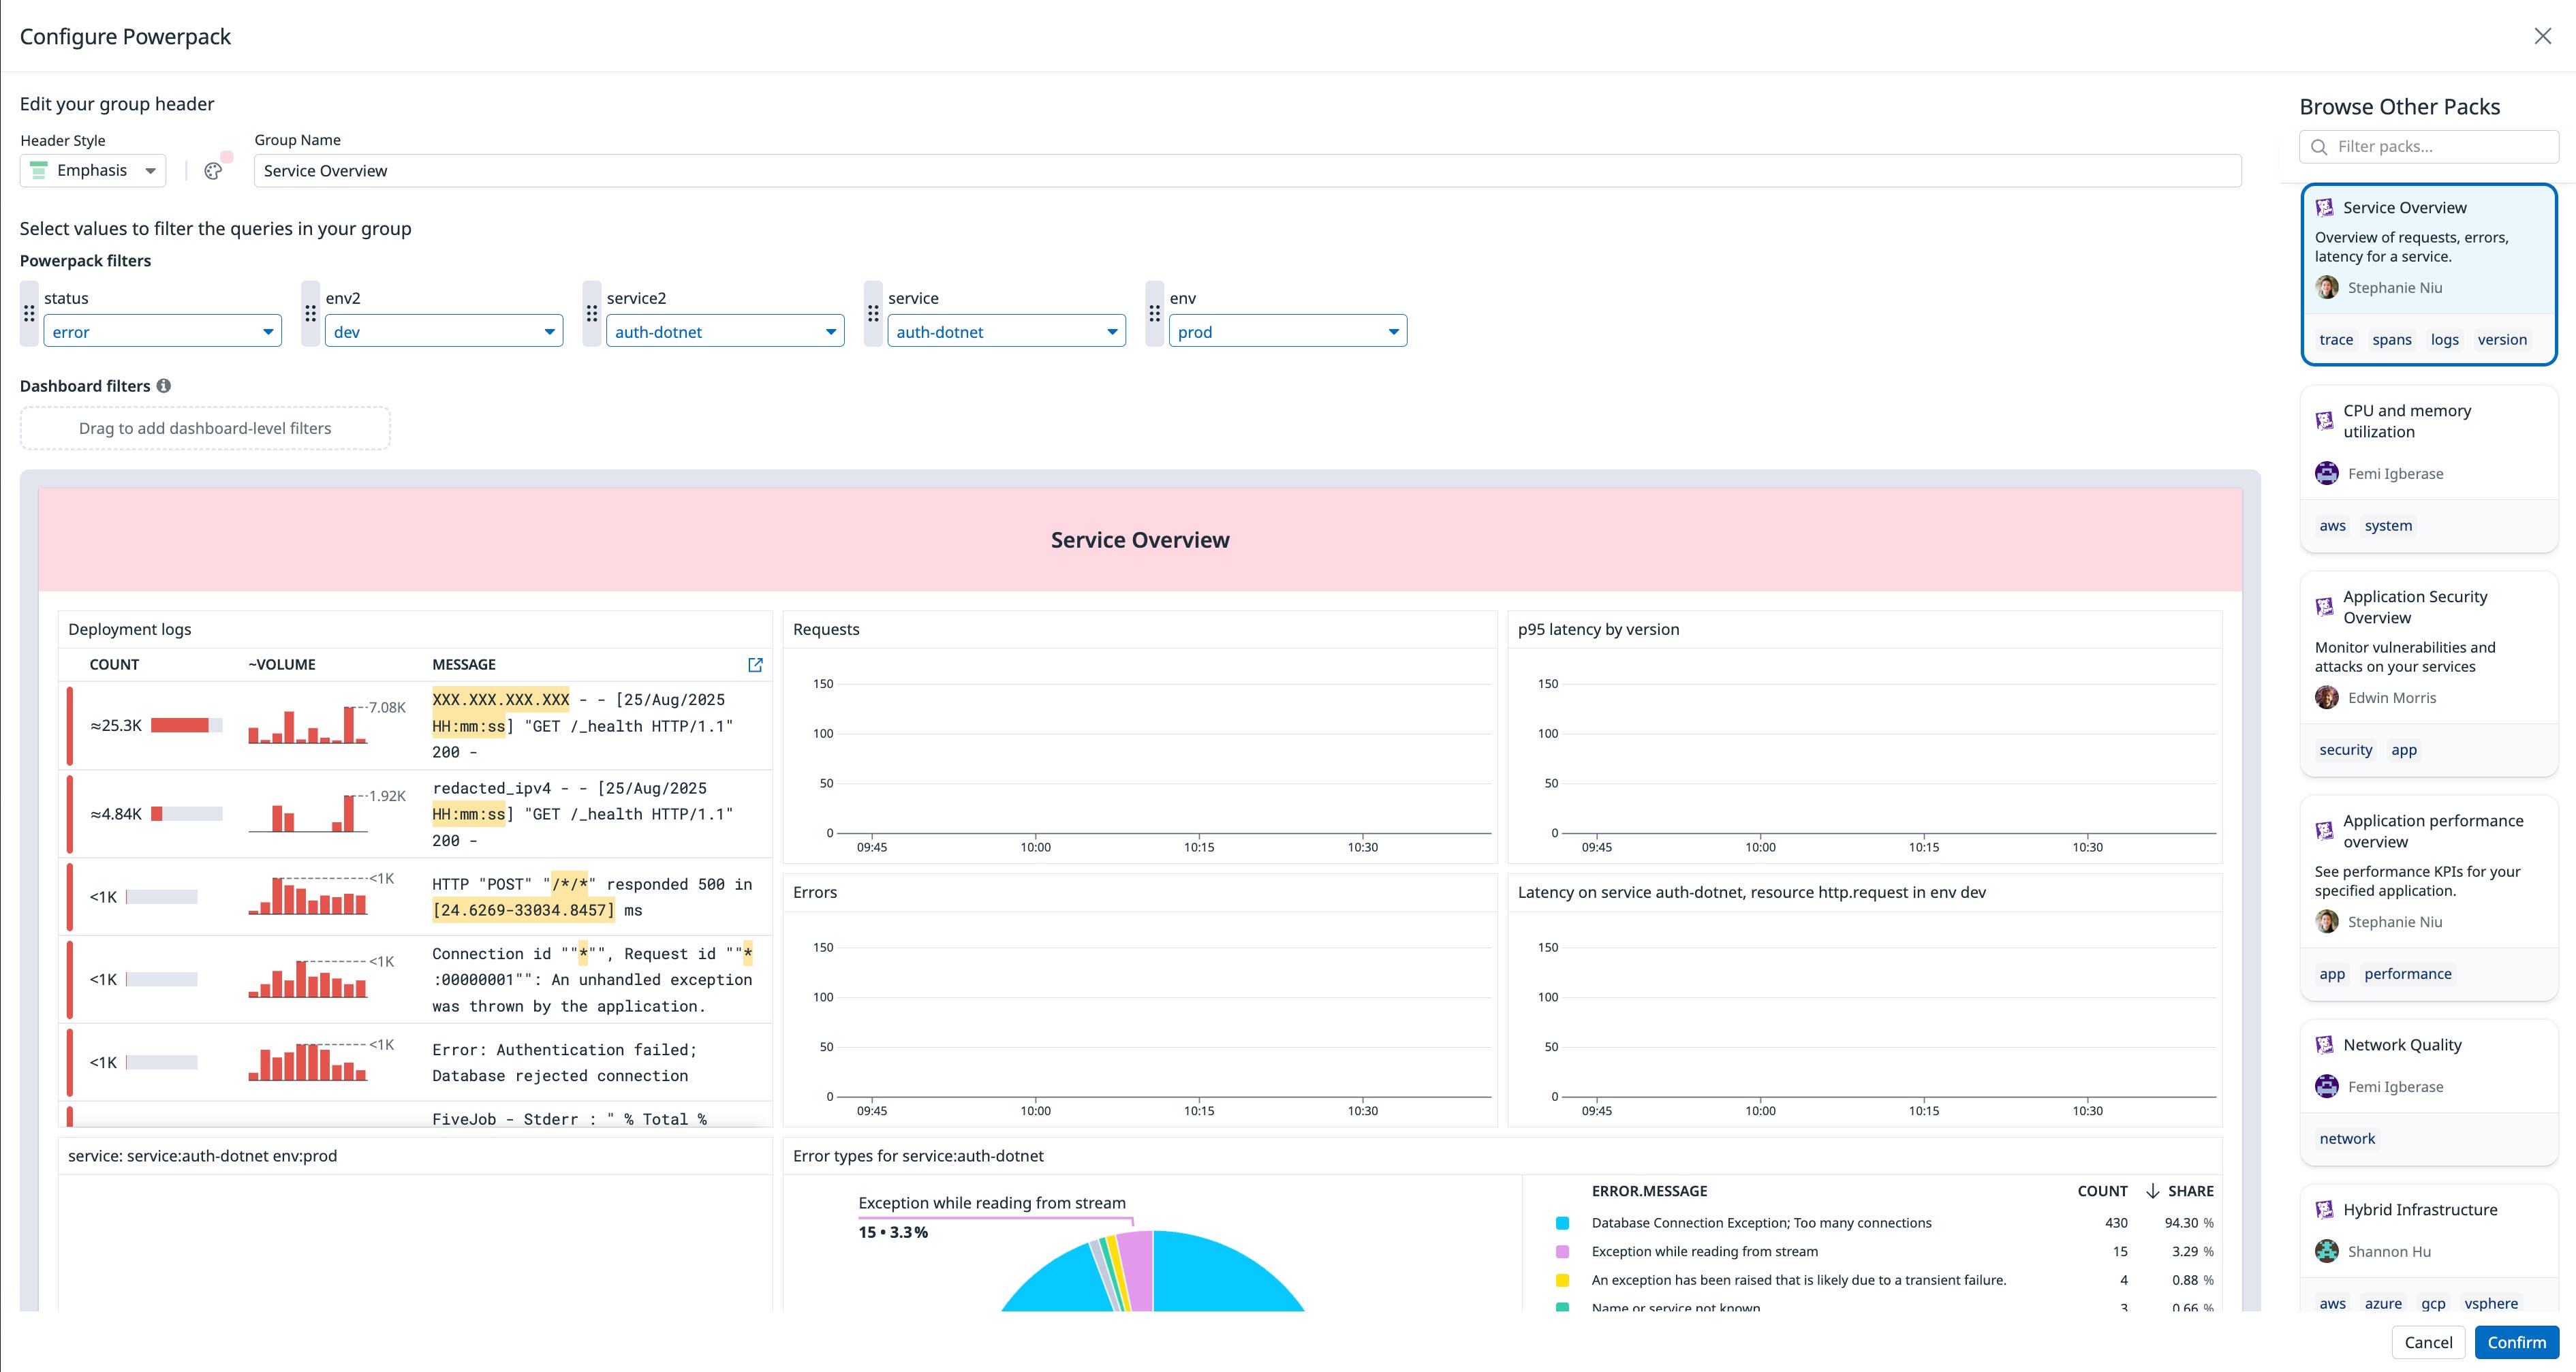
For example, with Datadog Powerpacks, platform or observability teams can curate reusable dashboard modules—such as golden signals, latency breakdowns, or error rate panels—and distribute them across the organization. This gives every team a solid starting point while maintaining visual and structural consistency across environments. It’s a powerful way to scale best practices without slowing teams down.
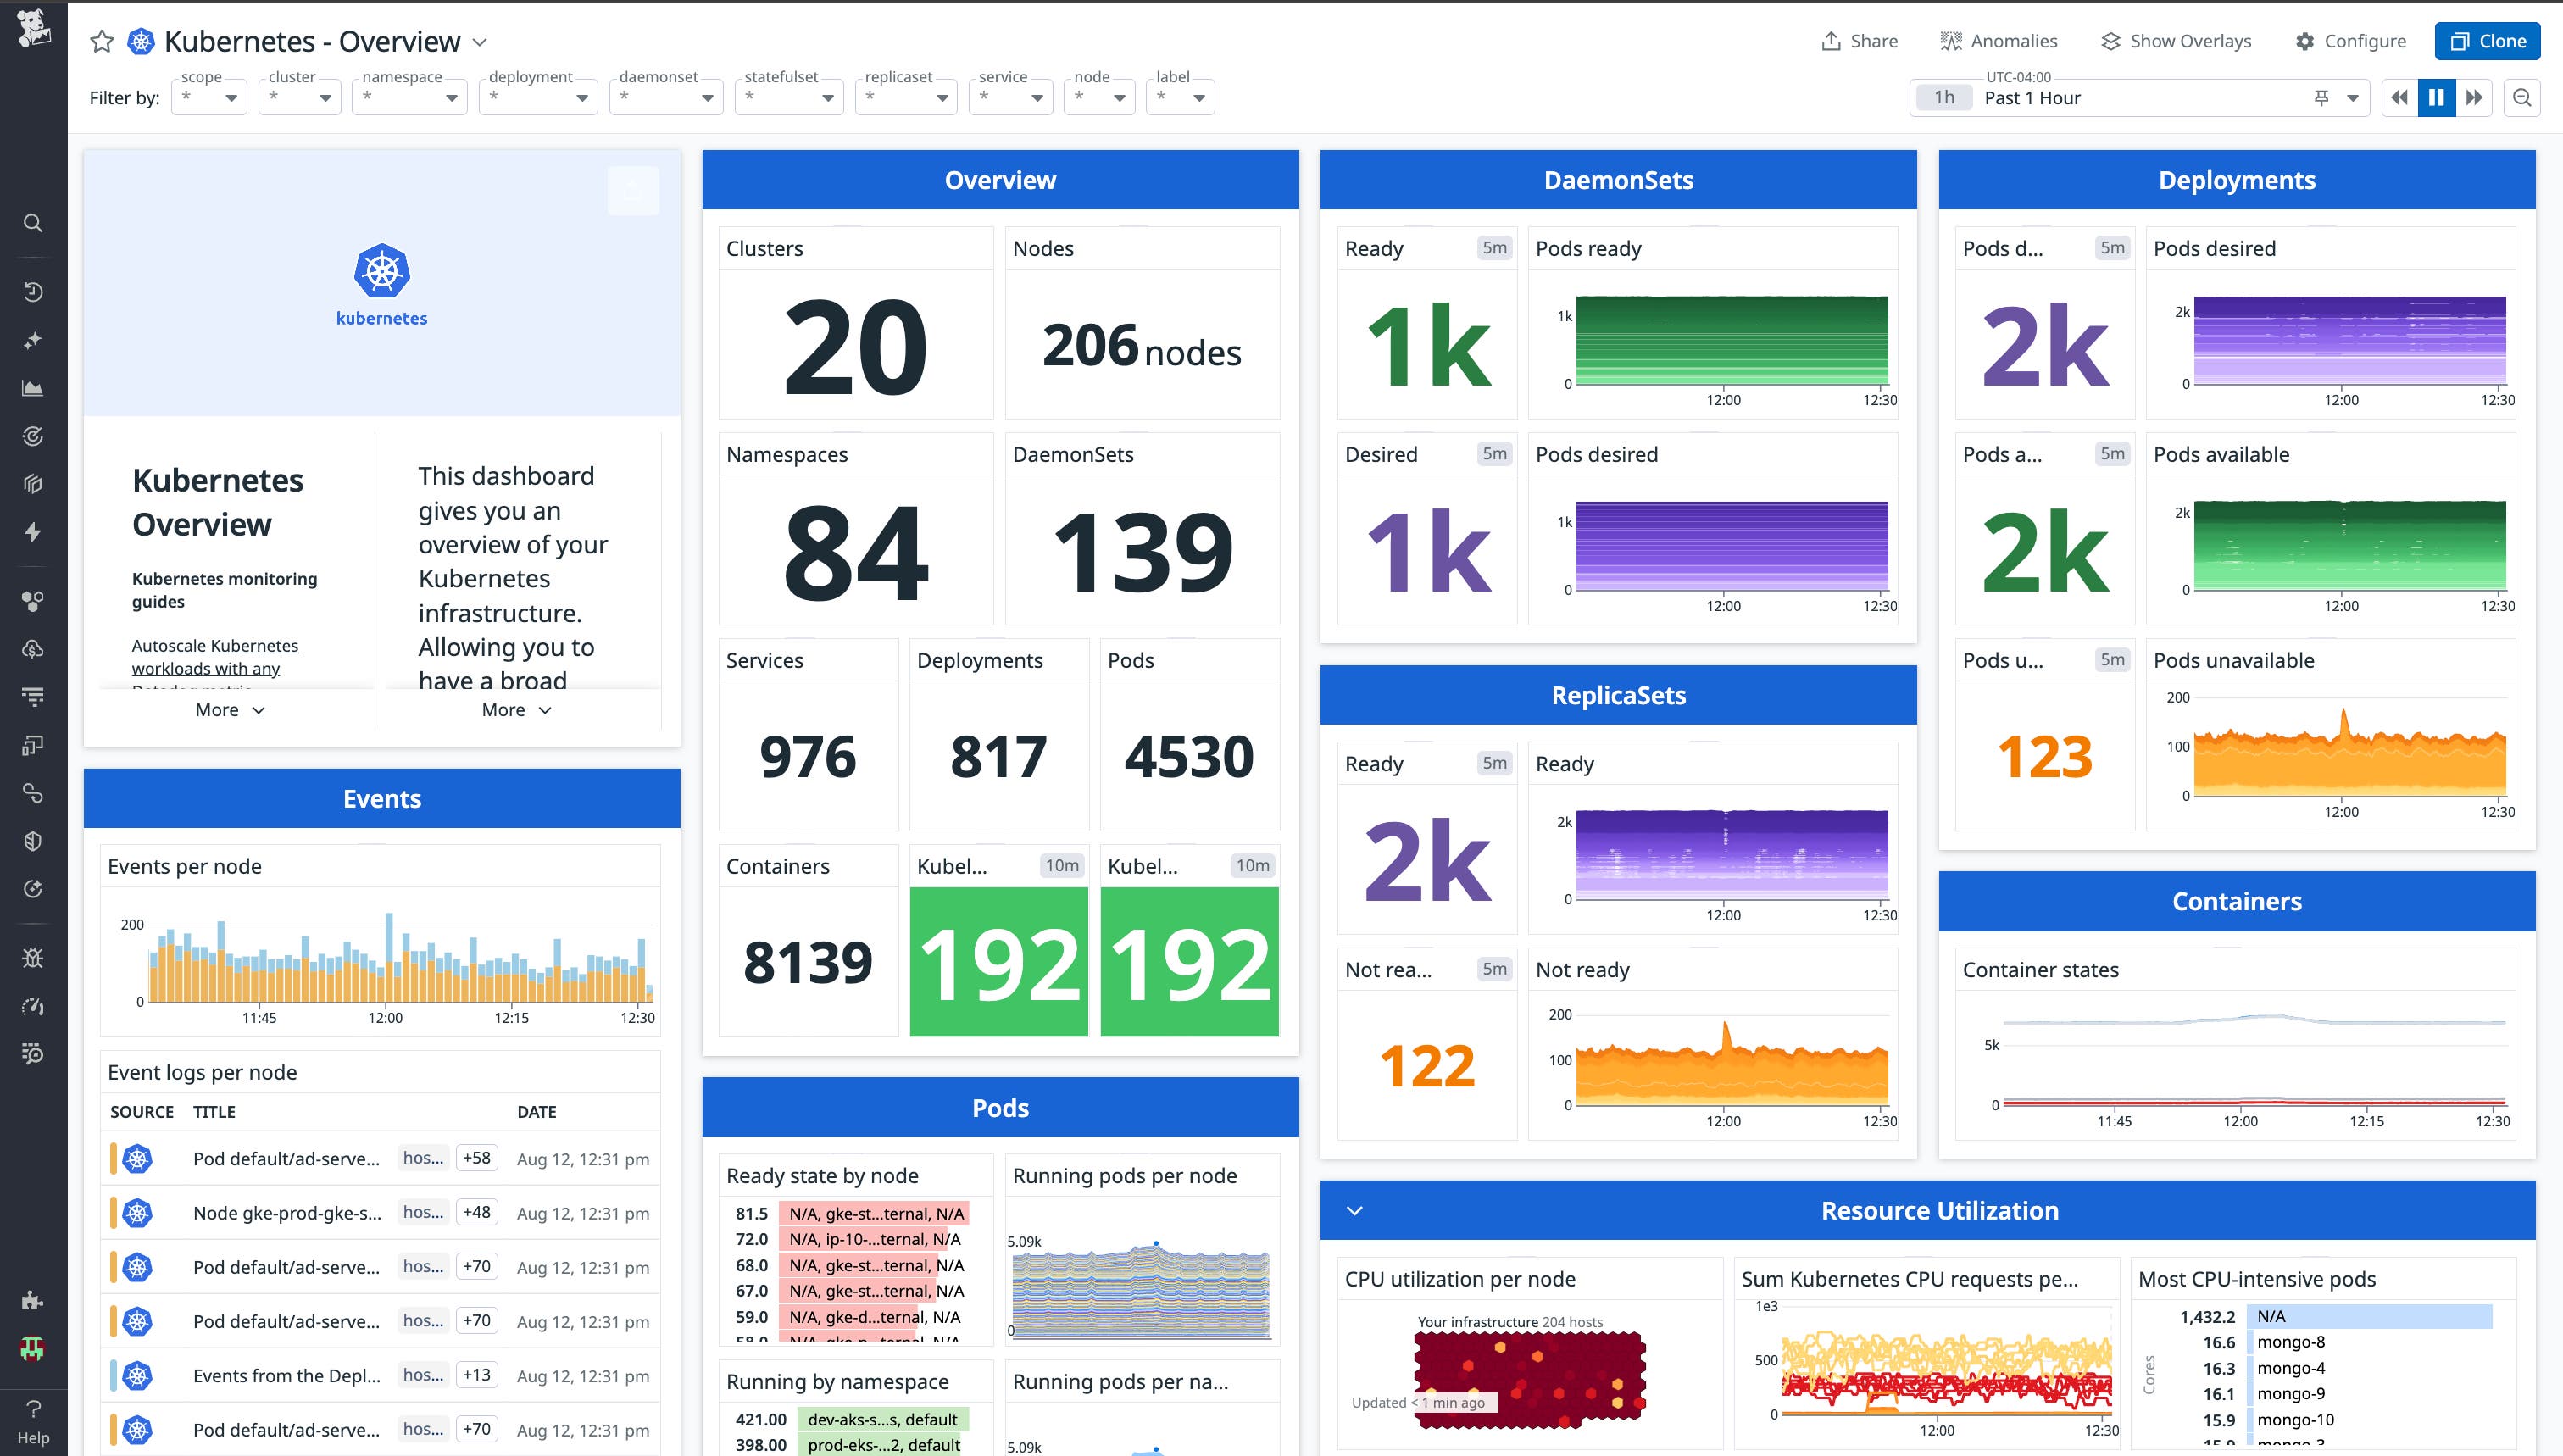
Establishing a clear naming convention is essential for consistent dashboard management, especially in complex environments. Without one, dashboards become challenging to search, group, or distinguish. An effective naming pattern, such as “Payments Service - Prod Env Overview,” which includes the service/domain and purpose, helps teams quickly find what they need and reduces the risk of duplication.
Supplementing naming conventions with tags like a “team” tag on dashboards (even if only in descriptions or titles) clarifies ownership and promotes accountability. These tags help keep track of what team owns different dashboards and whether they are up to date, which is especially important for relevant stakeholders during incidents or audits for platform teams. As organizations expand, these lightweight signals facilitate scalable ownership without requiring cumbersome processes. Similar to monitors, there’s also a Datadog Workflow for dashboards to prevent users outside of your team from editing your asset.
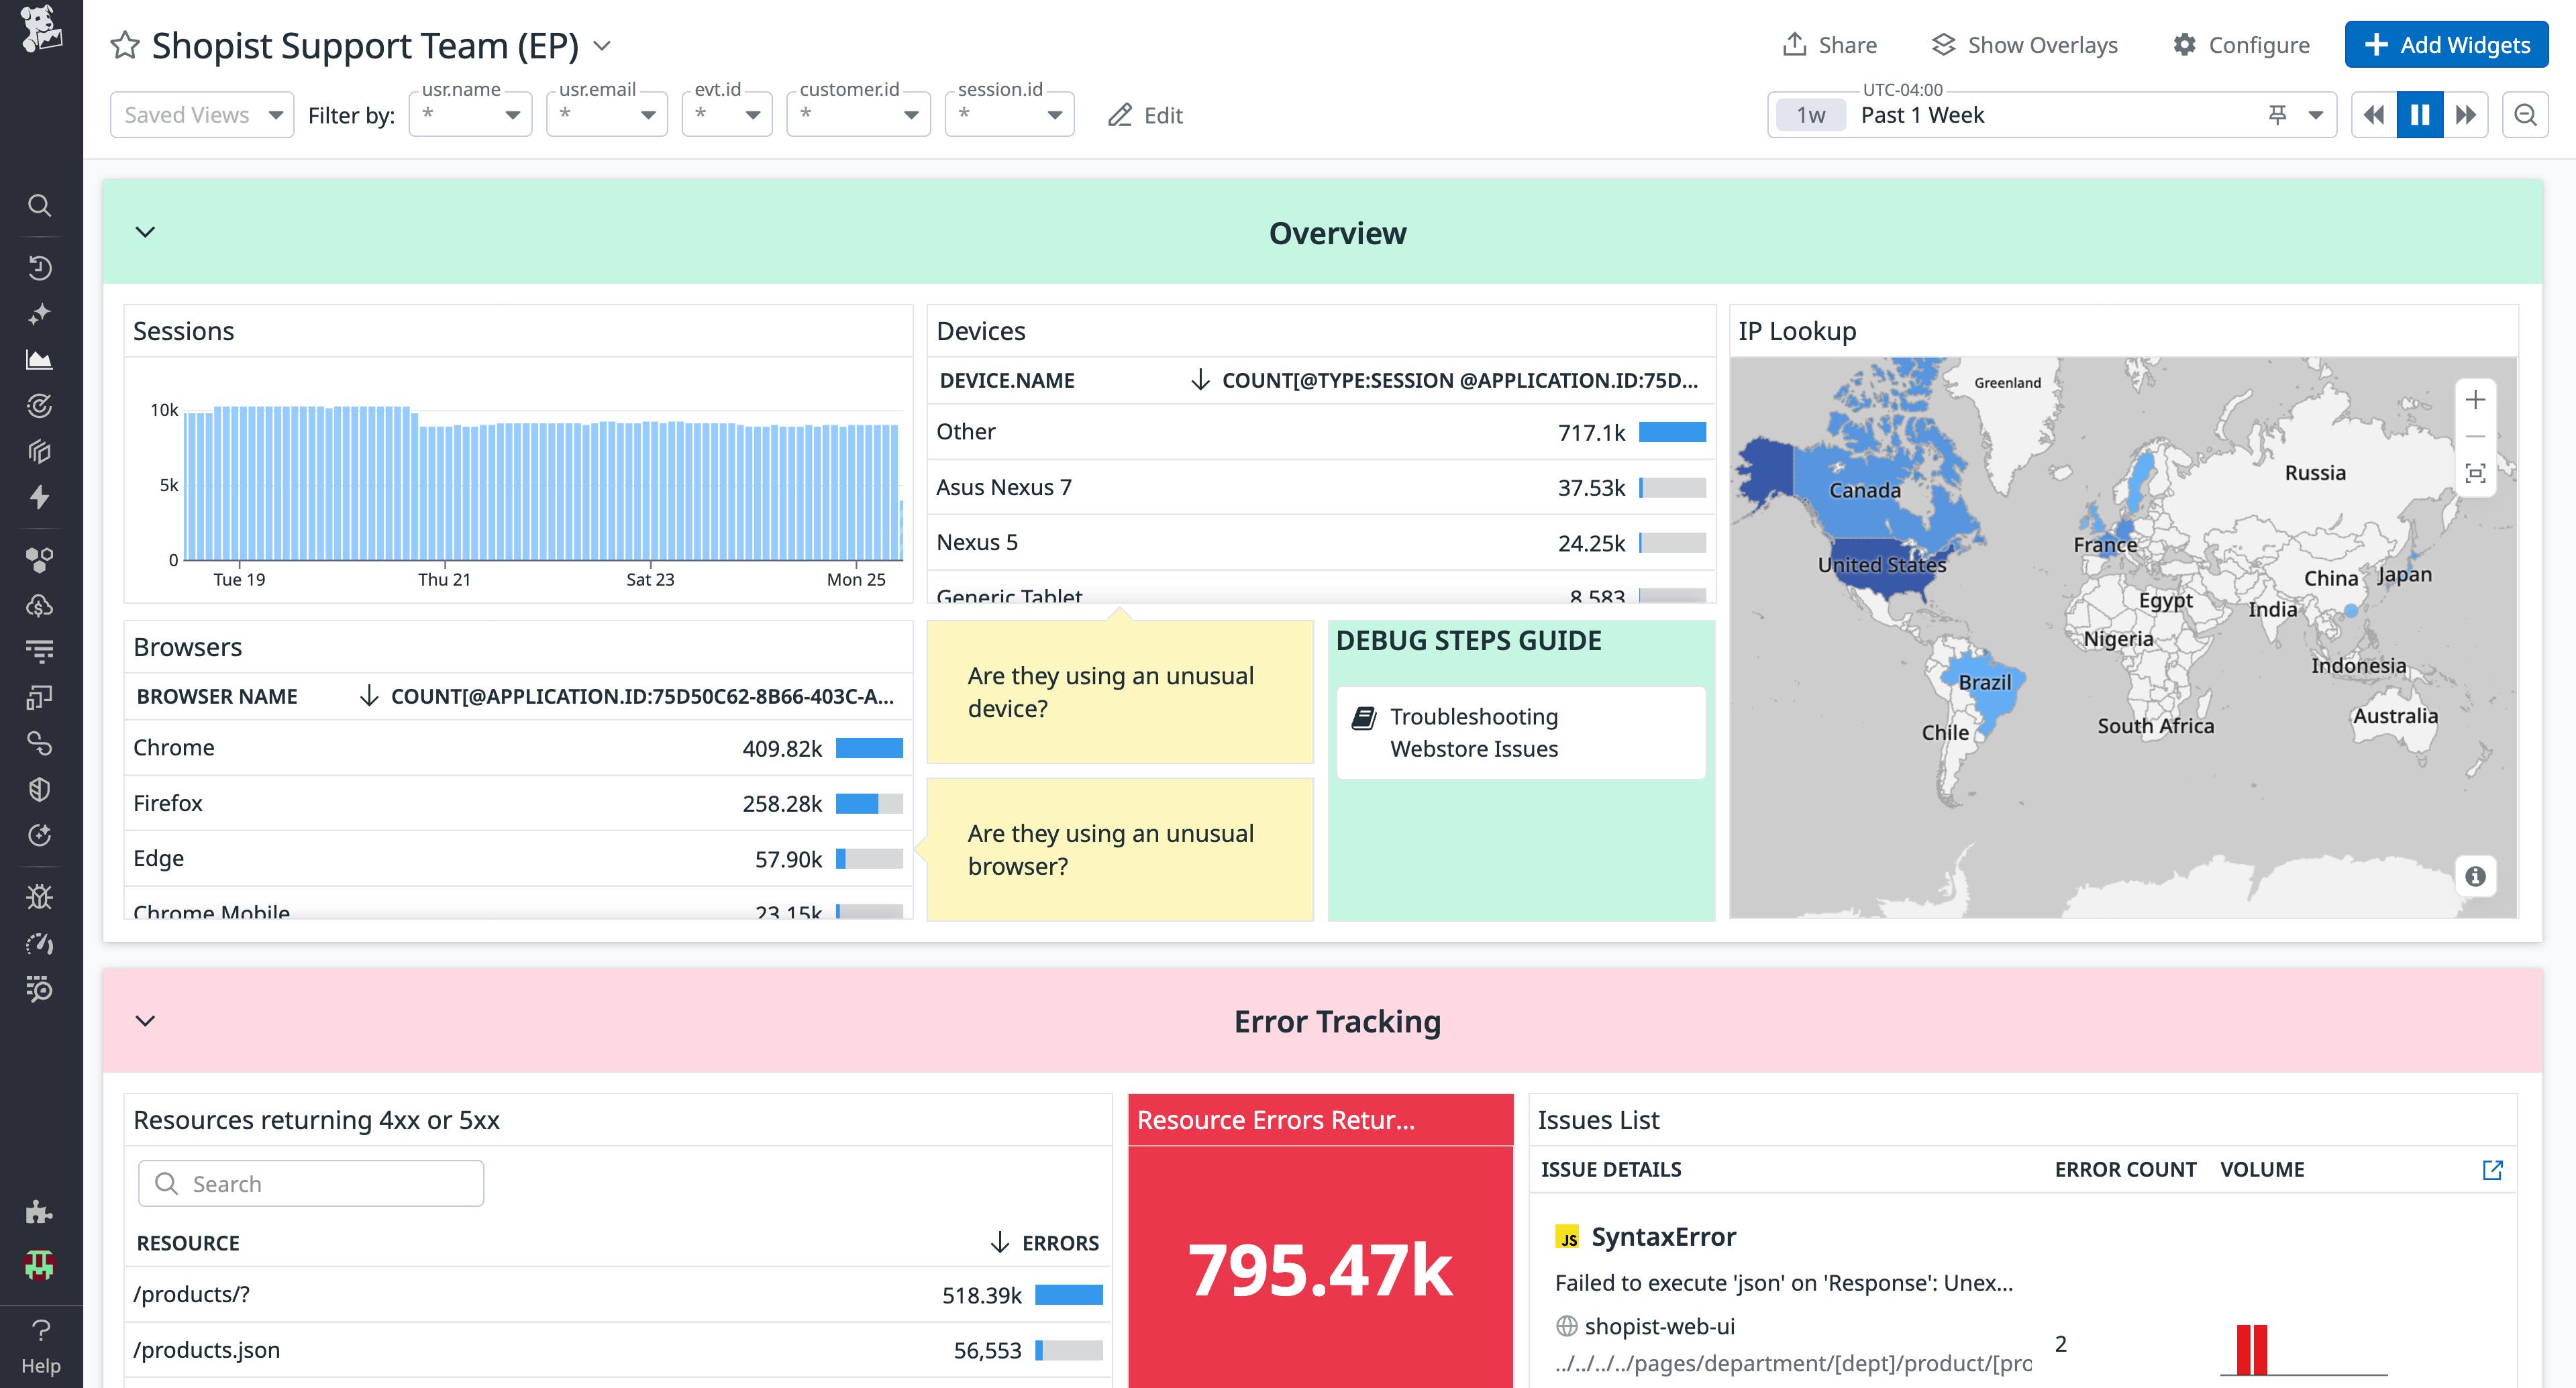
In Datadog, template variables allow you to create flexible dashboards that scale across services, environments, or teams without duplicating effort. Instead of building a new dashboard for every microservice, you can create one reusable view that adapts based on what a user selects. It’s a small shift that can significantly reduce clutter and help everyone speak the same language when troubleshooting.
For teams managing large or complex environments, adopting dashboards-as-code (via tools like Terraform) can take things even further. This enables version control, review workflows, and consistent rollout across environments, which is especially valuable when infrastructure is being managed the same way. Even without code, having a lightweight review process in place—monthly check-ins, usage audits, or dashboard ownership reviews—helps keep things accurate and relevant over time.
Dashboards are often the first place teams turn during incidents, handoffs, and planning sessions. When designed thoughtfully, they scale as your systems do and support growth without adding confusion.
Scale your monitors and dashboards with Datadog
The tools and habits that work at a smaller scale start to fall short as your organization grows. But with thoughtful design, lightweight governance, and the right tools, dashboards become shared sources of truth, monitors become trusted signals, and teams feel empowered to build systems that grow with them.
Getting there starts with small, intentional shifts: defining ownership, reviewing what you already have, creating reusable patterns, and building feedback loops that keep quality high over time. This leads to faster response times, fewer distractions, and more confidence in what your systems are telling you.
Check out our documentation for dashboards and monitors to get more tips on scaling with your organization. Or, sign up today for a 14-day free Datadog trial.
