Candace Shamieh

Daljeet Sandu

Nicolas Narbais
As your environment changes, new trends can quickly make your existing monitoring less accurate. At the same time, building alerts after every new incident can turn a straightforward strategy into a convoluted one. Treating monitoring as a one-time or reactive effort can both result in alert fatigue. Alert fatigue occurs when an excessive number of alerts are generated by monitoring systems or when alerts are irrelevant or unhelpful, leading to a diminished ability to see critical issues. Updating your alerts infrequently or too often can cause false positive alarms and redundant alerts that overwhelm your team. A desensitized team won’t be able to detect issues early and will lose trust in their monitoring systems, which can disrupt production and negatively impact your business.
To prevent and minimize alert fatigue, it is important to continuously review and update your monitoring strategy, specifically targeting unnecessary or unhelpful alerts. For larger organizations with thousands of alerts, implementation is best done at a team level to ensure alerts are catered to each team’s specific responsibilities. In this post, we will discuss how you can adopt a continuous improvement methodology and implement a practical workflow that helps you revisit and review your alerts. We’ll cover how you can:
- Identify noisy alerts that contribute to alert fatigue
- Take preventive action to minimize future opportunity for alert fatigue
- Reduce alert fatigue with Datadog
Identify noisy alerts
The first step in this workflow is to pinpoint your noisiest alerts, or the ones that trigger the most. Two common types of noisy alerts are:
- Predictable alerts
- Flappy alerts
Predictable alerts
As you review noisy alerts, it’s important to note that predictable alerts form consistent patterns. An alert should only be triggered when an unexpected event occurs. For example, if you review an alert’s regular patterns over the course of a week and you can predict that the next alert is going to occur on Friday between 5:00 p.m. and 6:00 p.m., then it should be marked as a predictable alert and adjusted accordingly. This ensures that you are only notified of unexpected events.
Flappy alerts
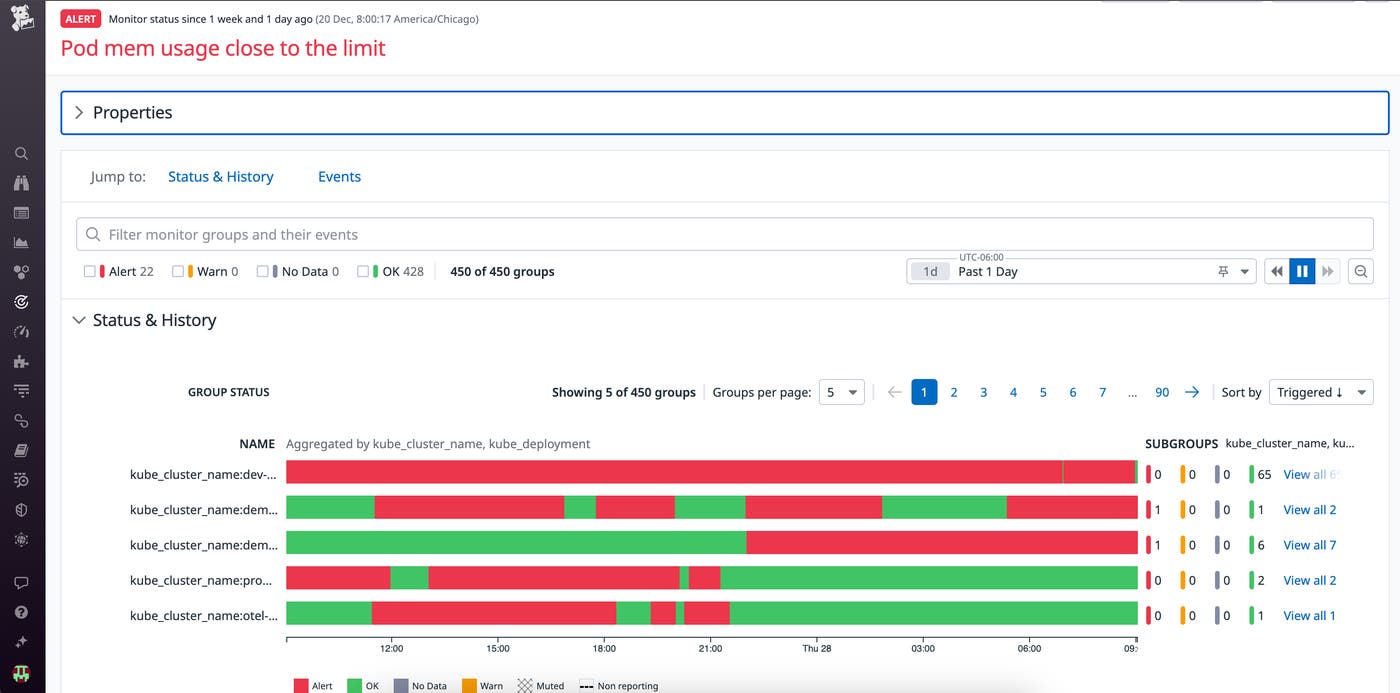
Flappy alerts are those that frequently switch back and forth between health statuses, like from OK to ALERT to OK. These alerts can quickly bombard you and your response teams if you’re being notified every time the state is changed. As an example, let’s say you have an alert that tracks disk space usage on a server and is set to trigger when disk usage exceeds 90 percent for more than five minutes. The alert detects a spike and triggers a notification. Your team acknowledges the alert was triggered by an automated backup process, so they don’t take any immediate action. The alert updates its status to OK again once the backup is complete and the disk usage drops below 90 percent. A few hours later, the alert once again triggers and your team finds that there was a temporary spike in disk usage due to a one-time large file transfer, but it’s not a cause for concern and easily resolved by deleting unnecessary files. This frequent toggling between ALERT and OK states due to temporary spikes in disk usage can cause alert fatigue because it generates alerts that don’t indicate critical issues.
When you review potential flappy alerts, determine how long it takes for a health status to change and whether or not it auto-recovers. If you’re being alerted every time the status has changed for a short period of time—like five minutes—or if the issue auto-recovers anyway, then it needs to be addressed.
Take preventative action to minimize future opportunity for alert fatigue
Once you’ve identified your noisiest alerts, you can adjust them to reduce their alerting frequency and increase their overall value. Adjustments are best handled at a team level to allow each team to act independently. In this section, we will discuss the five primary tasks that achieve this. After implementing these changes, it’s important to revisit alert settings periodically when you review your monitoring needs, whether that be once a quarter, semiannually, or another time frame that best fits your team. These tasks are to:
- Increase your evaluation window
- Add recovery thresholds
- Consolidate alerts with notification grouping
- Leverage conditional variables
- Schedule downtimes
Increase your evaluation window
Setting an evaluation window for your alerts defines the frequency at which your monitoring tool evaluates the relevant data and compares it to your configured alert conditions. One common misconception is that increasing the evaluation window might lead to slower responses or missed alerts, but that isn’t the case. The alert continuously assesses the underlying data, so lengthening the evaluation window will ensure that the system considers more data points before deciding if an anomaly exists. In other words, you can increase the evaluation window so that you are only alerted if a behavior is happening consistently—not temporarily.
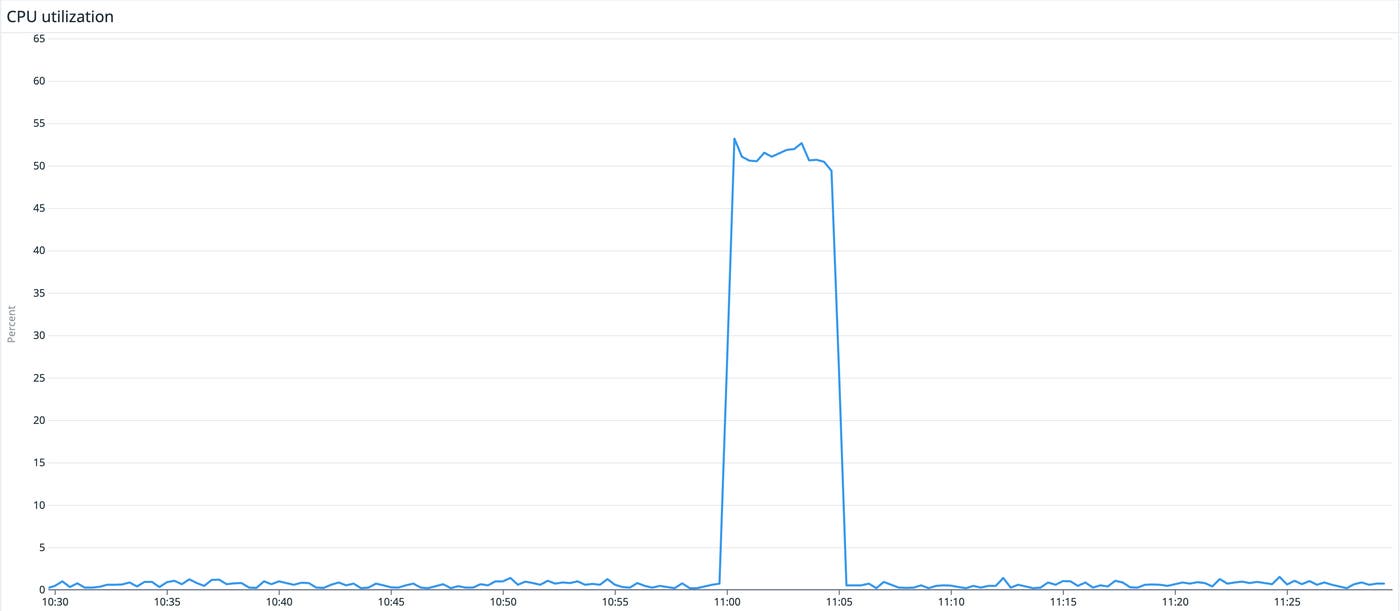
Setting a short evaluation window for alerts might seem like a proactive approach to catch anomalies quickly. However, this can increase the occurrence of false positives. For instance, consider a database that occasionally experiences brief surges in query times due to harmless background tasks. If the evaluation window is too short, even these spikes can trigger alerts, disrupting your team’s flow of work.
Add recovery thresholds to your flappy alerts
Recovery thresholds are optional thresholds that you can add to a flappy alert, particularly those that trigger multiple times in a row during a short period, like over the past 15 minutes. Recovery thresholds include additional conditions to help you verify that an issue is resolved so you don’t receive unnecessarily disruptive alerts. The recovery threshold is satisfied whenever the recovery condition is met.
For example, let’s say you’ve set up an alert that notifies you once a server’s CPU usage exceeds 80 percent and added a recovery threshold that triggers when CPU usage is below 70 percent. When one of your servers experiences a temporary spike in CPU usage that reaches 85 percent, it triggers an alert. You already have auto-scaling enabled, so your server’s workload quickly decreases and CPU usage falls below 70 percent. Your monitor detects the decrease and appropriately switches the alert from ALERT to OK without any manual intervention.
Consolidate alerts with notification grouping
With notification grouping, you can define how alerts should be grouped or choose to group them by a specific dimension, whether that be by service, cluster name, host, device, or something else entirely. If you choose to group alerts by multiple dimensions, then your alert will send you an individual notification for each entity that meets the alert threshold.
Alerts with multiple dimensions can quickly become overwhelming if you’re monitoring a large group of entities. For example, let’s say you’re monitoring for latency across a group of critical services, each running on multiple hosts. You set up one alert with two dimensions: host and service. With this setup, you can potentially receive a wave of notifications whenever a single host becomes unavailable, alerting you to the host’s state and the service’s state. By removing host from the alert dimensions, you’ll group notifications at the service level and reduce the number of alerts you receive. This notification grouping allows you to have granular queries that still look at service- and host-level information but reduces the noise to a minimum by alerting once when the service meets the threshold. This enables you to investigate without being flooded with redundant alerts.
Leverage conditional variables
You can create conditional variables for your alerts that will modify their message or recipients based on defined criteria. Because conditional variables use advanced logic, you can utilize them to route notifications to specific teams. For example, you can ensure that any issue that arises in cluster_1 only notifies team_1, cluster_2 notifies team_2, and so on.
You can also increase an alert’s relevance by adding notification messages to your conditional variables. It can be frustrating to receive an alert and have to comb through a dozen or more conditional variables to figure out how to resolve a problem. Notification messages reduce alert fatigue because you and your team know that when you receive an alert, the message will provide you with information directly related to the problem. In the example below, we’ve configured the alert to look at the name of the cluster that emitted the alert. If it’s cluster_1, it displays a specific message, and notifies the development team that supports cluster_1.
{{#is_exact_match "cluster.name" "cluster_1"}} <This displays if the cluster that triggered the alert is exactly named cluster1.> <@dev-team-cluster1@company.com>{{/is_exact_match}}Schedule downtimes
If you and your team are planning any maintenance, upgrades, or system shutdowns, you can schedule downtimes so that all alerts and notifications are appropriately silenced.
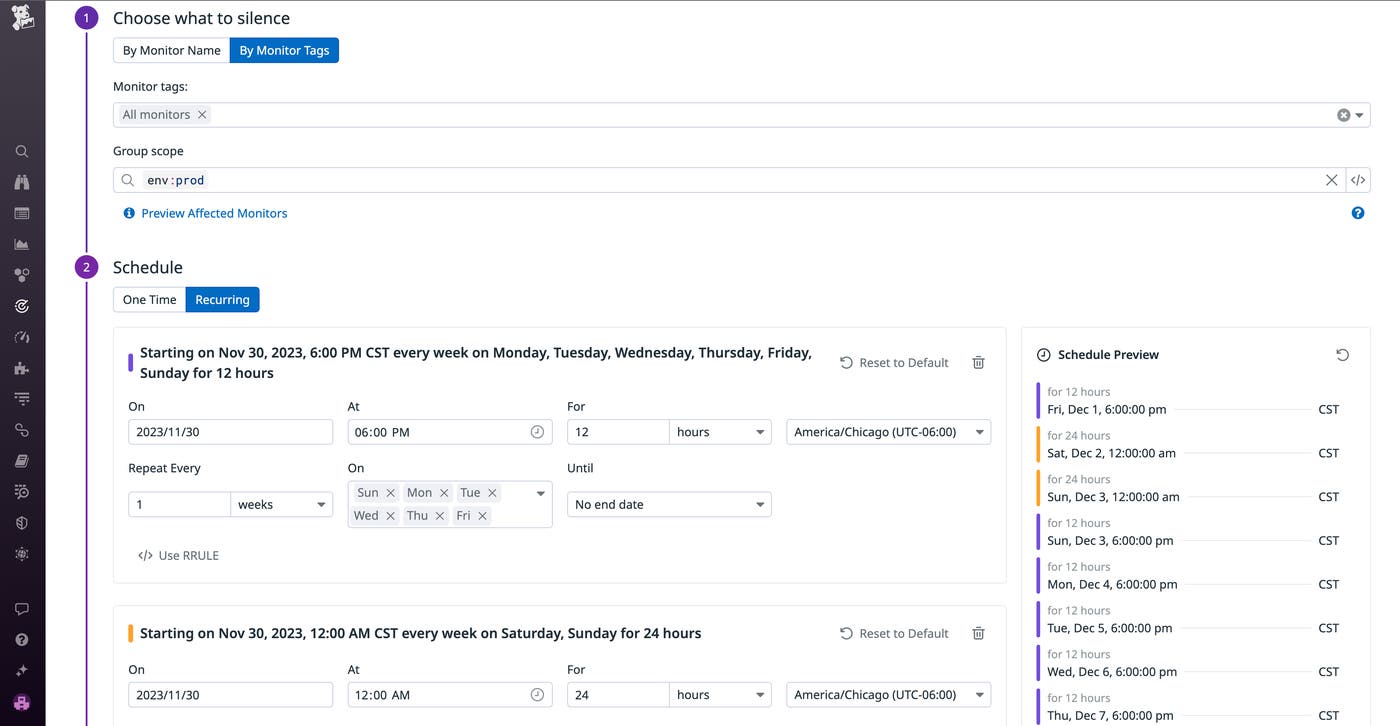
Downtimes work well for repetitive, predictable alerts because they are flexible—they don’t have to be all or nothing. You can schedule downtimes as one-time or recurring events and choose whether to silence all alerts or specific alerts.
Reduce alert fatigue with Datadog
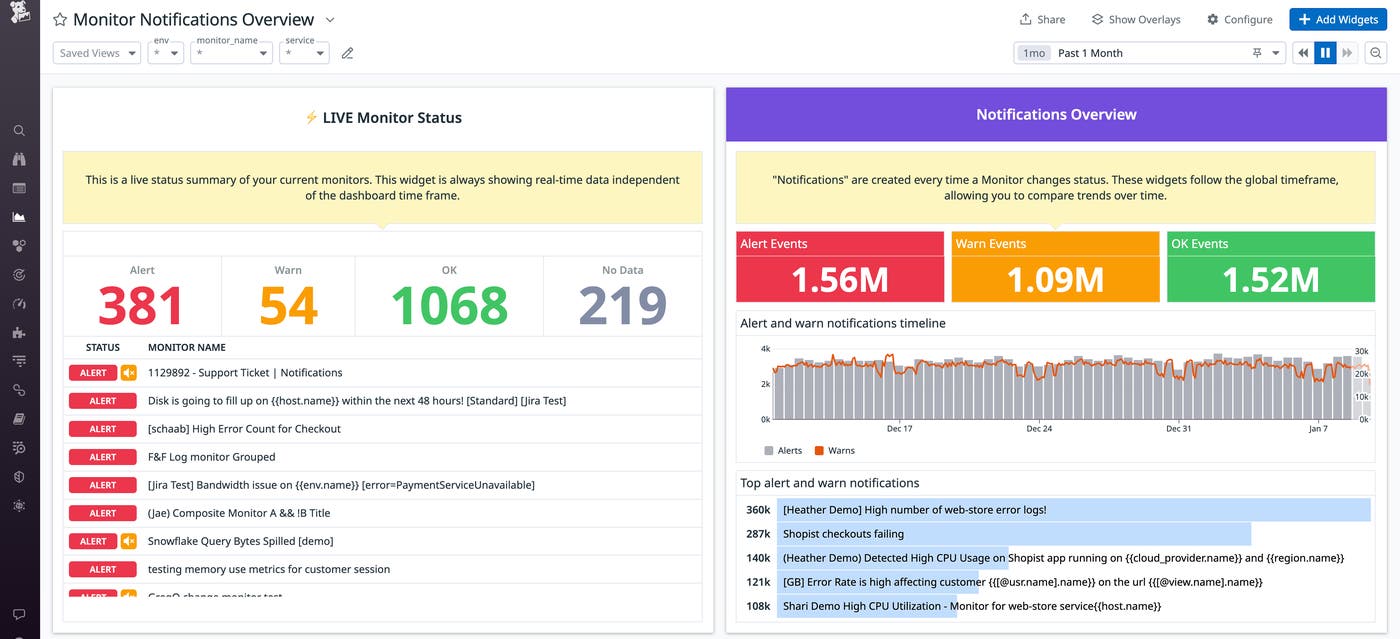
Datadog’s out-of-the-box Monitor Notifications Overview dashboard displays your noisiest alerts and provides a breakdown of alert trends, enabling you to compare your current trends with historical data. The Monitor Notifications Overview dashboard also shows a live summary of your current alerts. If preferred, you can create custom dashboards to focus on what is most helpful to you, like a specialized dashboard that showcases all alerts that notify via PagerDuty. Our integrations with services like Jira, ServiceNow, and Slack, as well as tools like Datadog Case Management, will help you communicate efficiently as you track, triage, and troubleshoot issues.
Datadog provides extensive options for alert conditions so you can precisely craft combination alerts—which we call composite monitors—that can be tailored to your specific use cases and data sources, reducing the probability of alert fatigue. For example, you can set an alert that only triggers when the error rate for your web application is above 3 percent and there have been more than 100 hits on the backend in the past 30 minutes. A composite monitor will not alert your team if the error rate slightly rises above 3 percent due to a sudden surge in user activity, as long as the backend load stays below 100. Our anomaly monitors also offer features like automatic thresholding and adaptive alerting.
With Datadog, it’s easy to update your evaluation windows and frequencies. For example, if your evaluation window is less than 24 hours, the evaluation frequency of your alert will remain at once per minute. This allows you to extend your evaluation window freely without the risk of receiving delayed alerts. Use this information to determine how frequently your data needs to be evaluated. With Datadog, if the evaluation window is set to over 24 hours, the data will be checked every 10 minutes—or every 30 minutes if the window is set over 48 hours.
You can use template variables to make your notifications more informative and add custom messages to your conditional variables to make it easier for your team to pinpoint the root cause of issues. Assigning tags to your alerts can simplify notification grouping and are especially useful when you’re dealing with multiple teams or large organizations because you can filter, aggregate, and compare your telemetry in Datadog. If you set up our recovery thresholds for flappy alerts from both WARN and ALERT states, you’ll increase confidence that the alerting metric has successfully recovered and that the issue is resolved without the need for human intervention.
Datadog can also proactively mute alerts on your behalf. Specifically, if you shut down any of your resources, Datadog automatically mutes any alerts related to them so that you won’t receive any unnecessary notifications. For example, Datadog will auto-mute alerts related to your Azure VMs, Amazon EC2 instances, or Google Compute Engine (GCE) instances when their respective autoscaling services terminate the resources. Furthermore, Datadog enables you to choose what alerts you want to mute at any time, create a one-time or recurring downtime schedule, and notify your team of upcoming downtimes and status changes.
Solve your alert fatigue
In this post, we’ve defined alert fatigue, explained why it’s a problem, and confirmed that the cause is often a monitoring strategy that requires a more defined continuous improvement methodology. Reviewing your alerts regularly can reduce alert fatigue and prevent it from recurring in the future. We’ve also walked through how to find your noisiest alerts, the steps you can take to address them, and how you can use Datadog to prevent alert fatigue.
If you’re new to Datadog and want us to be a part of your monitoring strategy, you can get started now with a free trial.

