Jonathan Epstein
Cloudflare is a content delivery network (CDN) that organizations across industries use to secure the reliability of their websites, applications, and APIs. With a wide array of security, networking, and performance-management tools, millions of web applications employ Cloudflare's DDoS protection, load balancing, and serverless compute-monitoring features to maintain high performance and uptime.
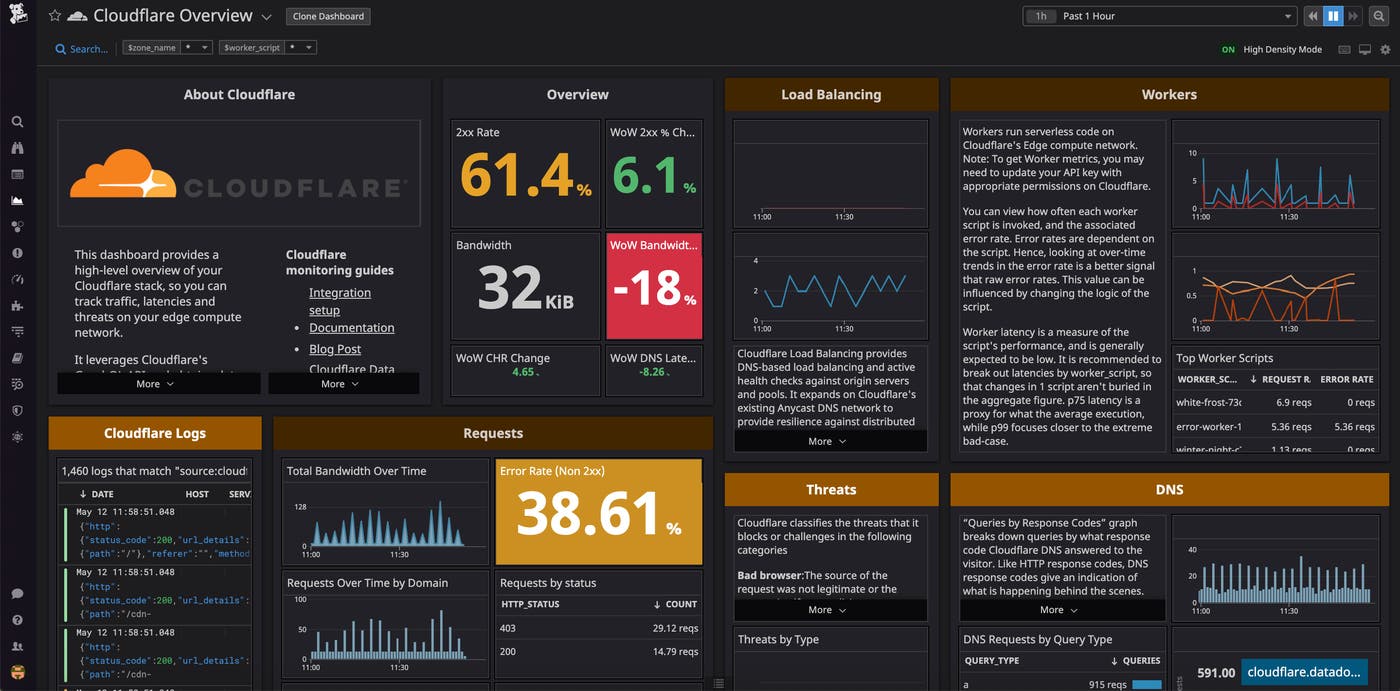
Datadog's Cloudflare integration already collects key metrics that give you deep insight into your Cloudflare DNS, security and CDN performance. Now, Datadog can ingest HTTP request logs and events directly through Cloudflare's Logpush service and collect additional metric datasets that let you monitor the health and performance of your Cloudflare Workers and load balancing utilities. This gives you more insight into your content delivery infrastructure so your teams can respond to issues more quickly and reduce service downtime for your customers. Once you've enabled the integration and data is flowing into Datadog, you can use our new out-of-the-box Cloudflare dashboard to monitor key Cloudflare metrics and logs from a single pane of glass.

Analyze the full scope of your Cloudflare logs
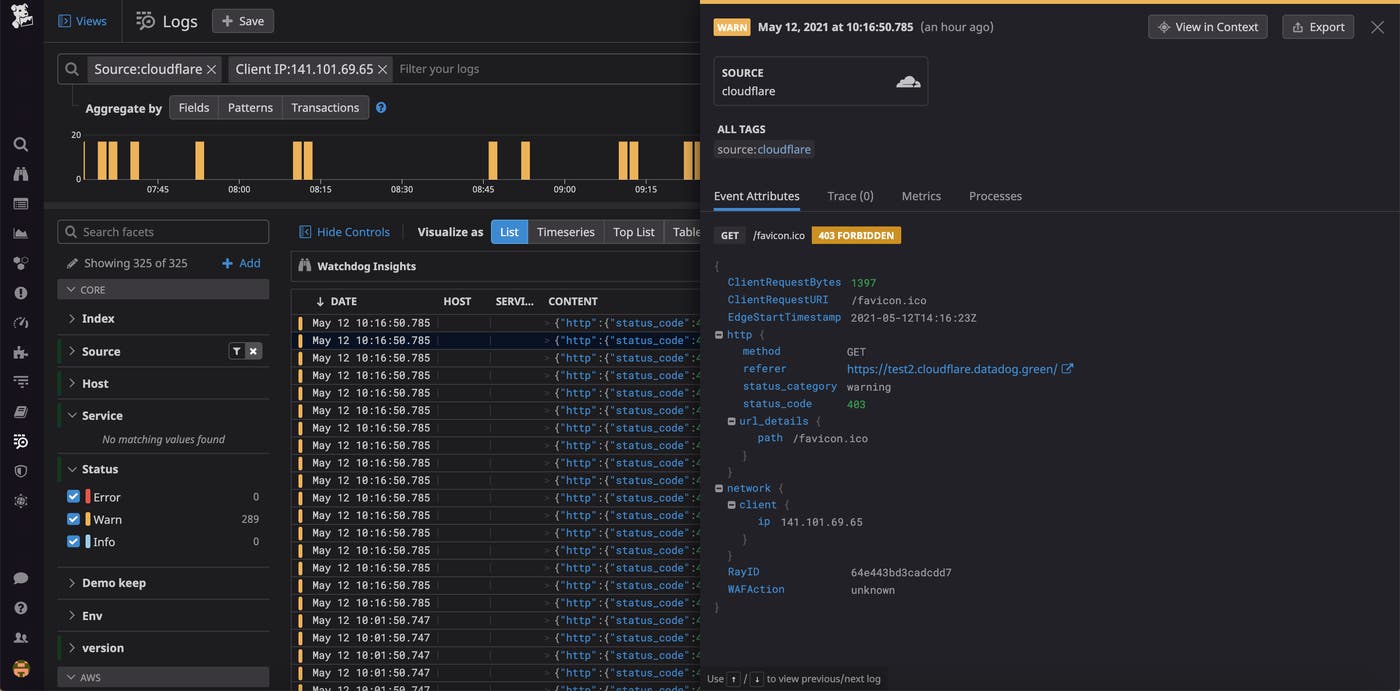
Datadog can ingest the full volume of logs emitted by your Cloudflare assets in real time, giving you full visibility into the actions and events occurring across your CDN. After enabling the integration you can create a Logpush job on Cloudflare to begin forwarding your Cloudflare logs, including HTTP request logs, Spectrum events, and Firewall events. Datadog automatically enriches your logs and parses out key metadata from them, such as the source of requests, IP addresses, and response status codes. You can use Datadog to analyze and correlate this data with metrics, traces, logs, and other telemetry from more than 1,000 other services and technologies.
If you don’t want to ingest Cloudflare logs, you can still collect the most pertinent information from them by using Datadog Observability Pipelines. Observability Pipelines will extract metrics from your Cloudflare logs before they leave your environment, enabling you to ship logs to your preferred destination, drop them, or retain them in a cost-effective, long-term storage solution, like Flex Logs.
Troubleshoot user problems faster with logs
While Cloudflare metrics provide a big-picture perspective and alert you to issues with the performance of your CDN infrastructure, Cloudflare logs contain key information about any incoming request to your application. This gives you more context around problems and helps speed up your investigation and response. For example, if you receive a user ticket about your website running slow, you can easily filter your Cloudflare logs in the Log Explorer by that user's IP address to isolate their specific queries and get additional information, such as their user ID in your application. By filtering your application logs with this user ID, you can then examine all the up- and downstream requests for this user. You may end up identifying that this user belongs to a beta-tester group that leverages a new microservice, which is bottlenecking all of their requests.

Expand your monitoring reach with new Cloudflare metrics
In addition to DNS and Request metrics, Datadog now collects metrics related to your Cloudflare Workers and load balancers, giving you deeper visibility into the performance of your Cloudflare-powered applications.
Keep your Workers working
Cloudflare Workers is Cloudflare's serverless computing service that allows you to deploy and automatically scale applications within Cloudflare's network. This enables you to serve complex content right where your users are without needing to provision your own local infrastructure.
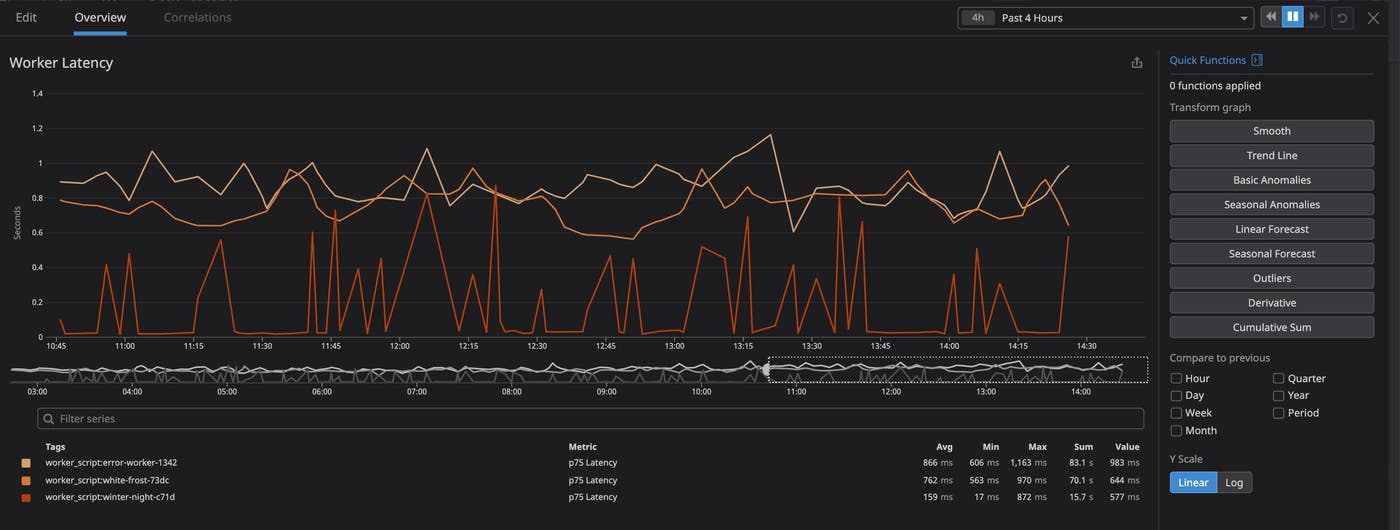
Datadog collects key Workers metrics, such as request count, errors, and response time, and automatically tags them with the relevant script. This makes it easy to identify specific scripts that are experiencing performance issues. For example, you might receive a notification that a Worker script that renames files (from machine-generated to human-readable names) when a user downloads them is experiencing high p75 latency (cloudflare.workers.response_time.75p). The increase could be related to either a new code change to the script, or from increased traffic. By correlating the worker latency with HTTP request metrics, you can track the issue and determine whether increased traffic is the culprit. If not, you can then inspect the relevant logs to see whether the spike is due to a new code push that you should roll back.

Maintain balance
Load balancing is critical to ensuring your application servers split user traffic as planned. For example, if you are preparing for an upcoming maintenance window for a subset of servers, you need to ensure that all connections to these servers are drained and requests are properly redirected before the servers can be taken offline.
Datadog collects key metrics and tags related to your Cloudflare load balancers so that you can monitor changes in traffic flows across your load balancer. Visualizing load balancer request counts (load_balancer.pool.health.status) for each application pool helps you ensure that Cloudflare is correctly shifting load from one application pool to another. You can also monitor request count by the status of their HTTP response (cloudflare.requests.status) to check that error rates remain steady.
Additionally, monitoring the round-trip time for your load balancers (load_balancer.pool.round_trip_time.average) provides visibility into server-side latency, which helps you determine if a deployment is going smoothly. If you use a CI/CD workflow for your application, you can ensure that new deployments are slowly introduced into your production environment. For instance, you might only apply your new deployment to a small load balancer pool that receives 5 percent of all incoming traffic. This lets the new deployment propagate for a period, during which you can monitor the pool-specific round-trip time and error rates and safely test your changes in a production environment without impacting all of your customer traffic.
Start monitoring your Cloudflare CDN today
Datadog's Cloudflare integration provides you with more visibility than ever before into your CDN's activity and gives you more ways to detect and secure your infrastructure against threats and operational failures. And with DNS monitoring and Real User Monitoring, Datadog can help you ensure that users are always able to access your applications. If you're already a Datadog customer, you can start exploring the new Cloudflare metrics and logs now. And if you're not, get started today with a 14-day free trial.

