Fastly is an edge cloud platform that includes a content delivery network (CDN), as well as services for image optimization, video streaming, cloud security, and load balancing. These services are supported by a network of caches in different locations, which enables enterprise-scale companies to deliver applications to users as quickly as possible, even in times of peak traffic. Datadog’s Fastly integration allows you to visualize, analyze, and alert on Fastly metrics and logs—and view them in context with monitoring data from across your stack—so you can resolve issues before they degrade the user experience.
Monitor Fastly metrics in context
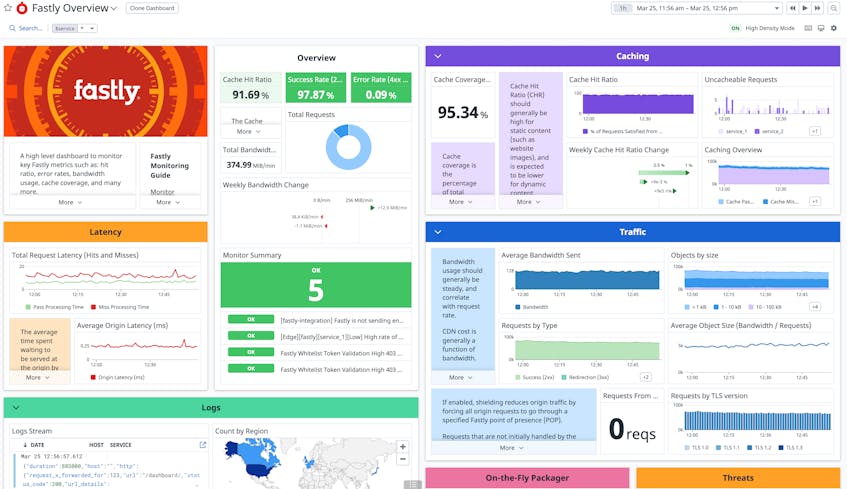
Datadog’s Fastly integration allows you to monitor key Fastly metrics, such as hit ratios, cache coverage, header size, error percentage, and HTTP client and server errors. These metrics can provide crucial insight into the health of your application and enable you to fine-tune your cache control settings to better protect your origin and reduce client latency. All Fastly metrics are auto-tagged by service and displayed on an out-of-the-box dashboard, so you can view metrics in aggregate or slice and dice them across your Fastly services.
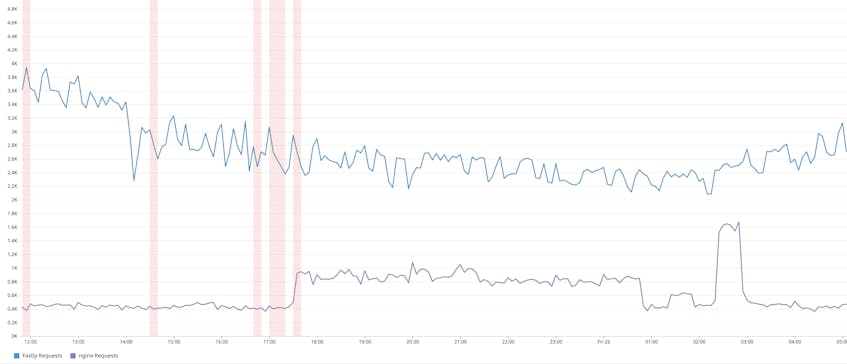
You can customize the graphs on your Fastly dashboard by adding other metrics and events you’re collecting in Datadog, which will be scoped to the same time period. This enables you to correlate Fastly performance trends with monitoring data from more than 400 other technologies, including NGINX, without having to switch contexts.
In the timeseries graph below, we’re comparing the number of requests to NGINX with the number of requests to Fastly. We’ve also included event overlays for code deployments. Ideally, traffic to Fastly and NGINX should rise and fall in tandem, with Fastly handling the vast majority of requests. As we can see, however, several code deployments occurred immediately before a period in which NGINX traffic increased while Fastly traffic fell. We can investigate the root cause of this anomalous activity with the help of logs and Deployment Tracking.
Pivot easily between Fastly metrics and related logs
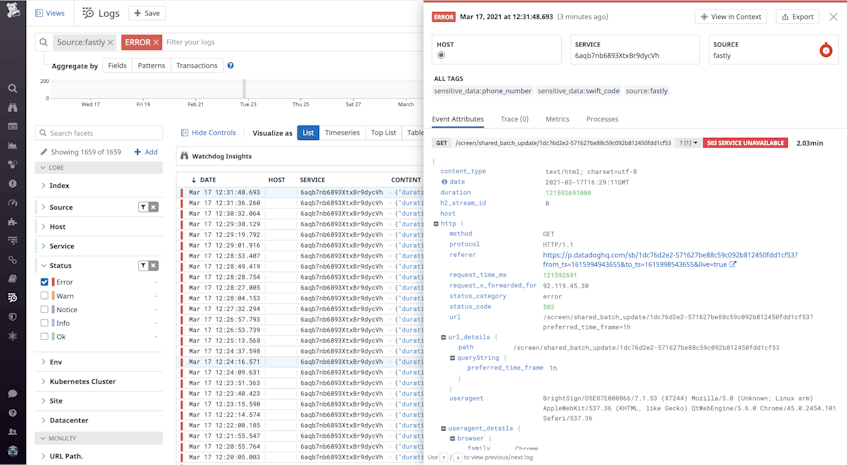
Metrics are great for high-level monitoring, but logs provide additional context that can be essential during investigations. Datadog enables you to pivot seamlessly between Fastly metrics and related logs, so you can better understand concerning activity. For example, if you see your error rate spiking, you can follow that metric to the Log Explorer in order to see the error status codes, as well as the request and response payload. For example, the log in the screenshot below indicates that the error is of type “503 Service Unavailable.” We can dig deeper into the log contents to see the specific request being made, as well as the destination URL, which can help speed up troubleshooting and resolution times.
What’s more, with Flex Logs—which enables cost-effective long-term analysis and on-demand querying of high-cardinality datasets—Datadog provides a storage solution excellently suited to CDN logs, since they are typically high in volume and queried mainly on an ad hoc basis.
Create, triage, and respond to Fastly alerts
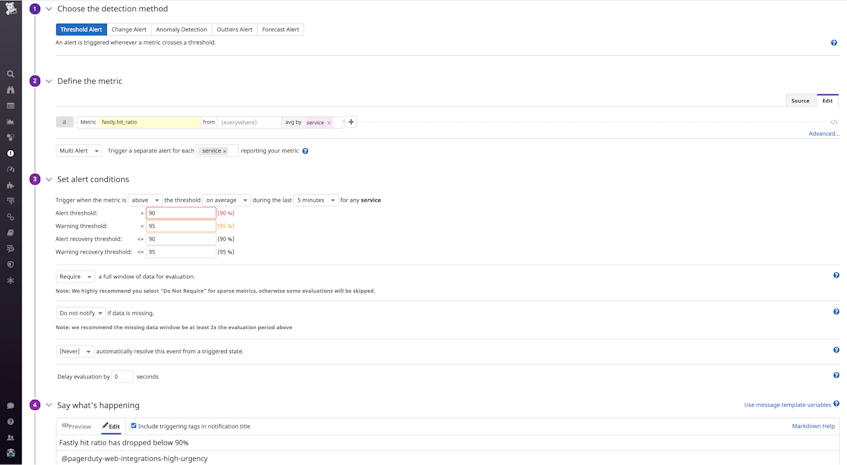
Datadog’s tag-based alerting system enables you to create sophisticated monitors for your Fastly services, which can notify you when a specific metric passes a user-defined threshold or behaves anomalously. For example, you can create a monitor that will trigger when the hit ratio for one of your Fastly services drops below 90%, and configure it to notify the appropriate team members in communication tools such as Slack and PagerDuty. And with Datadog Incident Management, which includes features such as the Datadog Slack App, the Datadog Mobile App, and collaborative notebooks, your team will be able to collaborate swiftly and efficiently while triaging alerts, investigating the root cause, and documenting the resolution process.
Start monitoring Fastly performance today
Datadog’s Fastly integration gives you full visibility into the health and performance of your Fastly services, so you can isolate bottlenecks, streamline your troubleshooting process, and reduce your MTTR. And because Datadog integrates with more than 400 other technologies, including NGINX, you’ll be able to see your Fastly metrics and logs alongside monitoring data from across your stack.
For more information on our Fastly integration, check out our documentation. And if you’re new to Datadog, you can get started with a 14-day free trial.


