Yair Cohen

David M. Lentz
At Datadog, we rely heavily on Kubernetes, and we're facing some interesting challenges as we use Kubernetes to scale further and strive for greater efficiency. To address these challenges, we've been working on solutions to help us better control how our clusters scale, and to make it easier to deploy and manage the Datadog Agent. Today, we're open sourcing these solutions to share them with the rest of the Kubernetes community. We're also pleased to announce two new generally available features for monitoring Kubernetes in Datadog. Now you can:
use tags to analyze distributed traces across your clusters
view OpenMetrics data from Kubernetes as distribution metrics in Datadog
We're continuously enhancing our features to ensure that we—and the rest of our users—can address the challenges of running Kubernetes in production. In this post, we'll walk through these new features and talk about the open source projects we're developing.
Distributed tracing across Kubernetes clusters
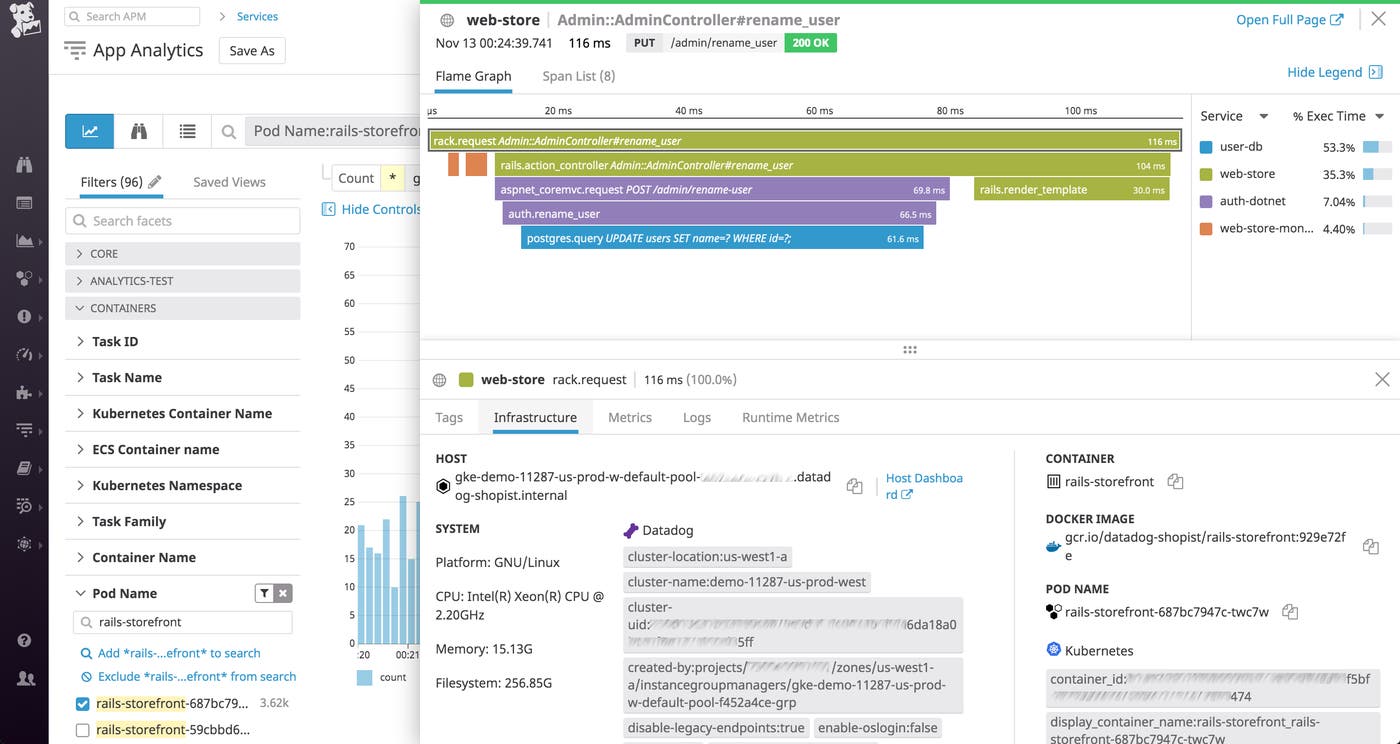
Datadog's support for distributed tracing with APM for Kubernetes gives you deep visibility into requests as they traverse your clusters, so you can quickly determine the source of any errors and bottlenecks in your containerized workloads. Datadog Distributed Tracing allows you to query your traces live and retain them for future analysis—or choose not to store them—based on your business priorities. And now each trace is automatically tagged with container metadata—from the individual container all the way up to the deployment and namespace level.
In the App Analytics view, you can filter your traces by any combination of facets (e.g., pod name, as shown below), and drill down to find the requests served by a single container or deployment. You can also click a request to view its flame graph, which shows you the life span of the request and the timing of each service that acted on it.

You can easily create alerts, for example to notify you if the average duration of requests served by a particular deployment rises above a threshold you define. You can configure alerts to send notifications to Slack, PagerDuty, or any other collaboration tool, so your team can quickly start investigating the cause of the latency.
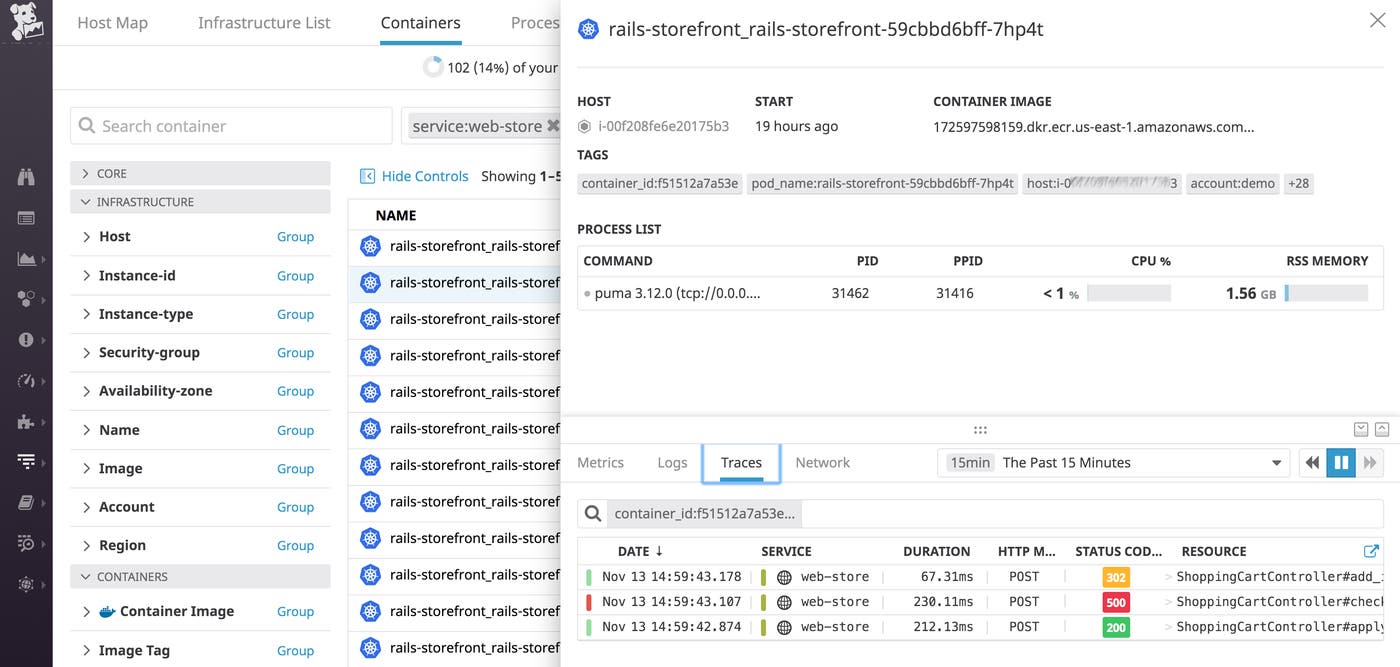
You can also see your traces directly from the Live Container view. Click the name of any container to view the traces it has executed, and click on a single trace to view its flame graph.

Distribution metrics
Distribution metrics aggregate monitoring data from multiple sources—e.g., your containers and pods—and calculate global percentile values that illustrate the performance of your services as a whole, allowing you to get a deeper understanding of user experience. You can visualize and alert on distribution metrics, and use them to track your performance against the service level objectives (SLOs) that are important to your business.
The OpenMetrics data format is used natively by many cloud technologies, including Kubernetes. Datadog includes support for the Prometheus exposition format and OpenMetrics. Now we also support converting OpenMetrics histogram data into distribution metrics, so you can easily monitor Kubernetes metrics as percentiles in Datadog. You can use distribution metrics to quickly understand your services' performance against your team's SLOs. For example, if you have an SLO that requires 95 percent of your requests to be served in under 200 ms, you can create a distribution metric based on http_response_time_seconds and create an alert to notify you when the p95 value is approaching that threshold.

Datadog's distribution metrics are based on our recently published DDSketch algorithm. DDSketch defines a mergeable quantile sketch with relative-error guarantees, which provides an efficient way to aggregate OpenMetrics histograms and convert them to distribution metrics.
Giving back to the Kubernetes community
Kubernetes is a key part of our infrastructure today, and we're committed to giving back to the Kubernetes community. We've initiated two open source projects this year that have helped us operate our infrastructure at scale, and we're pleased to share them with the Kubernetes community, and to get your feedback as we continue to enhance these solutions. Our Watermark Pod Autoscaler (WPA) project—currently in beta—aims to extend the capabilities of the Horizontal Pod Autoscaler. ExtendedDaemonSet (EDS) is in alpha, and it extends the Kubernetes DaemonSet to improve the deployment process with features for canary releases and rolling updates.
And to make it easier for our teams—and our users—to get visibility into Kubernetes clusters, we're also developing (and open sourcing) the Datadog Operator, which is designed to help simplify the process of deploying and managing the Datadog Agent at scale.
Autoscale clusters with Watermark Pod Autoscaler
Kubernetes' Horizontal Pod Autoscaler has been a key feature in allowing us to scale the Datadog platform to keep up with our growing user base, and along the way we've added improvements to make it even easier to operate containerized applications at scale. We're pleased to announce the Watermark Pod Autoscaler, an open source project that extends the features of the HPA to give you more control over autoscaling your clusters.
The HPA can scale your infrastructure up and back down again based on a metric threshold you set, such as the average CPU utilization across all the pods in your cluster. But when the HPA scales up or down, it can cause a significant change in the value of that metric, and create a cycle of ongoing scaling events. For example, if you've defined your scaling threshold as 40 percent average CPU utilization across all pods, and your workload generates 45 percent utilization across your initial two pods, the HPA will add pods, causing the average utilization to drop to 30 percent (or even lower if multiple pods are added). This lower utilization value will soon cause the HPA to remove pods, and your cluster will flap between too few pods and too many.
The WPA extends the HPA's algorithm by allowing you to define a range of acceptable metric values (an upper and lower bound), rather than the single threshold that the HPA uses to trigger scaling actions. For example, if you set an upper limit of 40 percent average CPU utilization across all your pods, and a lower bound of 20 percent, you won't experience any scaling events as long as the average CPU utilization stays in that range. WPA will only add pods to your ReplicaSet if average CPU utilization rises above 40 percent, and it will only start to remove pods if this metric falls below 20 percent.
The graph below shows the WPA's upper and lower bounds as horizontal lines. When the metric is between these values, no scaling events will occur. But if the metric moves above or below this range, the cluster is scaled up or down accordingly and the metric comes back into the desired range.

Additionally, WPA scales workloads more efficiently by allowing you to limit the number of replicas to add or remove in a single scaling event (as a percentage of the cluster's current size). This can protect against, for example, scaling up too much before the desired number of replicas is recalculated—only to have to scale back down again to target the desired metric value. And you can define a cooldown period to avoid triggering multiple scaling actions in rapid succession. With these WPA features, you can control the effect any single scaling action will have on the size of your ReplicaSet, and you can avoid sudden large changes in the size of your infrastructure.
Like the Datadog Agent, the WPA is open source, and we invite you to look it over, try it out (it's currently in beta), and contribute to the project. We're optimistic about the future of the WPA, and we've submitted a Kubernetes Enhancement Proposal (KEP) to contribute this project upstream.
Use node-based Agents at scale with ExtendedDaemonSet
The DaemonSet controller is the most popular way to deploy and operate agents in Kubernetes clusters. You can use the DaemonSet controller to apply a common configuration to your nodes so they're all running the daemons you require, for example to handle tasks like storage and logging. We rely heavily on the DaemonSet controller to ensure that our users can deploy the Datadog Agent to their Kubernetes clusters. Now, we are developing another open source project to enhance it: the ExtendedDaemonSet (EDS).
Rolling out changes across a large Kubernetes cluster can be complex and risky. The DaemonSet controller lacks fine-grained control of the deployment process, and so it can be hard to mitigate problems before they spread to the entire cluster. EDS gives you greater control over deployments—more specifically, it supports canary releases and provides additional options for rolling updates.
A canary deployment allows you to minimize risk by limiting the initial impact of a new release. For example, with EDS, you can create a canary release to deploy a new configuration to a subset of the nodes in your cluster. You can specify how long the canary period will last, and how many canary replicas will be created. When your canary deployment succeeds, EDS proceeds with a full deployment by executing a rolling update, which applies changes to your remaining pods at a rate you can configure.
We created the EDS to improve the process of deploying the Datadog Agent, but you can use it to deploy any agent in a Kubernetes cluster. We've open sourced this project so that you can test it out (it's currently in alpha). We hope you'll find it useful and we aim to contribute this project upstream to the Kubernetes community.
Deploy and manage Agents with the Datadog Operator
To make it easier to deploy and configure Datadog Agents in your Kubernetes infrastructure, we've created the Datadog Operator (currently in alpha release). Based on the Kubernetes Operator pattern (a popular way for users to automate the tasks required to operate applications on Kubernetes), the Datadog Operator adds functionality that specifically helps you operate Datadog Agents.
You may be operating more than one type of Agent (e.g., node-based Datadog Agents and the Cluster Agent), and configuring these Agents to monitor any combination of more than 1,000 technologies that Datadog supports. Customizing the configuration of these Agents is easy to do on a small scale but becomes more time-consuming with a large and ephemeral infrastructure.
Further, you may be using a combination of platforms and methods (e.g., Terraform, Helm, ConfigMaps) to configure and manage your Kubernetes clusters. The Datadog Operator provides a Kubernetes CustomResourceDefinition (CRD) so you can deploy and manage Datadog Agents through a single API resource. It also informs you of the results of your deployment actions via a single CustomResource status. Using the Datadog Operator, you can write configurations in just one place through a single API resource and easily apply them to the Agents running in your cluster.
To minimize the amount of configuration you need to write, the Datadog Operator provides a default configuration for the Agents you launch. But you can still customize your Agent configuration as needed, and the Datadog Operator will validate your configuration to catch any errors in your deployment specification. Once you've deployed the Agent, you can see the status of the deployment with a simple kubectl command.
The Datadog Operator is an open source project, and we hope you'll look at the code. It's an alpha release, so if you want to try it out, do so in a sandbox environment. We encourage you to keep an eye on this project, and if you have any other ideas, please open an issue or a pull request.
Committed to the community
We're pleased to bring you new features for monitoring Kubernetes with Datadog, and to contribute enhancements to the Kubernetes ecosystem. We look forward to hearing your feedback on these and future developments, and we hope you'll come talk to us at the Datadog booth at KubeCon. If you're not already using Datadog, you can start today with a free 14-day trial.

