Mallory Mooney

Jesse Gumz
Tags are essential for aggregating and contextualizing monitoring data across your infrastructure; they enable you to monitor your entire system at a high level, drill down to individual services for more comprehensive analysis, and easily correlate data from every application component.
Implementing a consistent and effective tag schema for your applications can be challenging, especially as they grow in complexity. For example, teams may be required to manually add tags to every application service, host, and container configuration. This can lead to inconsistencies in how individual components are classified at a high level (e.g., tag name, spelling, or case), making it more difficult to collect data.
Datadog alleviates some of these pain points through unified service tagging, a standard configuration for adding key identifiers to your applications and consistently applying them across every application service, host, container, and more.
In this post, we’ll show how unified service tagging can help you:
- easily apply your tags to all of your services once
- use your tags everywhere (metrics, traces, logs, and profiles)
- identify problematic releases and their root causes with the version tag
Apply your tags once
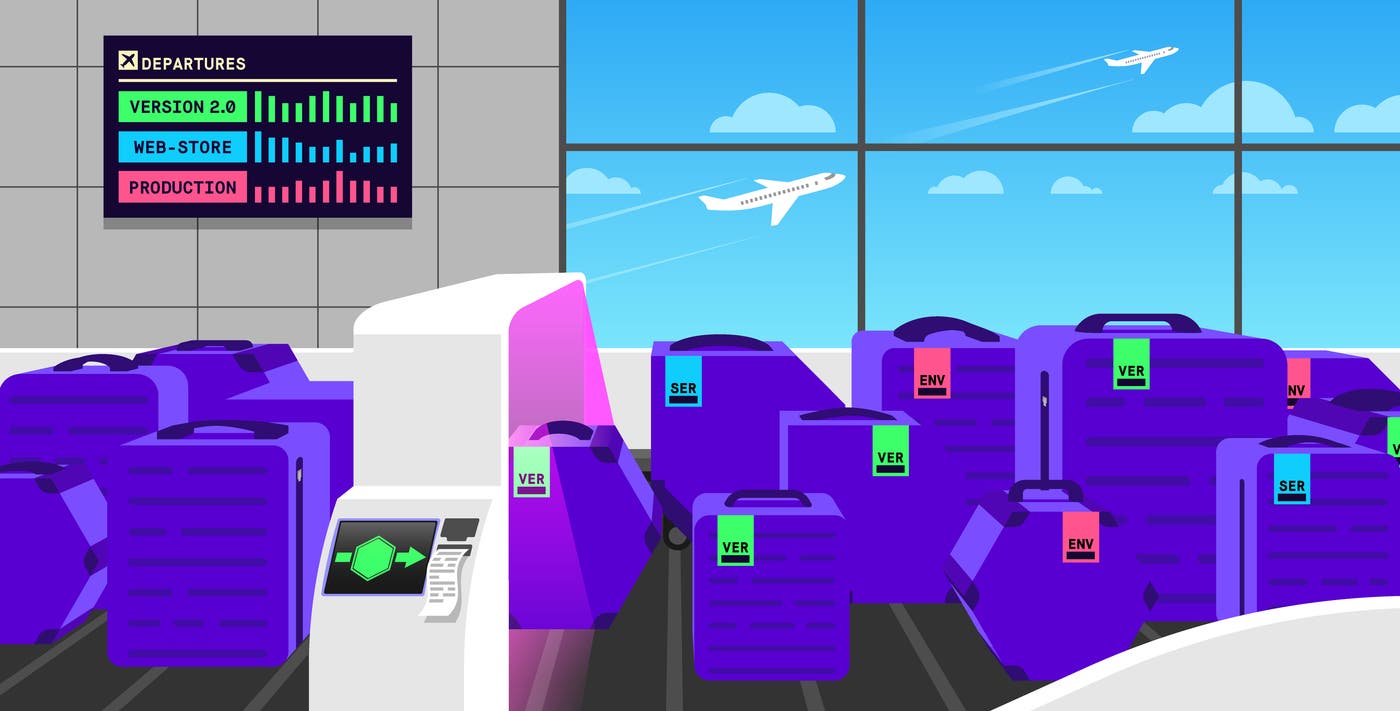
Unified service tagging provides a baseline for categorizing application components, which Datadog accomplishes by reserving three standard tags for your applications: env, service, and version. Reserved tags automatically connect different data types in Datadog, providing a single source of truth for monitoring data streaming from your applications. For example, you can use these tags to find all production logs for the latest version of a particular web service.
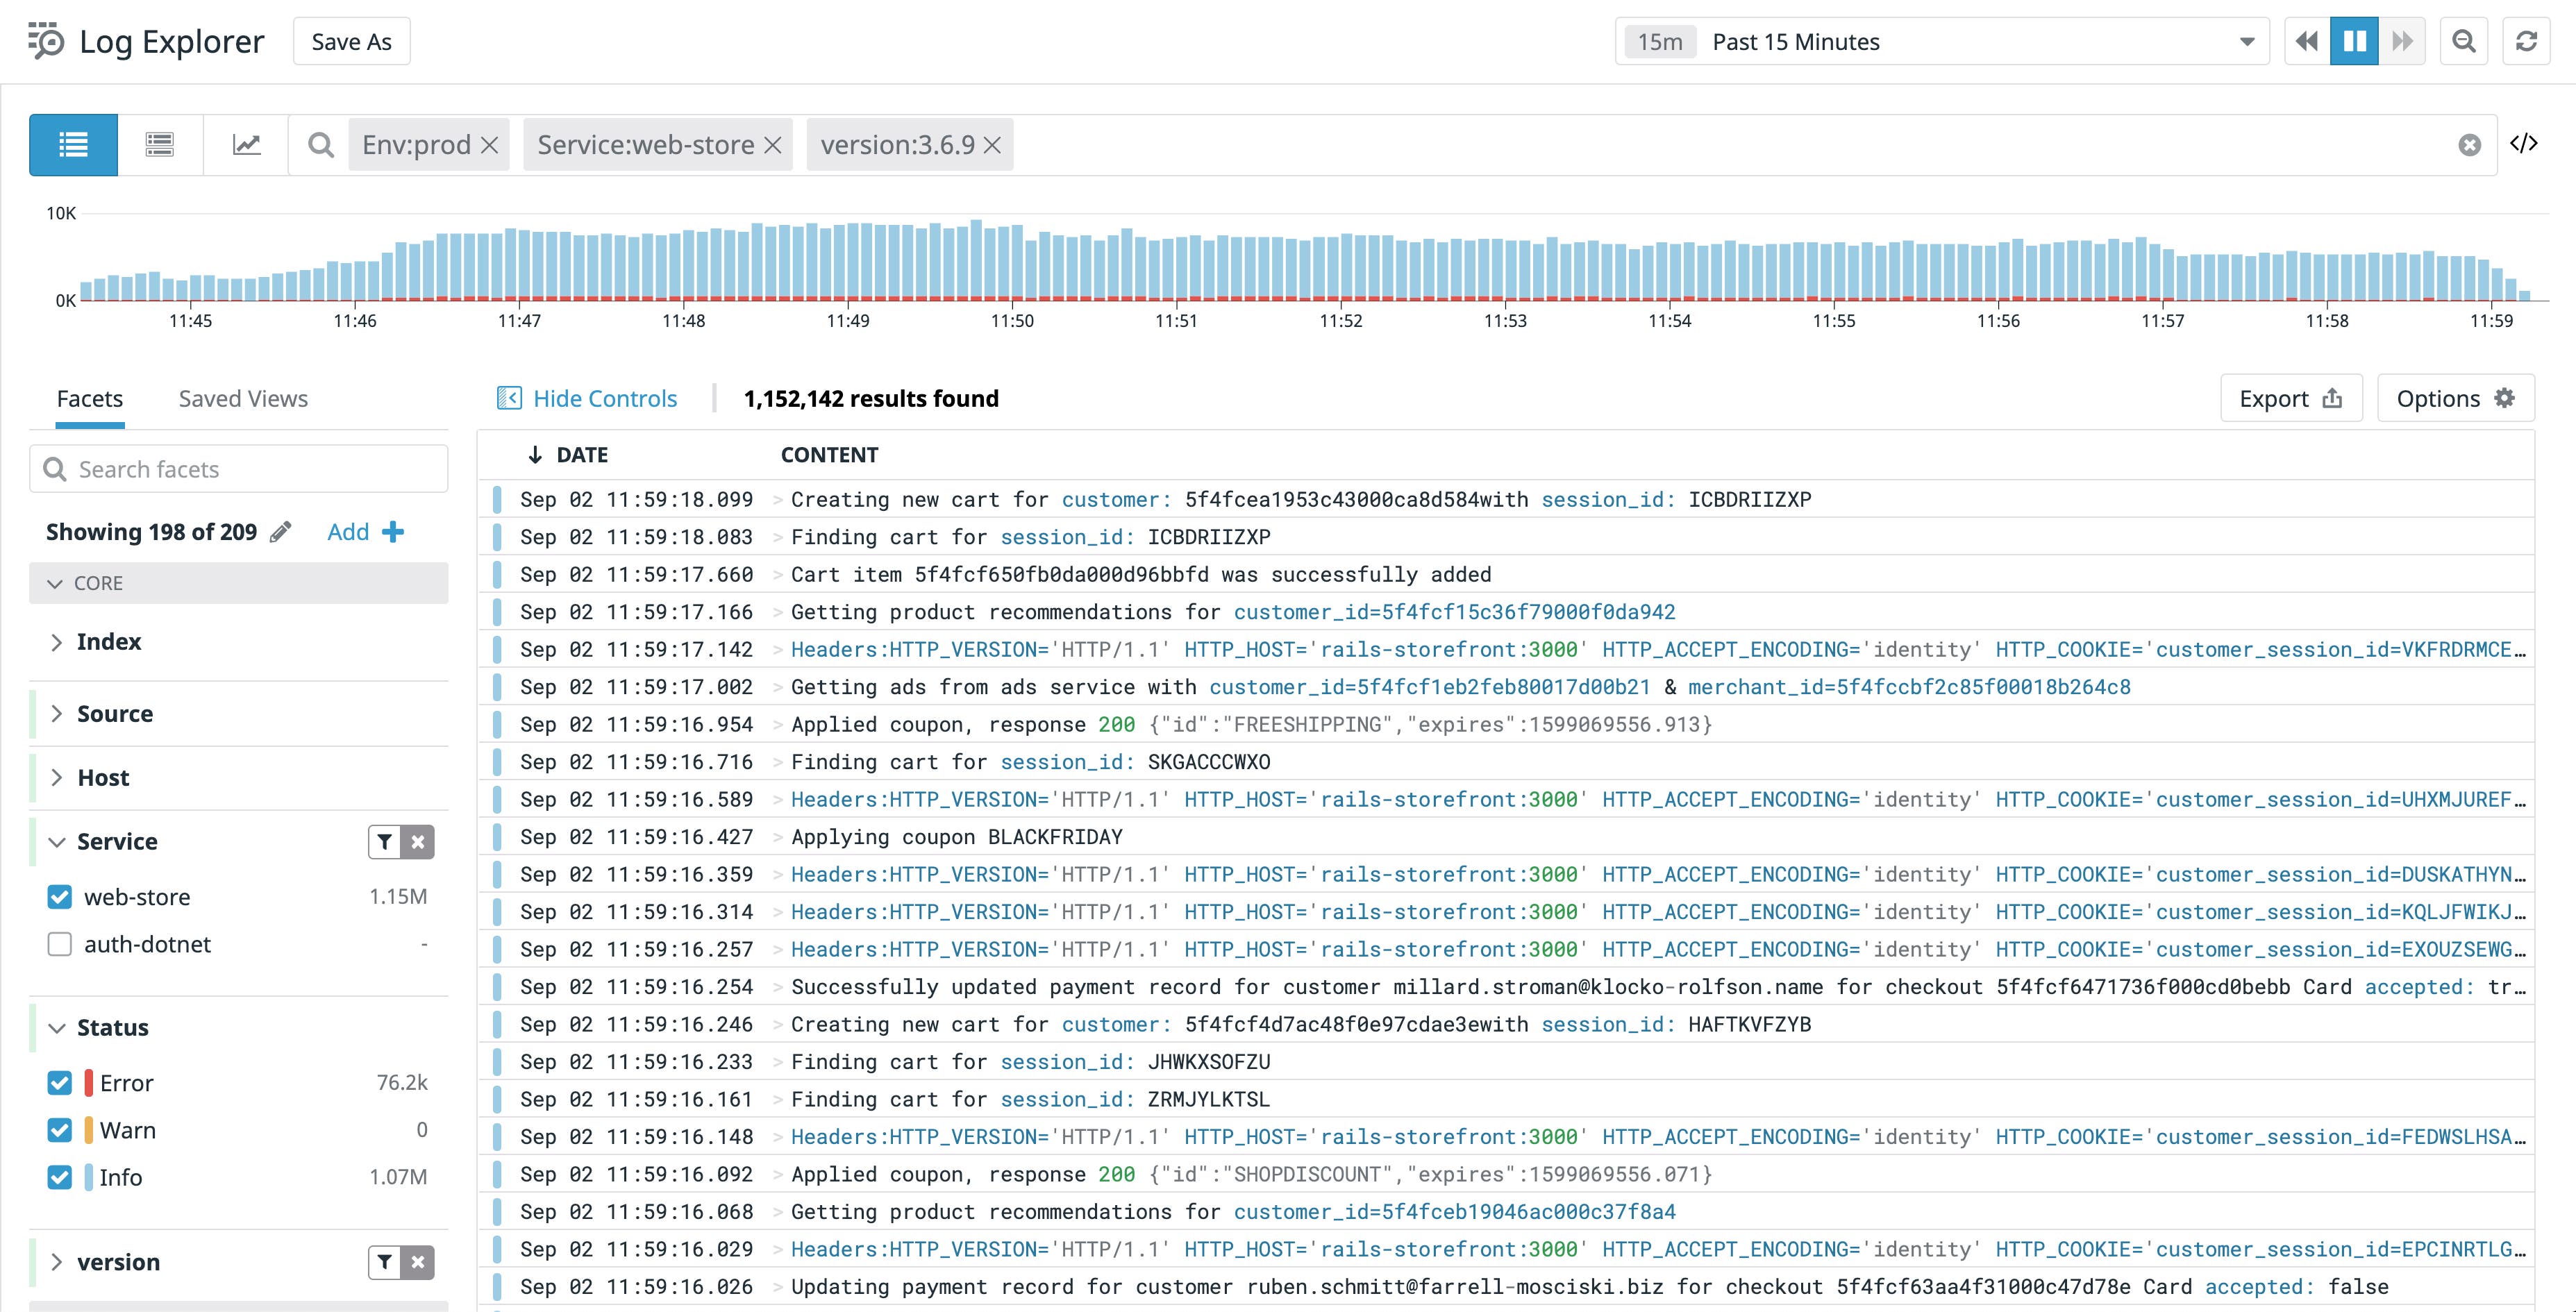
As you add these standard tags to your application, Datadog will propagate them across your services, giving you a simpler way to create consistent points of reference for monitoring application performance in one place and pivoting between infrastructure metrics, logs, and traces.
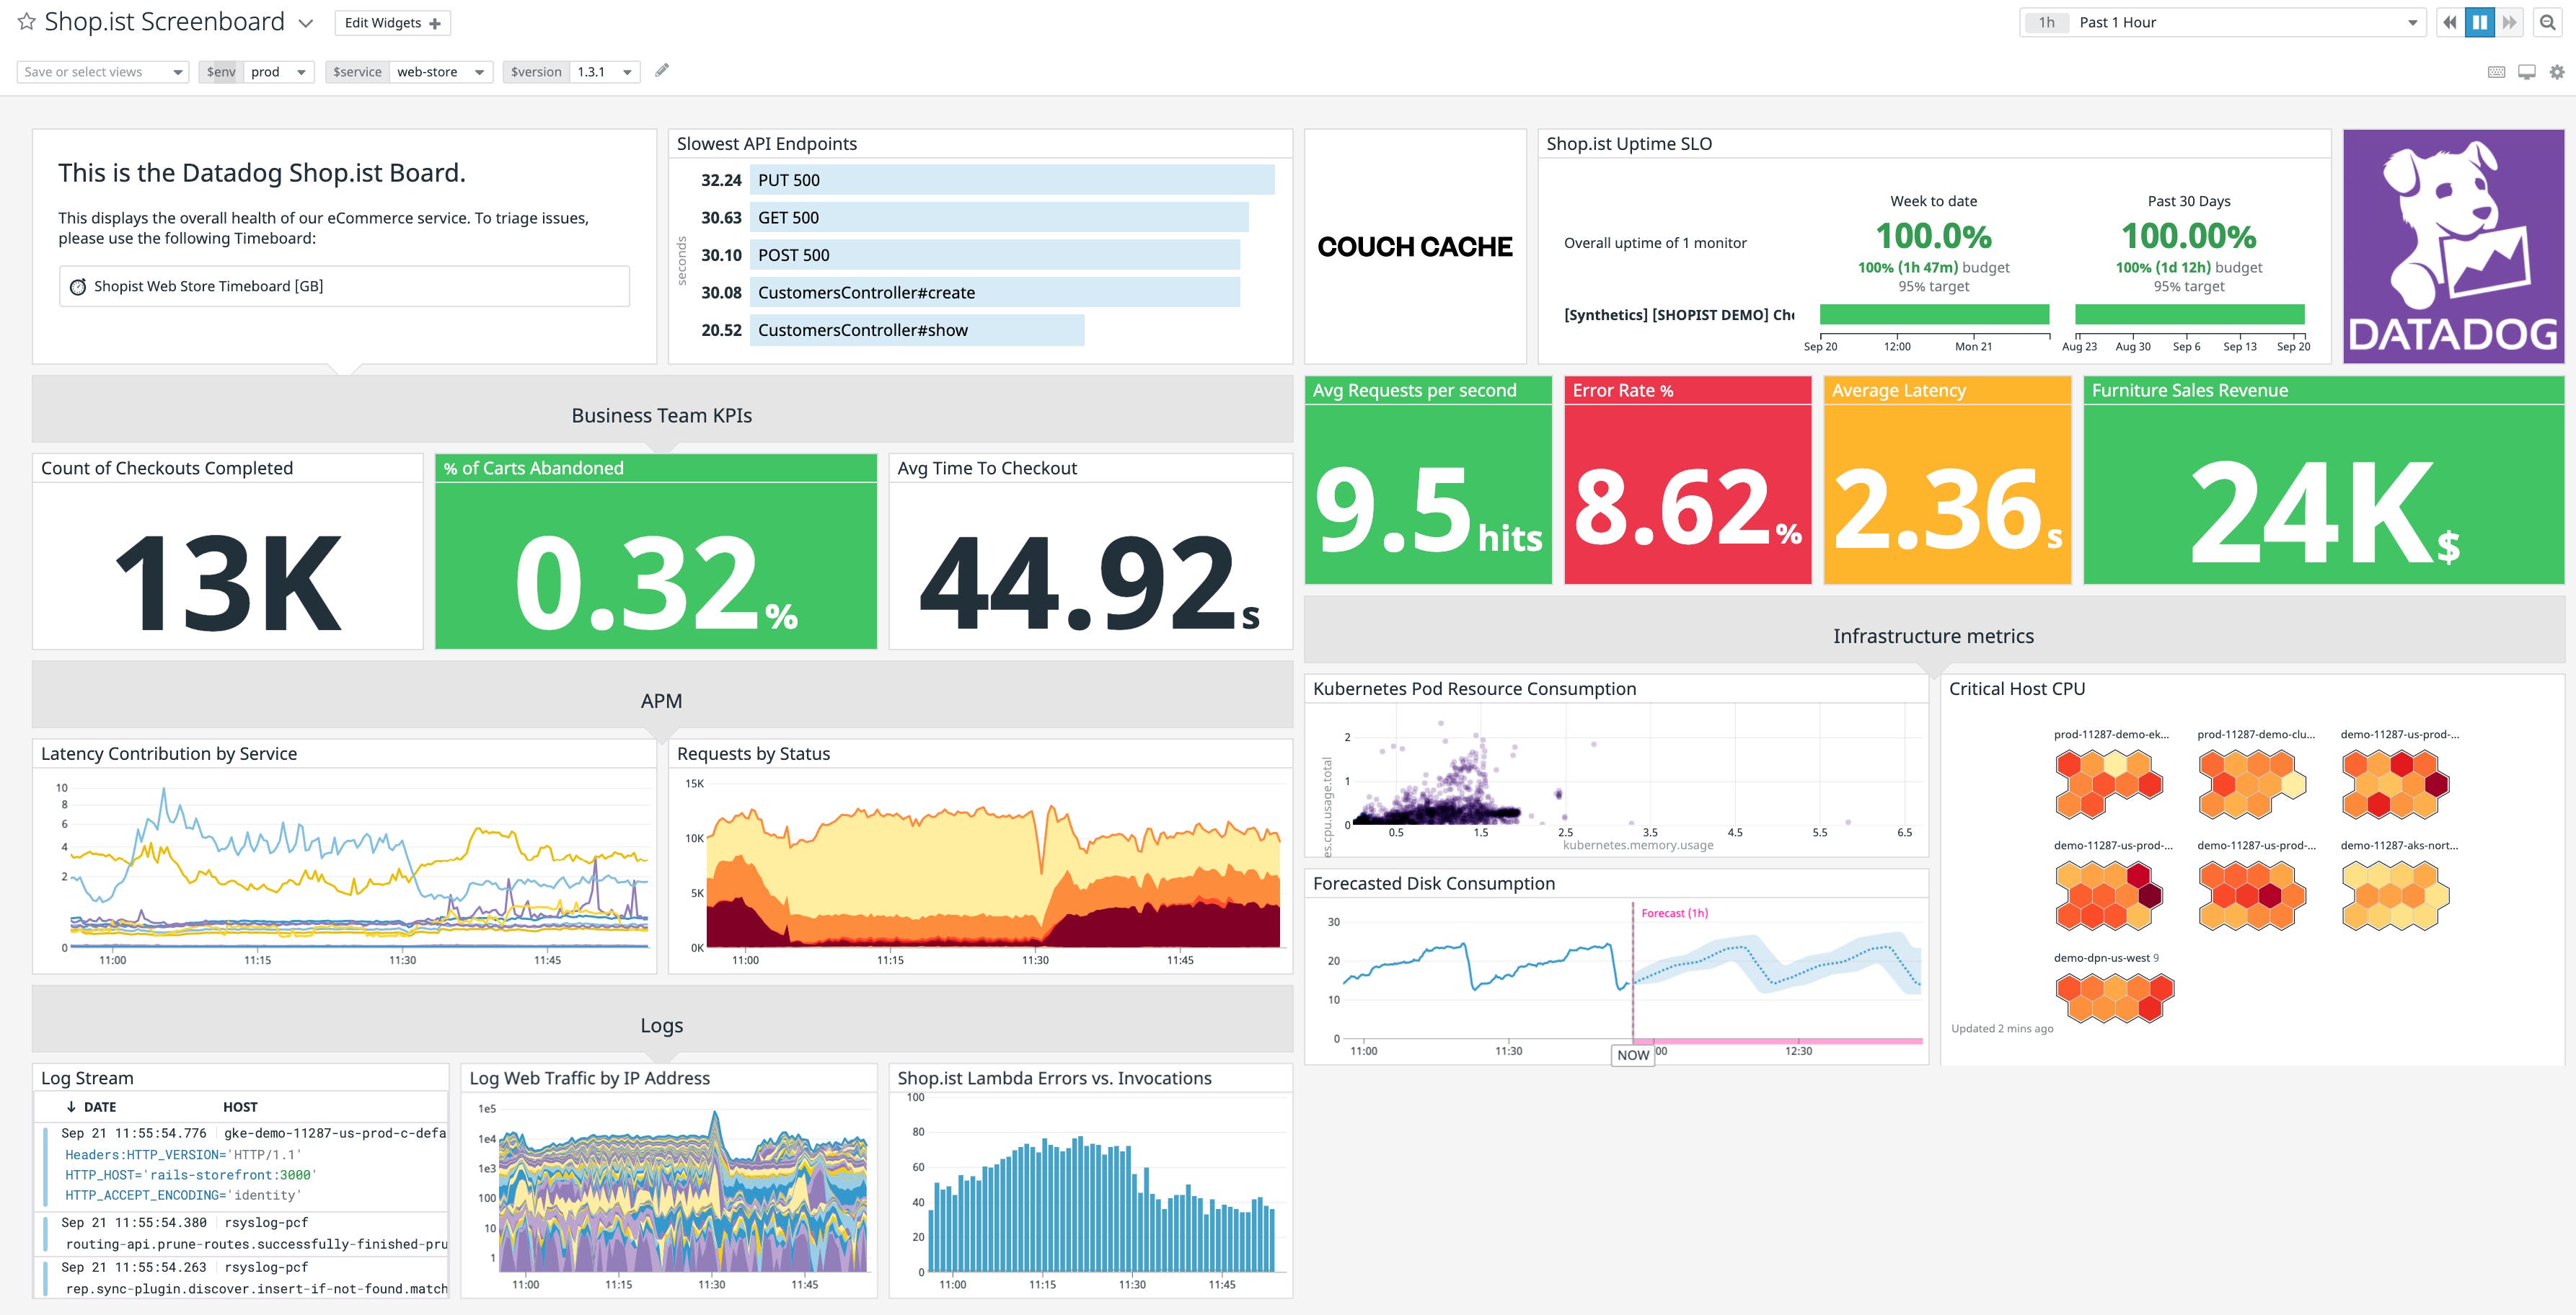
Unified service tagging also gives your developers an easy and flexible process for configuring telemetry for their own services and work independently from teams managing the Datadog Agent (e.g., devops).
For non-containerized environments running multiple services per host, you can export these tags as environment variables (e.g., DD_ENV, DD_SERVICE, DD_VERSION) for your services’ executables or use an orchestration tool such as Chef to automatically populate service configurations. Next, you can configure an APM tracer with your environment variables, and Datadog will add them to your traces as tags. If your tracer is enabled with log injection, Datadog can automatically add the same env, service, and version tags to your logs. This gives you the ability to seamlessly pivot from a trace to all related logs for faster troubleshooting.
Datadog also gives you the flexibility to append environment, service, and version tags to your own services in containerized environments (e.g., Kubernetes, Docker). These tags can be set to environment variables in your services’ configuration files, such as a Kubernetes deployment template or an ECS task definition, enabling you to use variable values generated by your orchestration tool or CI/CD system for tagging purposes.
The example Kubernetes deployment template below uses environment variables to set env, service, and version tags at both the deployment and pod levels:
apiVersion: apps/v1kind: Deploymentmetadata: labels: tags.datadoghq.com/env: "<ENV>" tags.datadoghq.com/service: "<SERVICE>" tags.datadoghq.com/version: "<VERSION>"...template: metadata: labels: tags.datadoghq.com/env: "<ENV>" tags.datadoghq.com/service: "<SERVICE>" tags.datadoghq.com/version: "<VERSION>" containers: - ... env: - name: DD_ENV valueFrom: fieldRef: fieldPath: metadata.labels['tags.datadoghq.com/env'] - name: DD_SERVICE valueFrom: fieldRef: fieldPath: metadata.labels['tags.datadoghq.com/service'] - name: DD_VERSION valueFrom: fieldRef: fieldPath: metadata.labels['tags.datadoghq.com/version']With this configuration, the values for your DD_ENV, DD_SERVICE, and DD_VERSION environment variables–either set manually, by your orchestration tool, or by your CI/CD system–will propagate down to every container within your deployment as tags. This enables Datadog to automatically map those tags to pod-level and state metrics (such as CPU and memory usage), container logs, and traces. Datadog offers different configurations for Kubernetes, Docker, and ECS environments, so you can check out our documentation for more information about setting them up with unified service tagging.
Use your tags everywhere (metrics, traces, logs, and profiles)
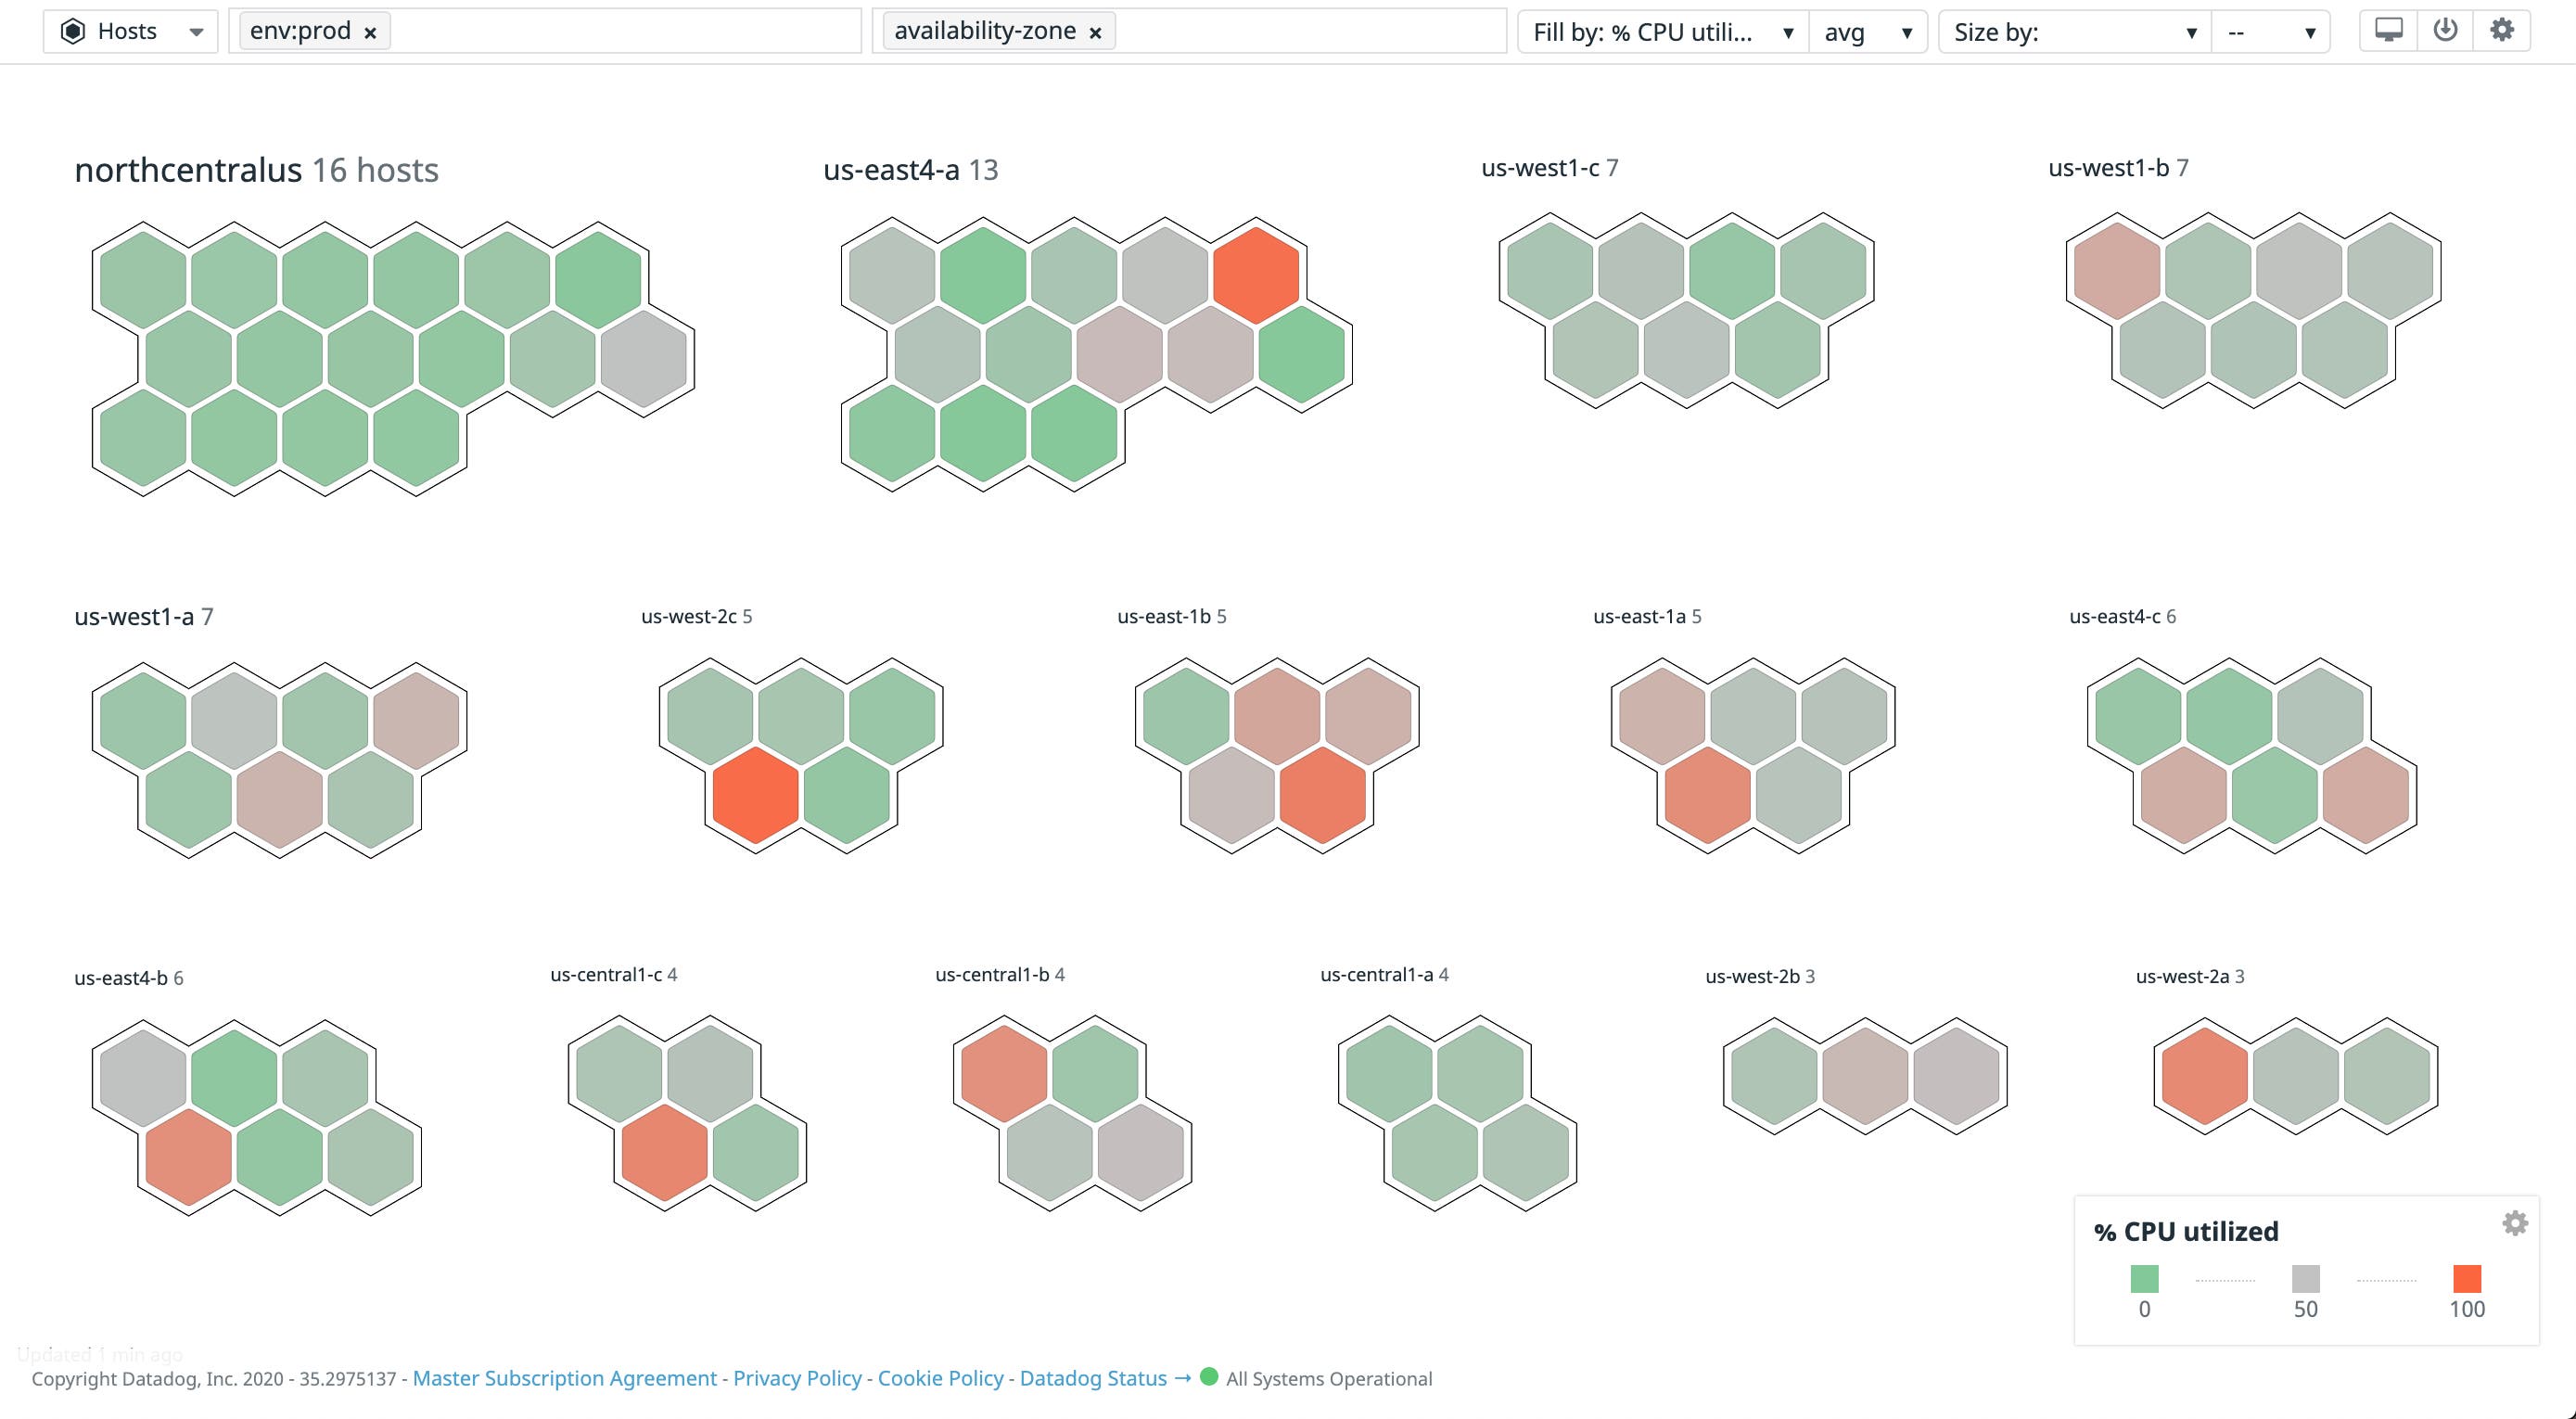
You can use the standardized tags that Datadog reserves for unified service tagging—along with any other tags assigned to your applications—in Datadog’s host and container maps to get a high-level overview of your environments, then drill down for deeper insights into application performance.
For example, you can compare CPU usage in both your staging and production environments in the host map to ensure your hosts have equivalent compute power. Or, you can view hosts across an environment’s availability zones to see if you need to add (or remove) resources based on CPU utilization.
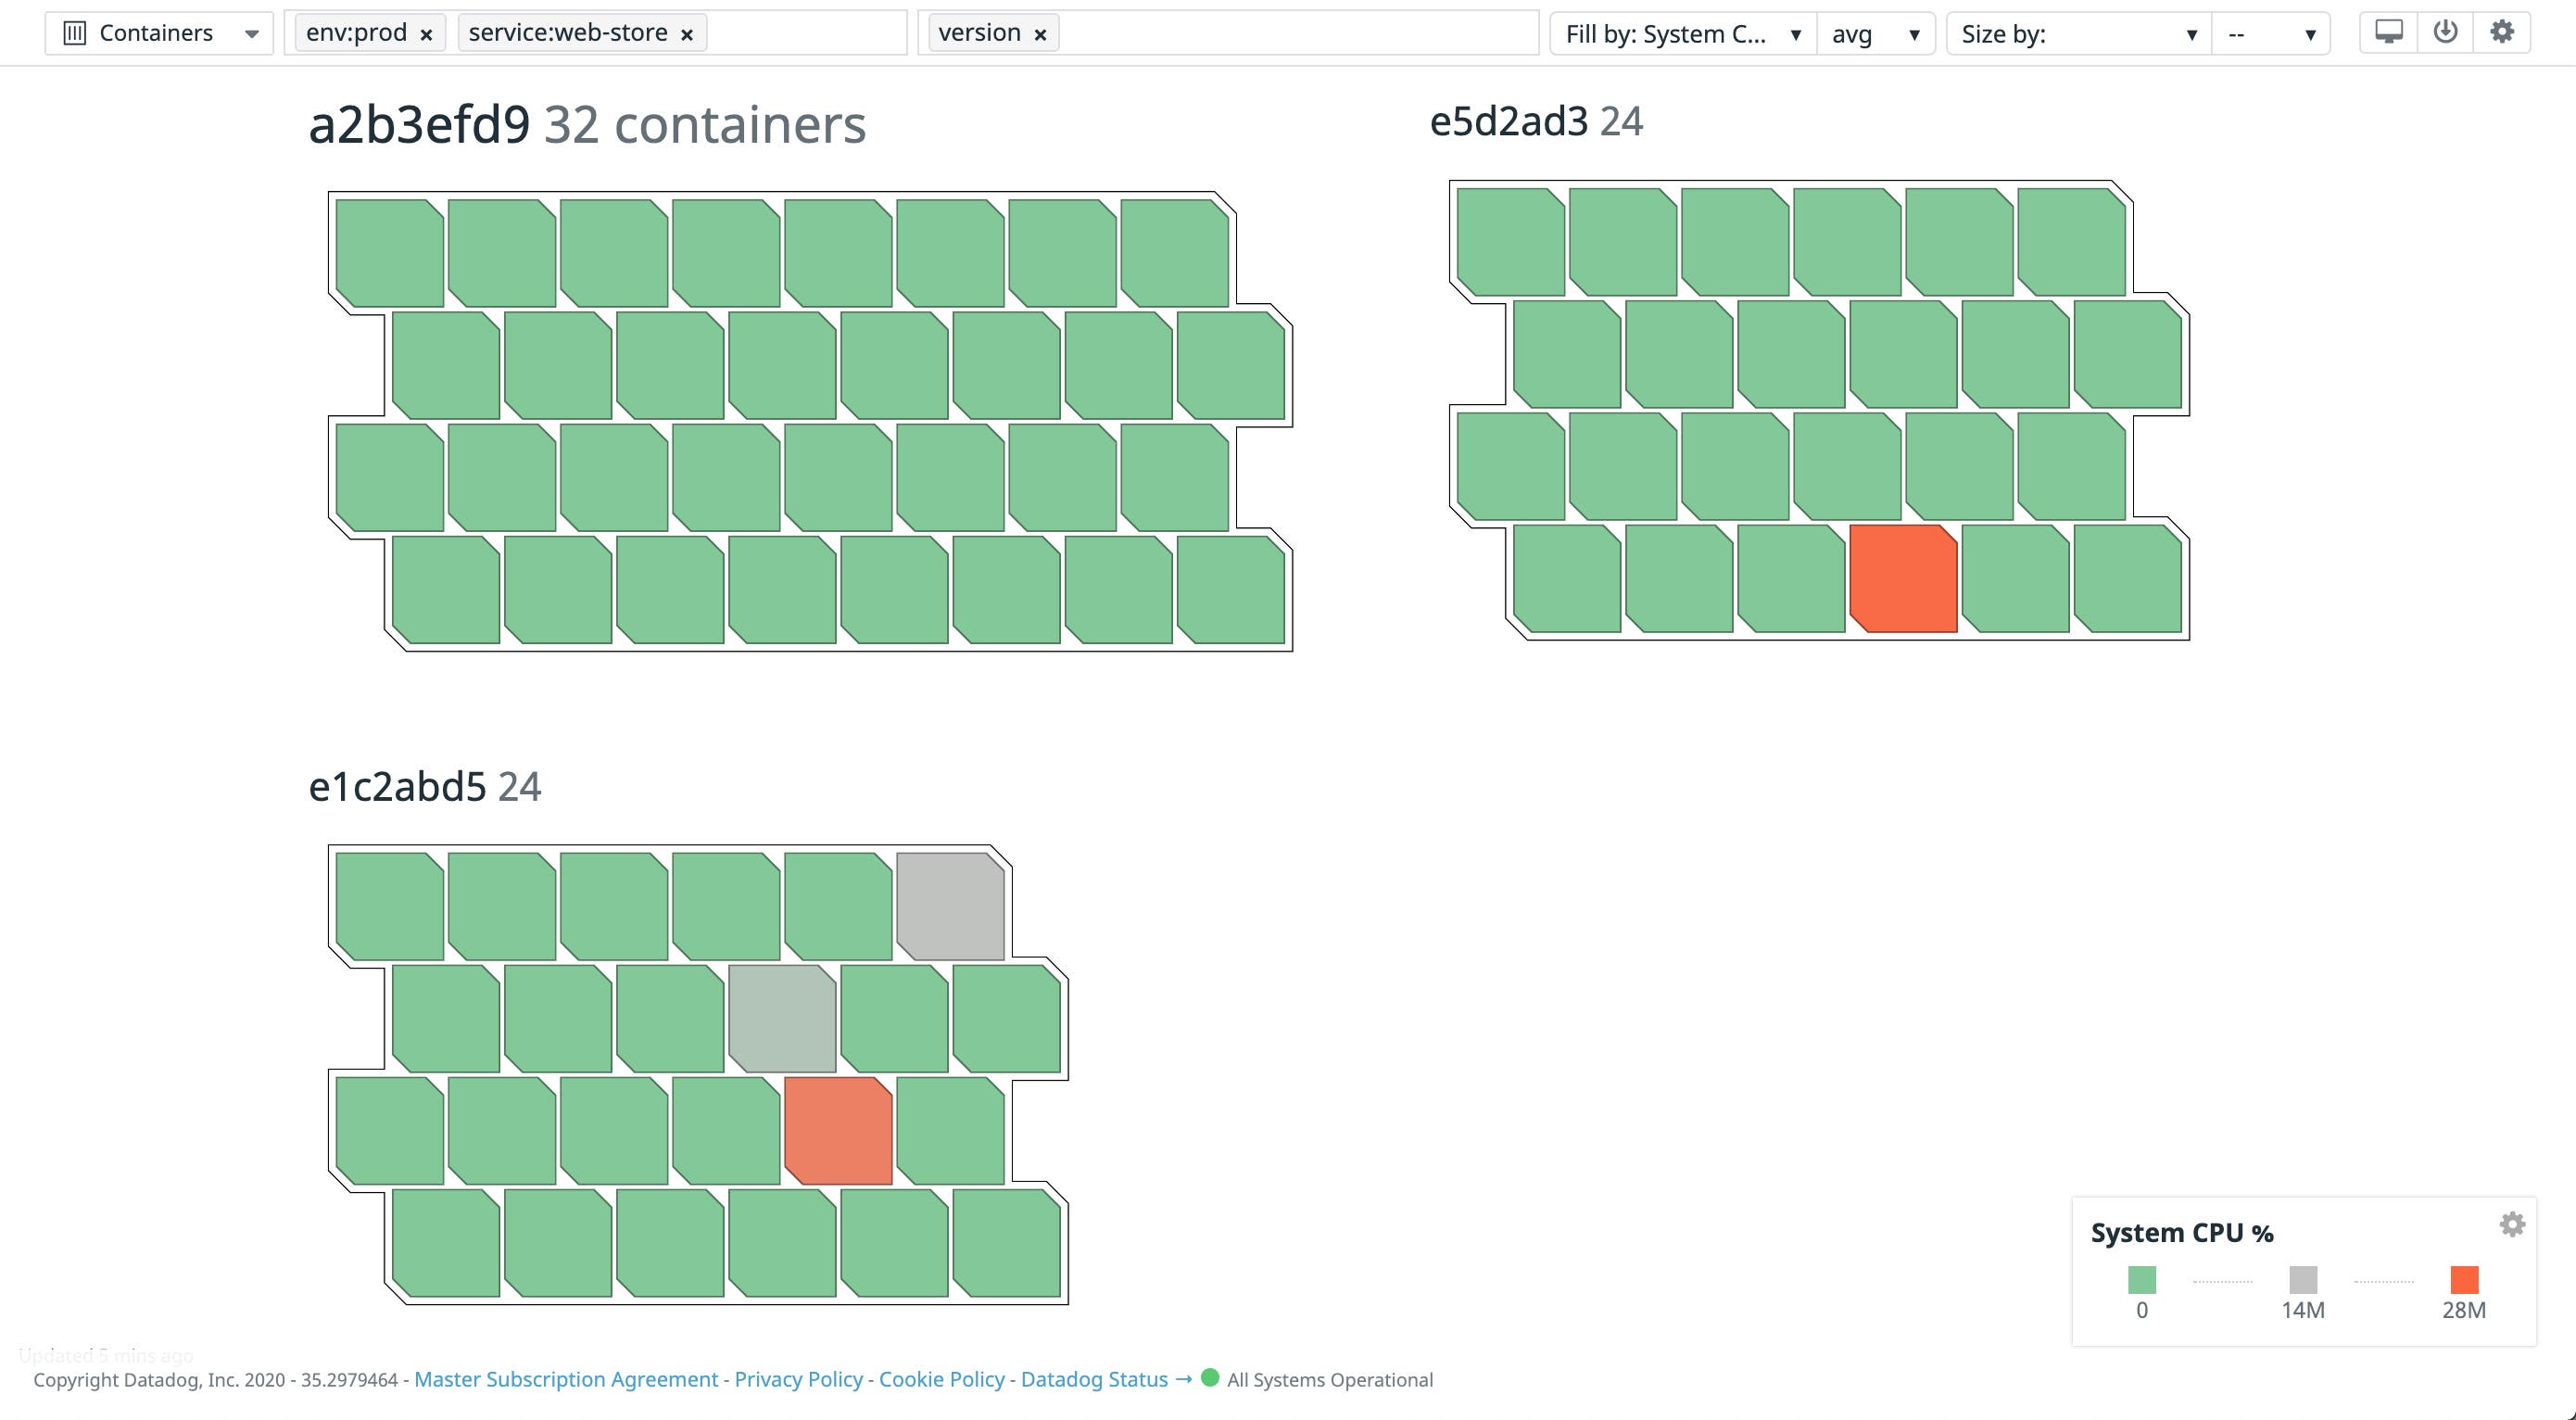
In containerized environments, container versioning can help you keep track of new service updates by linking container updates to a specific version of application code. As part of unified service tagging, you can add the version tag to your services so you can easily monitor the impact of new code deployments on your application services. For example, you can use this tag in the container map to compare CPU usage across all service container versions.
If a new deployment causes unusual increases in a service’s CPU usage, the container map can help you determine which containers were affected.
Use the version tag to identify problematic deployments
While the container map provides a high-level view of deployment activity, Datadog APM can help you pinpoint the root cause of a deployment issue. For example, you can use the version tag generated by your orchestration tool or CI/CD workflow to view a breakdown of requests by release number, so you can easily monitor performance for different deployment strategies such as rolling updates, dark launches, blue/green deployments, or canary releases.
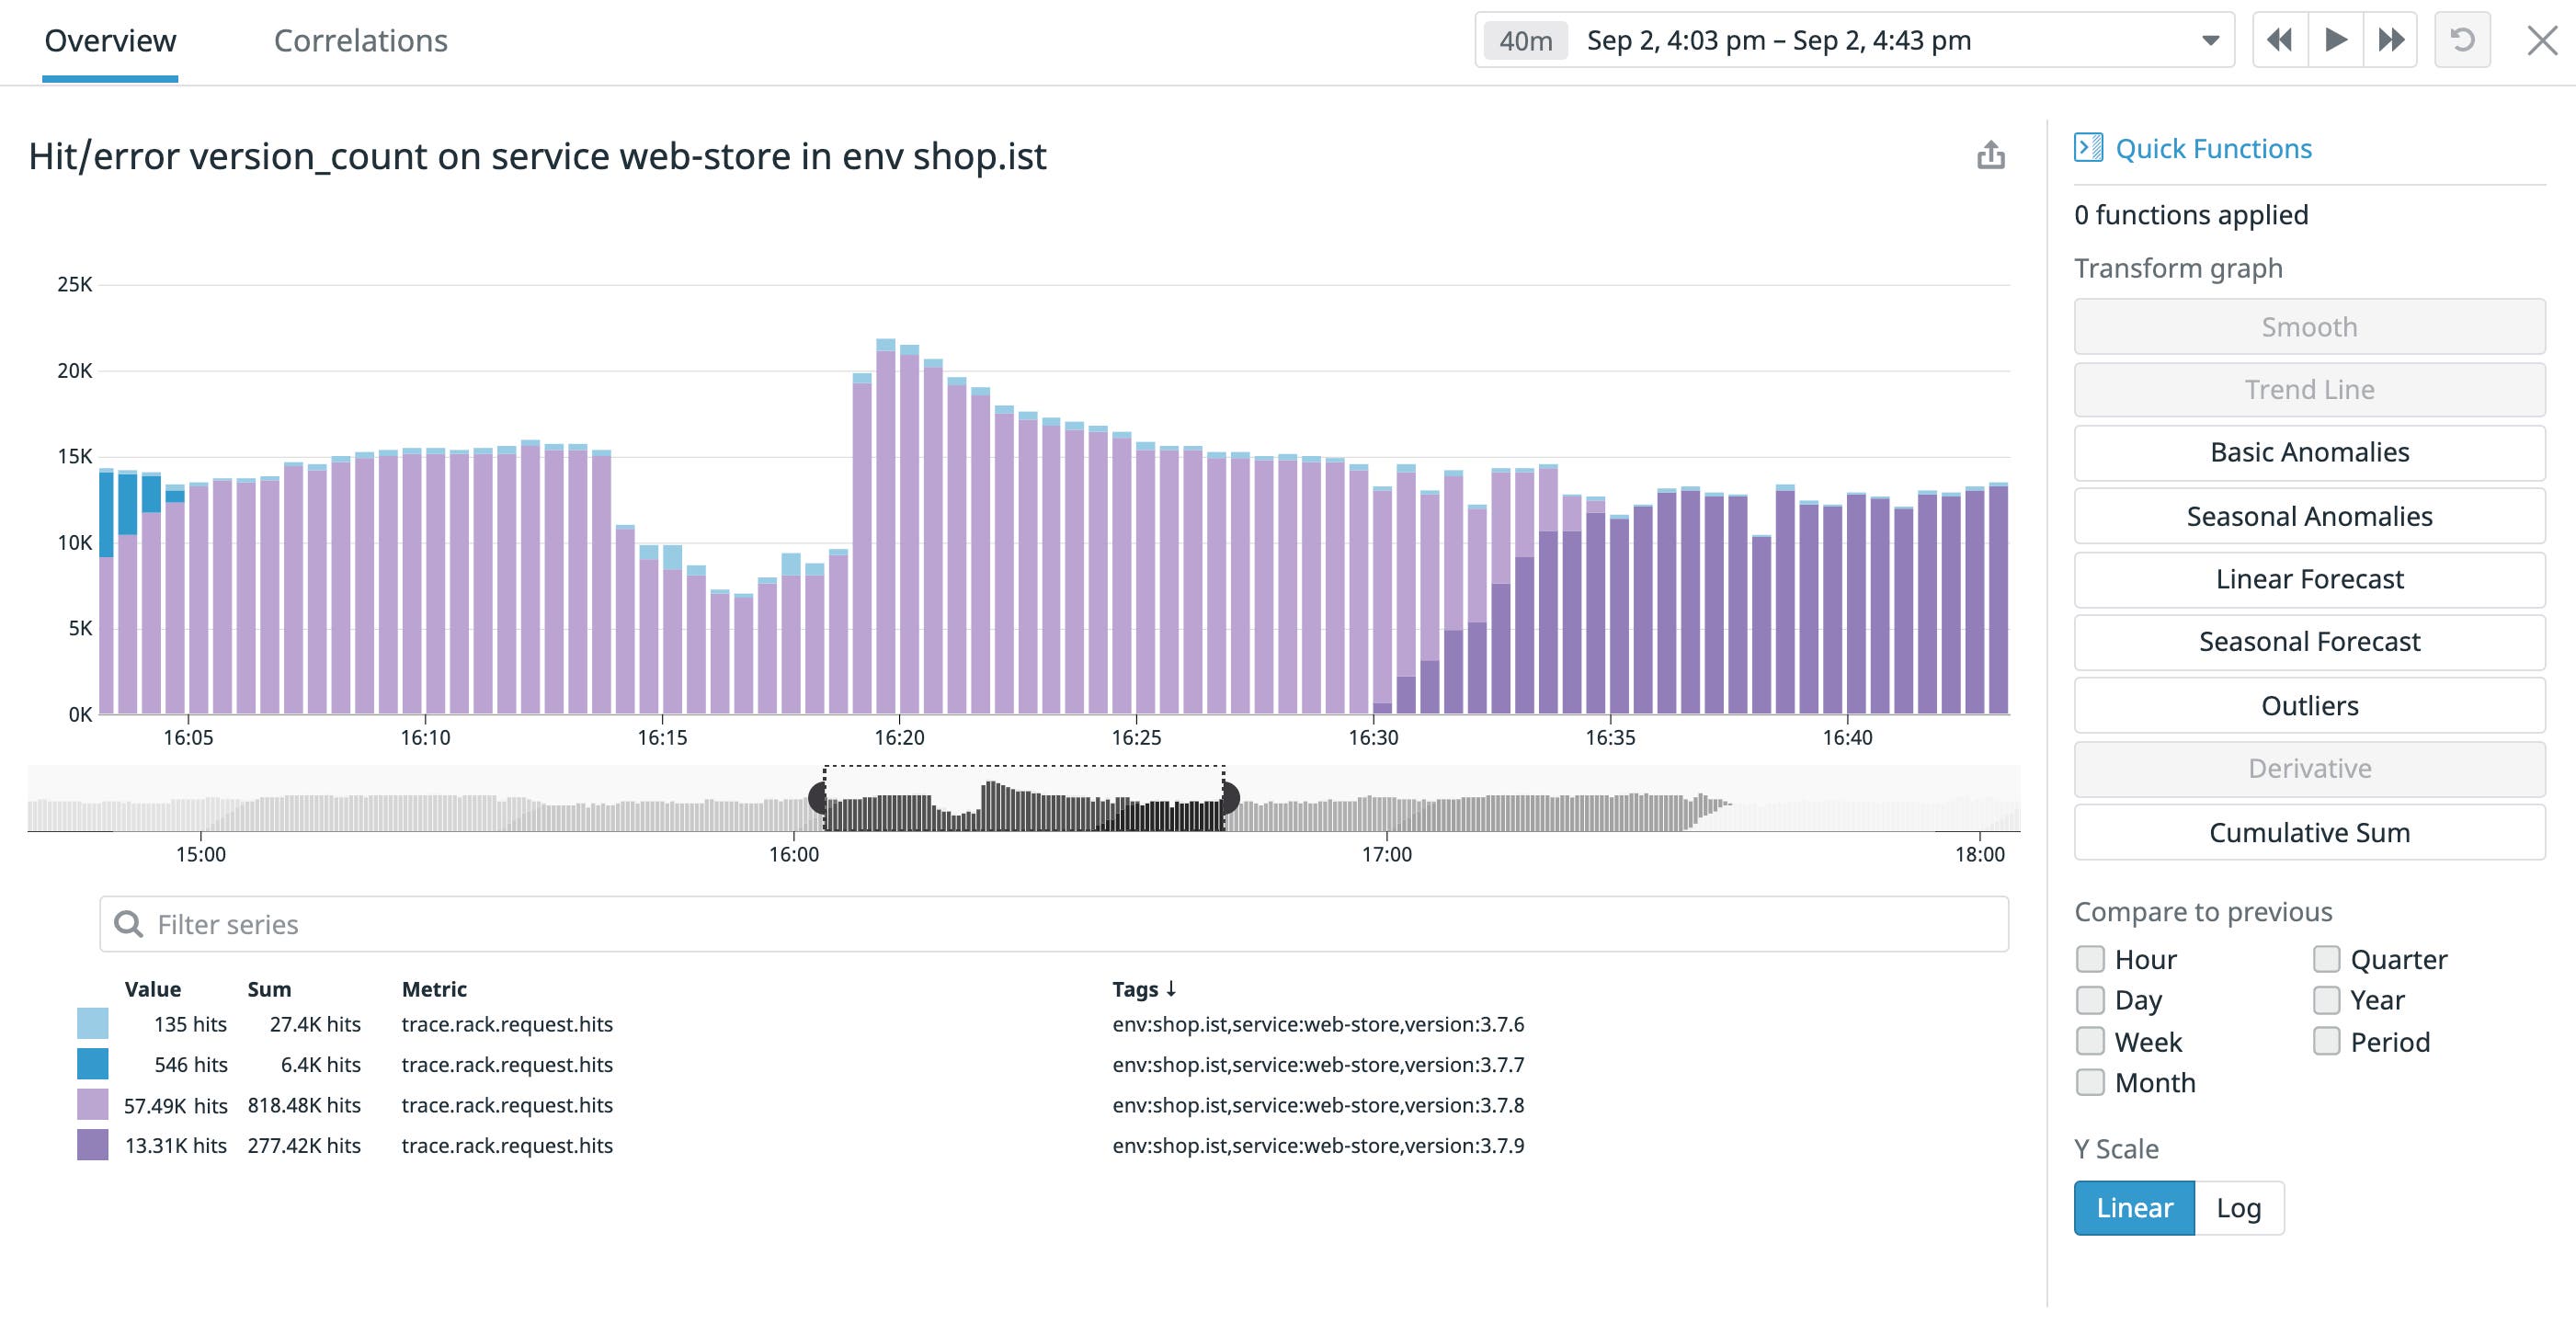
The example graph above shows a dip in requests during a rolling update, which could be an indicator that a new bug was introduced with the update. You can compare this sudden drop in requests with error counts by version to visualize how new code deployments impact service performance over time and correlate errors with the dip in request count.

If you see a sudden spike in errors for an application service that coincides with a dip in requests, you may be able to determine the cause by looking at a stack trace, which is a report of what happened when an exception was thrown. With unified service tagging, you can immediately drill down to traces corresponding to the affected version and review more details about a request, including stack traces of any errors.
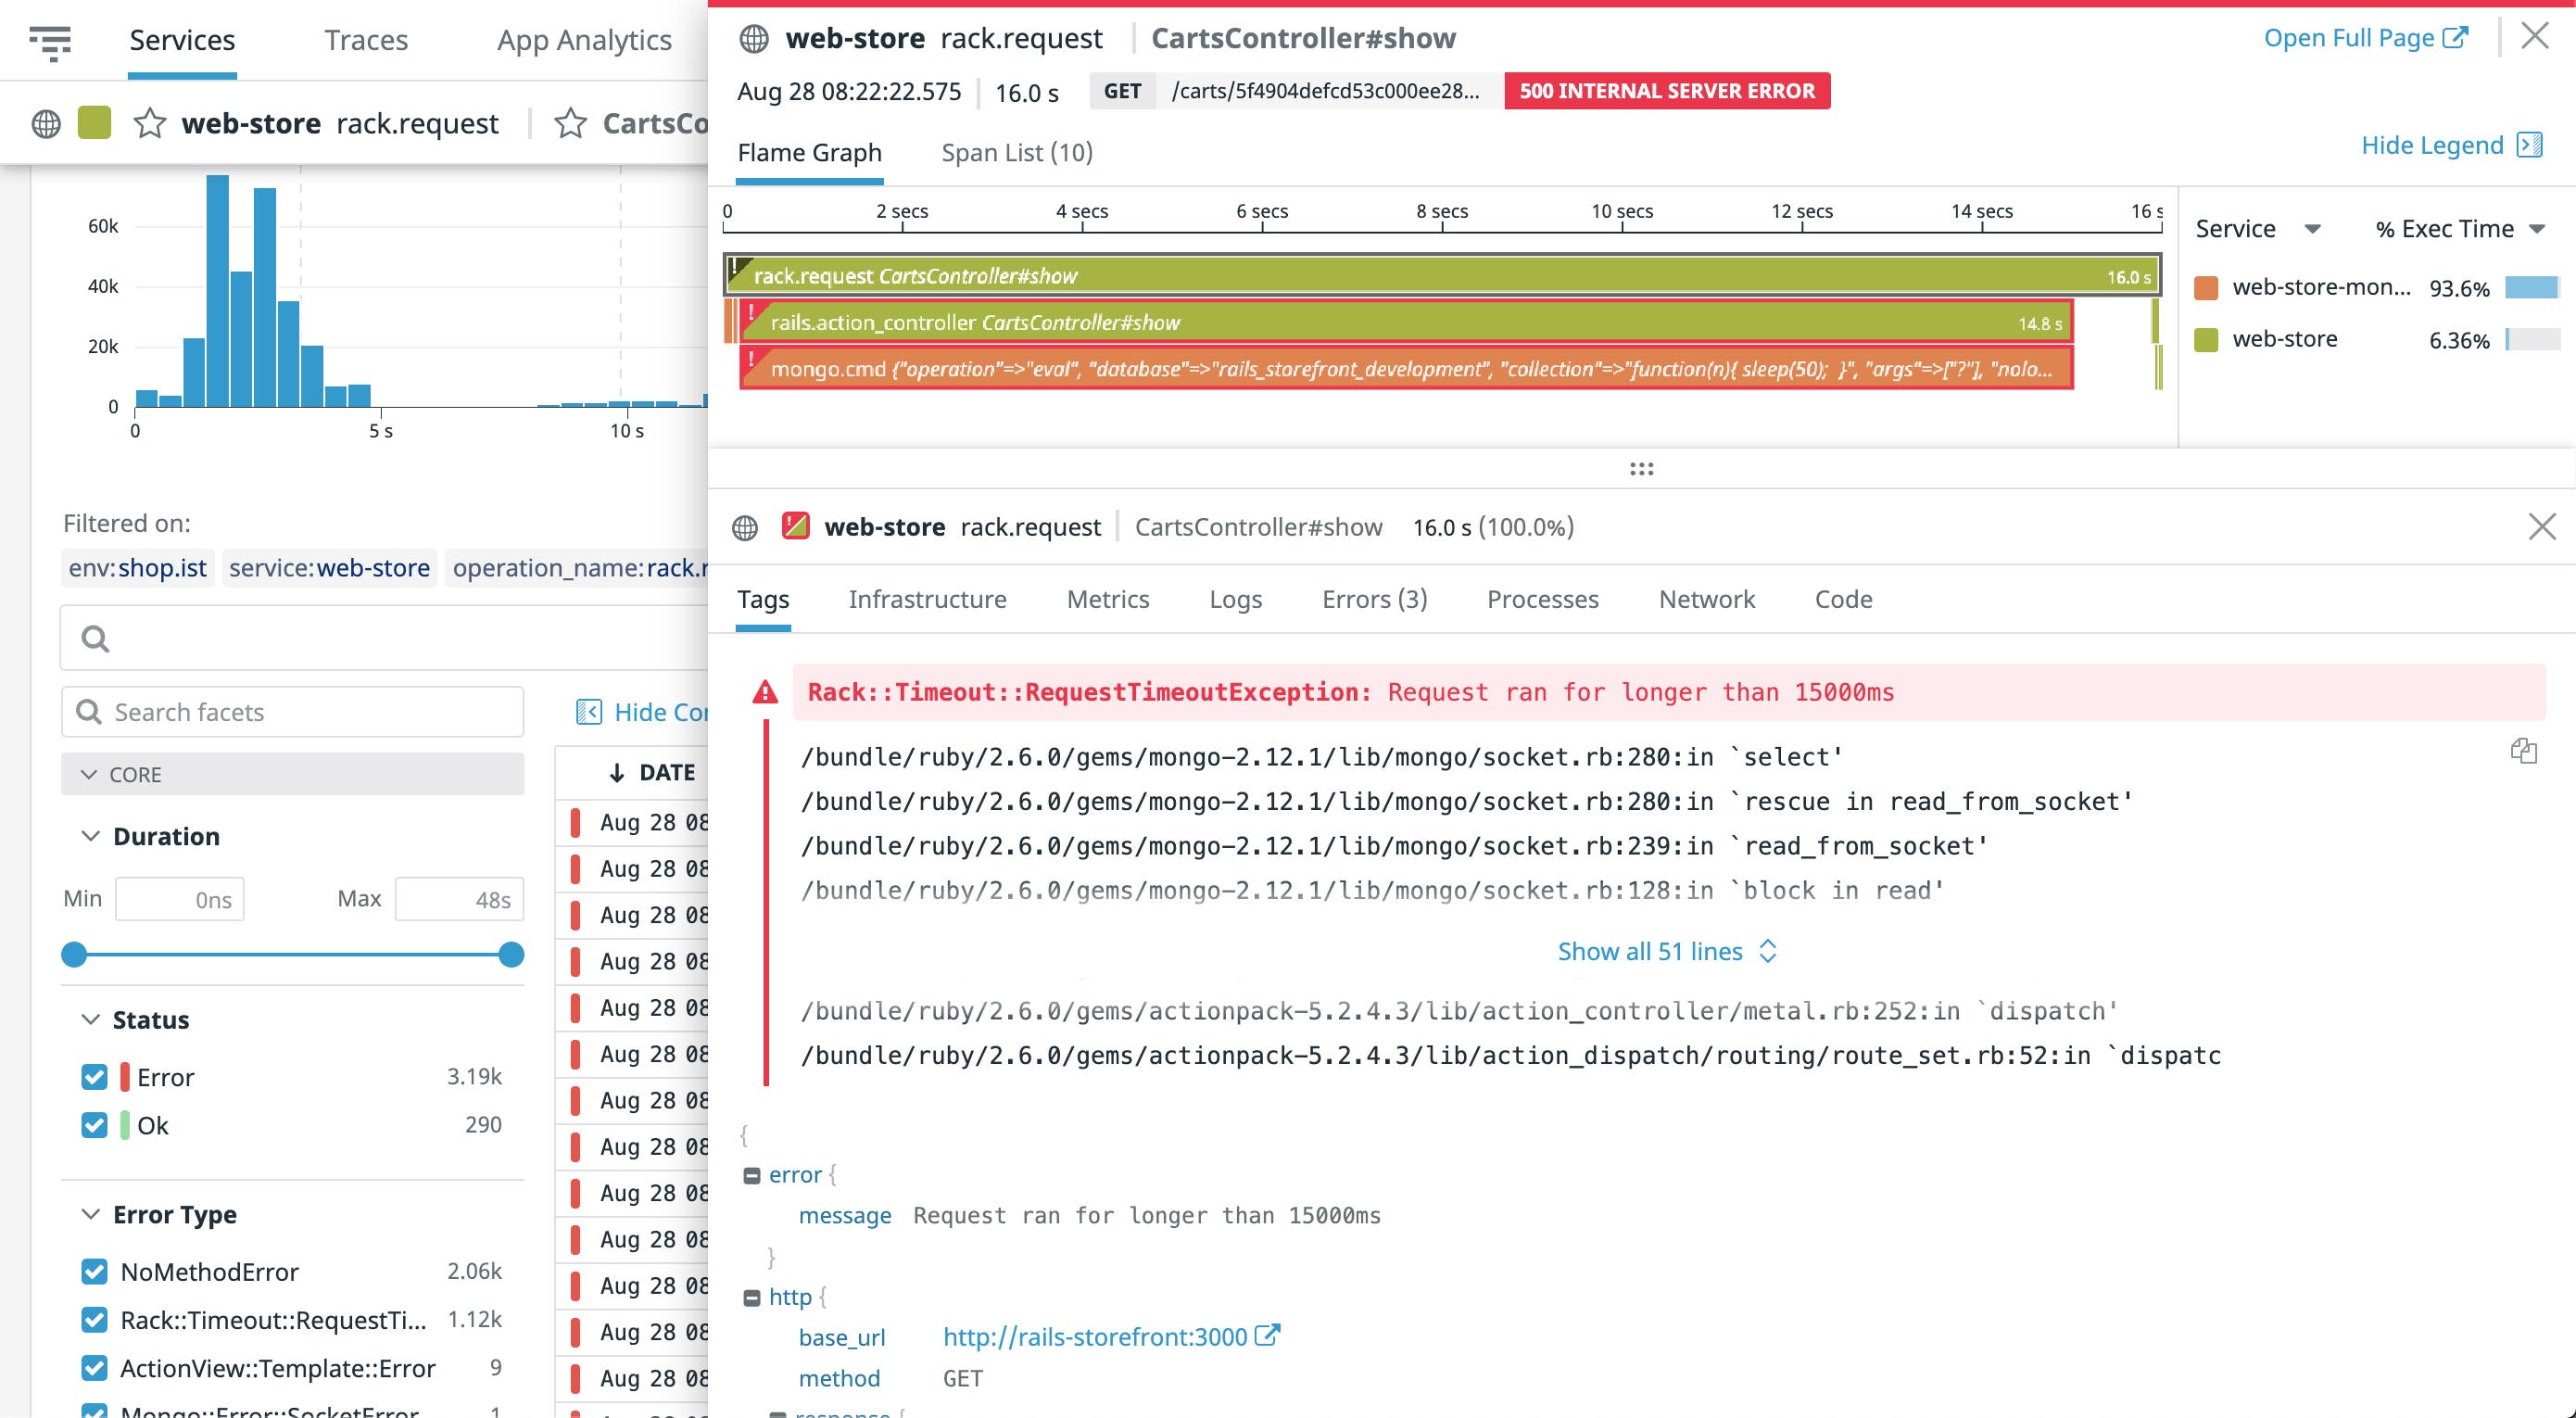
From this view, you can easily pivot to logs generated from the affected deployment as Datadog automatically connects traces to logs with the reserved service tag. This allows you to quickly determine what caused the high rate of errors for an application service and resolve the issue.
Datadog also seamlessly correlates traces with your infrastructure metrics so you can easily monitor infrastructure performance alongside individual services. This enables you to determine how a recent release affects individual services and overall application performance in one place.
Simplify your tagging today
Datadog’s unified service tagging enables you to consistently apply tags to your services, ensuring that you don’t miss critical service metrics, logs, or traces. Additionally, your developers can configure telemetry for their own services when they need to, so they can monitor performance independently from other teams. Check out our documentation to learn more about unifying your tags or about the other ways you can assign tags to your applications. And if you don’t already have a Datadog account, you can sign up for a free 14-day trial.
