Nicholas Thomson

Miranda Kapin
Session Replay now includes Browser Dev Tools, a new feature that enables engineers to identify and debug the root causes of issues even faster by exposing key information about a playback session, such as network performance bottlenecks and any console log errors. This wealth of surrounding context will make it easier to trace frontend incidents throughout your application and remediate larger, ongoing issues.
In this post, we’ll show you how to leverage Dev Tools console logs to home in on the root cause of issues and dive deeper into network performance to trace issues from the frontend to the backend.
Resolve user-facing issues with console logs
The Console tab in Dev Tools shows you all browser logs collected during a session. This enables you to troubleshoot more efficiently by getting granular detail into your code’s impact on the end user.
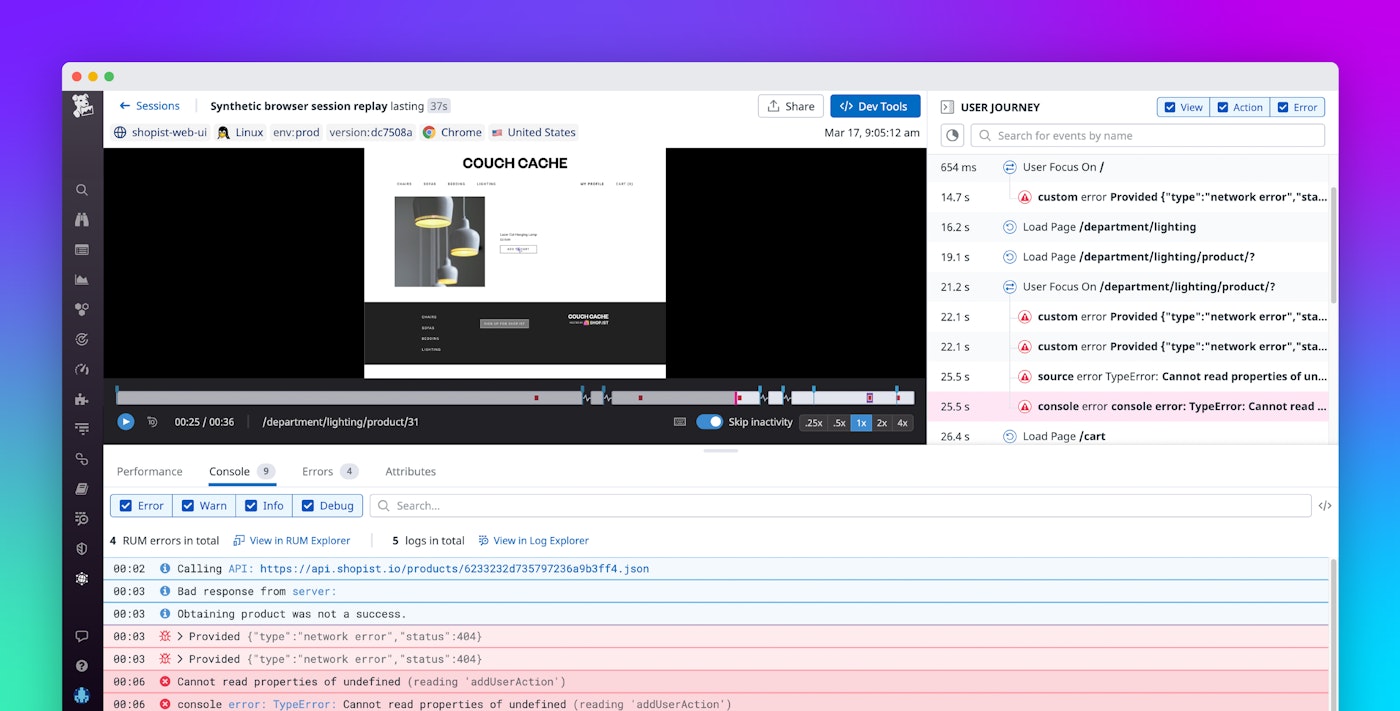
Say you’re monitoring your e-commerce app and notice a new issue in Error Tracking. To gain more insight into the cause of the cannot read properties of undefined error, you can pivot to Session Replay to view the most recent session that experienced this issue. Dev Tools will appear automatically if you click “Jump to Replay.”

The Console tab displays a timeline of your console logs—including errors, which are highlighted in red and can help you pinpoint the root cause of issues. Through the logs, you can track the user’s journey from the initial call to your API to the error, Cannot read properties of undefined (reading addUserAction).

Because your team recently deployed a new version of your frontend software, you check the source code for the functionality that enables the user to add an item to their cart and discover that a typo was causing the error. Now that you have gotten to the bottom of this issue, you can prevent many future errors of the same kind.
Console errors are linked with Error Tracking, allowing you to easily identify which error logs (indicated by the bug icon) are widely affecting your users. The Errors tab shows you whether the errors in the session are indicative of larger issues in your system. Below, you can see that the error you are investigating has occurred 150 times over the past six months, suggesting that it is part of a larger, ongoing issue.

Dev Tools console logs also provide visibility into Content Security Policy (CSP) violations. Though CSP is a security policy that is designed to protect against cross-site scripting (XSS) and other attacks, it can also cause hidden issues in your application if, for instance, your policy is blocking legitimate resources from loading. For example, if a designer updates your site to use Google Fonts for styling, you need to update your CSP policy to allow the appropriate resources to load from that source. Otherwise, your policy will block those resources from loading and the design of your site will not look right.
Trace issues from the frontend to the backend
Session Replay Dev Tools provides a waterfall of events and their network performance during any given page view. You can use this information to better understand and address your customers’ needs by identifying long requests that may be tied to performance issues. Say you are a support engineer and a customer reports that they are unable to finalize a purchase on your site. Instead of wasting valuable time trying to reproduce the issue, you can use Session Replay to view a video-like playback of that customer’s real session.
To get further insight into this issue, you can open up Dev Tools and use the Performance tab to inspect a timeline of the resources loaded, along with a list of Google’s Core Web Vitals (e.g., largest contentful paint, first contentful paint, cumulative layout shift, and DOM content loaded). When you click on Network, you can filter load times for different kinds of resources like JavaScript or CSS. You can also filter to inspect specific types of errors (console or source) and event timings (such as DOM content loaded). All of this information works in concert to show you which changes to the DOM are causing bottlenecks or throwing errors.
In this case, you can see that this user tried to load a lighting product page, which set off a series of long tasks and resulted in a network error.

Because APM integrates with RUM, you can investigate further by looking at the backend traces collected for this session. Datadog can automatically connect the request to the backend trace to provide full-stack visibility. You can view the full details of the corresponding trace directly in the Dev Tools interface. If a trace is associated with a request, you will see an APM trace icon appear next to it in the Dev Tools waterfall.

Clicking on the icon will open up the trace view, which helps you visualize the end-to-end path of the request. In this case, it helps you discover that the long requests were being transmitted to a third-party API provider whose license expired a week ago. Now that you know the source of the error, you can renew the license or switch to a different provider.
Faster debugging with Session Replay Dev Tools
Session Replay Dev Tools offers a wealth of additional insight into your user experience and helps you identify performance bottlenecks. Console logs show you the precise points at which your code is throwing errors, while Error Tracking indicates if and when individual errors are connected to larger issues that affect numerous users. All of this complements Session Replay’s video-like reproduction of real user journeys on your site, making it easy to address any pain points.
If you’re new to Datadog, sign up for a 14-day free trial to gain insight into your end-user experience.


