Thomas Sobolik
When your apps and infrastructure rely on dozens of third-party providers for key functionality, it’s important to closely track their outages. If a service you rely on goes down, you need to move quickly to limit the outage’s impact on your users. IsDown provides a detailed status page aggregator and uptime monitoring for all your third-party dependencies. By using IsDown, you can monitor the availability of all these tools and services in one place, and receive instant alerts when one starts experiencing issues.
Datadog’s IsDown integration enables Datadog and IsDown customers to track emerging outages and their statuses over time. The integration lets you send outage events and status information from IsDown to Datadog, so you can monitor the availability of your third-party dependencies from within Datadog’s unified observability platform.
The integration is available at no additional cost to current Datadog and IsDown customers. If you don’t have IsDown yet, you can purchase a software license with an included free trial in the Datadog Marketplace. In this post, we’ll show how you can leverage Datadog dashboarding, event management, and alerting to track outages with IsDown.
Track your dependencies’ statuses from a unified view
Once you’ve configured the integration to send data from IsDown to Datadog, you can monitor your dependencies’ statuses and track any ongoing outages by using Datadog’s dashboards and events. The included out-of-the-box IsDown dashboard collects status events emitted by IsDown whenever a new outage begins or resolves, showing the most recent events at a glance in the event stream widget.
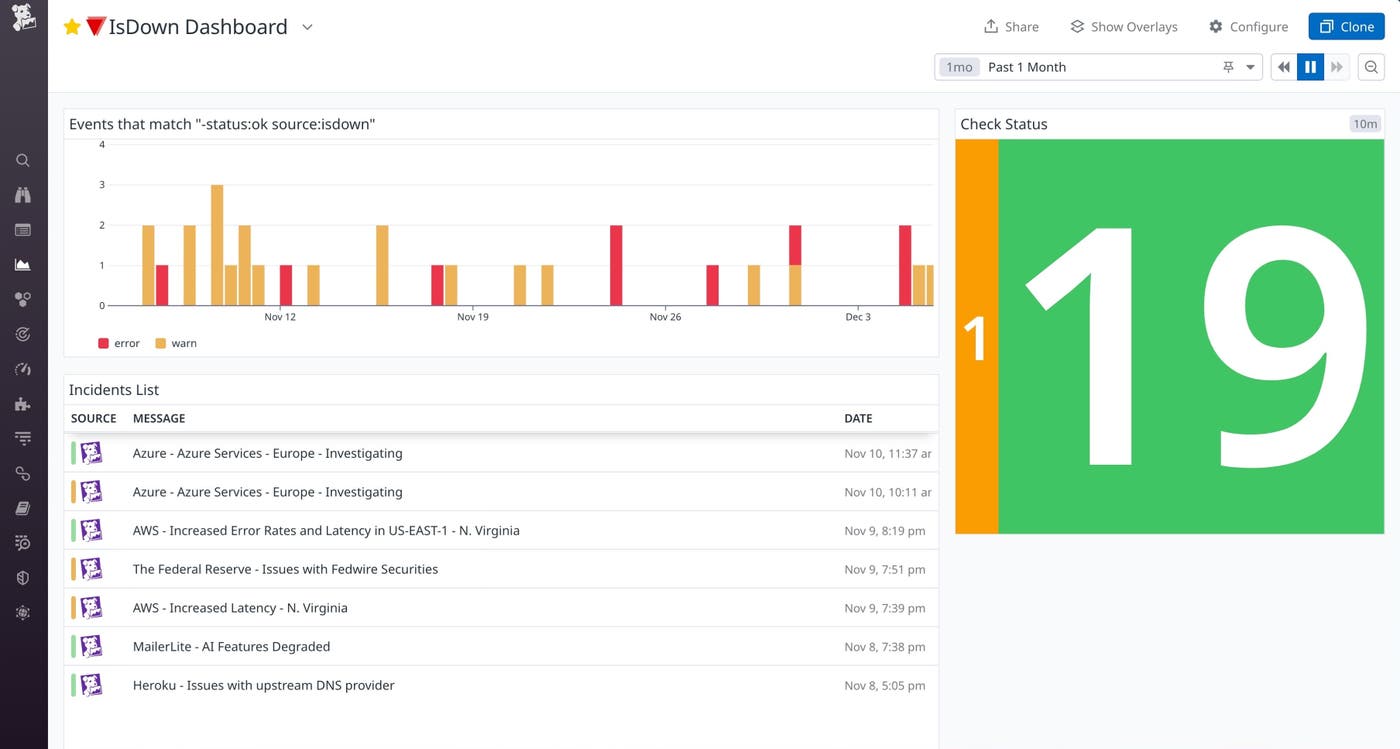
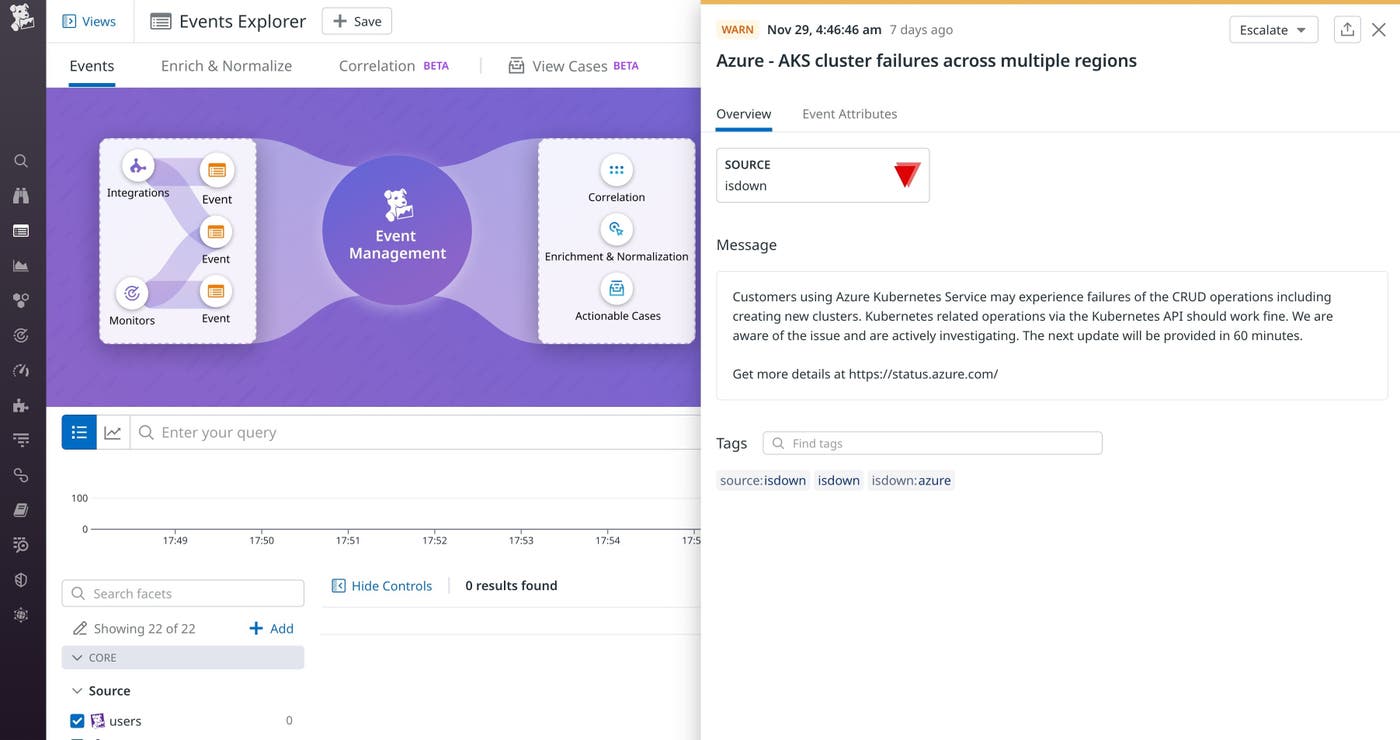
You can click an event to open it in Datadog Event Management and view more context, including a description of the outage. By enriching these events with tags, you can add service attribution, team attribution, and other key metadata that can help you investigate further and find the right stakeholders to loop in.
For example, let’s say your application is hosted on an Azure Kubernetes Service (AKS) cluster. During a quick look at the IsDown dashboard, you notice a new outage event indicating that Azure reported AKS cluster failures across multiple regions. You can click on this event to inspect it in the Events Explorer, and get a succinct description of what’s going on. In the following screenshot, we can see that the outage entails failures for CRUD operations on AKS, including the creation of new clusters. To learn more, we can open the Azure status homepage by clicking the included link.
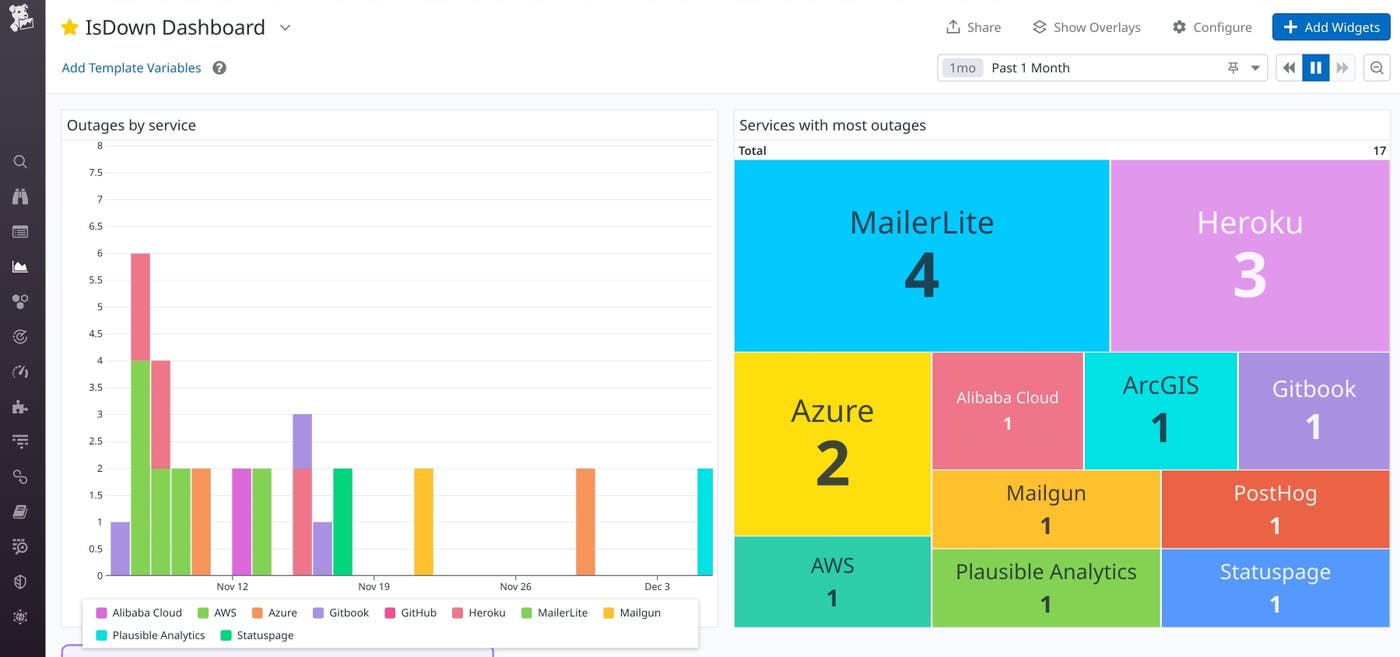
You can also add your own visualizations to customize the out-of-the-box dashboard to fit your own needs. For example, you could create widgets that visualize the number of outage events, broken down by provider, and map these outages on a timeline to show the overall trend for outages in a specified time span. This helps you quickly identify where to go to gather context about outages that may be affecting your systems.
Get immediately alerted to new outages
In addition to monitoring IsDown events using the dashboard, you can set up alerts for those events to automatically notify your team members when new outages begin or resolve. By integrating notifications from IsDown into the rest of your alerting, you can make it easier to distinguish whether a failure in your application is tied to a local issue or a third-party outage.
For example, let’s say your application includes a service that makes ChatGPT API calls to implement a conversational interface. In addition to your alerts on the service’s throughput, errors, latency, and infrastructure health, you create an alert for when a new IsDown event reports an OpenAI outage to Datadog. When you’re paged due to an increase in errors for this service, you look in your team’s alerts to find a related IsDown alert reporting an OpenAI outage. You can configure this alert to link to IsDown, so you can quickly pivot to learn more.
In the following screenshot, we can see that IsDown has aggregated details from OpenAI’s status page to provide a succinct timeline of their reporting on this issue. OpenAI has reported degraded performance on ChatGPT, and has limited the number of users that can log in while they work on a remediation. As a result of this, your service’s requests are being rejected.
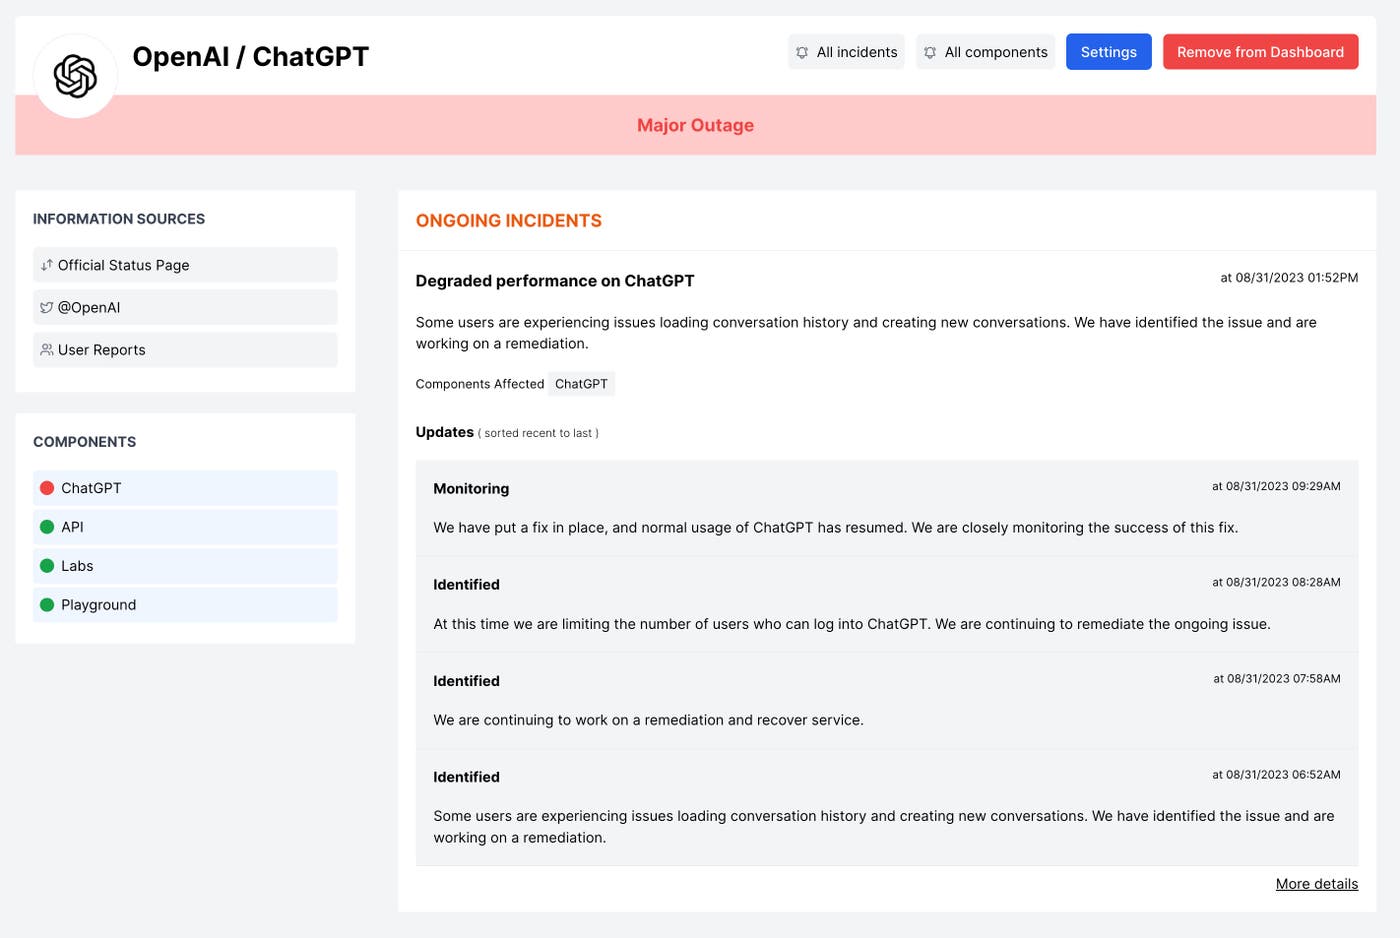
By gathering this context about the outage quickly, you can ensure that your customers are promptly informed of the issue and rally your team to fix it—mitigating the churn it could cause.
Know as soon as a dependency is down
By using IsDown with Datadog, you can easily access critical context about ongoing outages for your third-party service providers. Datadog’s best-of-breed dashboarding, alerting, and event management enable you to closely monitor the status of these dependencies, so you can act quickly when problems arise. To enable the integration, see the configuration instructions in our IsDown integration documentation. And to sign up for IsDown, start a 14-day free trial from the Datadog Marketplace page.
The ability to promote branded monitoring tools in the Datadog Marketplace is one of the benefits of membership in the Datadog Partner Network. You can learn more about the Datadog Marketplace in our blog post, and you can contact us at marketplace@datadog.com if you’re interested in developing an integration or application. And if you’re brand new to Datadog, get started with a free trial.

