Mallory Mooney
In Part 1 of this series, we discussed AWS Lambda functions and some key metrics for monitoring them. In this post, we’ll look at using Amazon’s native tooling to query those metrics. We’ll also show you how to collect logs and traces that provide further visibility into your Lambda functions.
Amazon provides built-in monitoring functionality through CloudWatch and X-Ray. CloudWatch collects logs, metrics, and events from Lambda and other AWS services, and provides dashboards and alarms for your data. AWS X-Ray is an application performance service that enables you to trace requests as they invoke Lambda functions, so you can pinpoint and troubleshoot bottlenecks in your application workflows.
In the next few sections, we will discuss getting started with CloudWatch and X-Ray to:
- analyze Lambda metrics and logs
- create alarms for Lambda metrics
- view and analyze traces
We’ll also look at how you can use the AWS Command Line Interface (CLI) to pull metric data. If you haven’t already installed the CLI, you can do so by following the steps in the documentation. Then you can configure the CLI settings for your account (e.g., AWS region, security credentials, and output format).
Analyze metrics and logs from your Lambda functions
AWS Lambda automatically collects metrics from your functions and sends them to CloudWatch—no configuration required. The CloudWatch console is the central hub for viewing data collected from all of your reporting AWS services. This is also where you can create dashboards and alarms for your services. The Lambda console is where you can manage your functions (e.g., create new functions, edit existing functions) and visualize metrics from your functions.
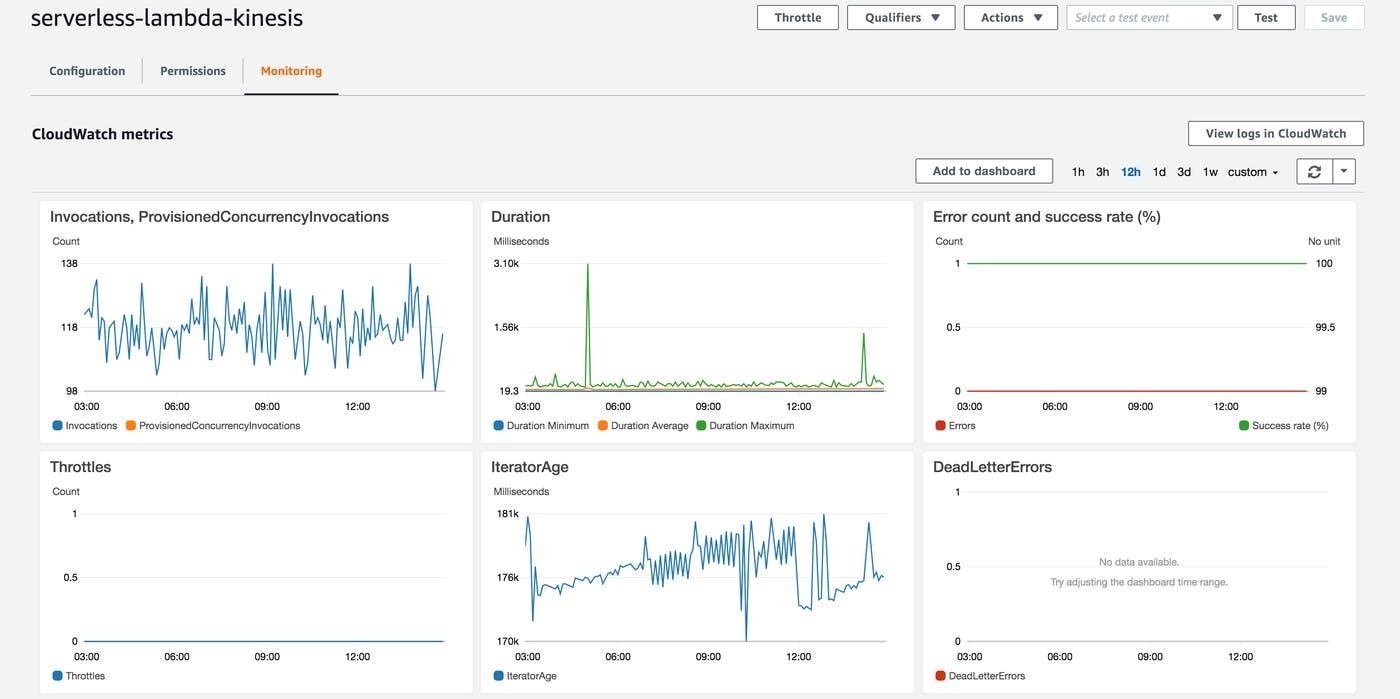
The dashboard in the Lambda console includes graph widgets for some of the Lambda metrics discussed in Part 1 (e.g., duration, errors, and throttles) by default. You can add these graph widgets to a new or existing dashboard by clicking on the Add to dashboard button near the top of the Lambda dashboard. This enables you to build dashboards for all of your Lambda metrics.
CloudWatch divides metrics by namespace (i.e., the AWS service) and then by dimension. Metric dimensions vary depending on the namespace and enable you to filter your metrics. For example, to add additional Lambda graph widgets to your dashboard, you would select the Lambda namespace and then drill down to specific metrics by using dimensions (e.g., the function name, resource, or function version).
To get even deeper insights into your functions, you can analyze and query function logs in order to visualize trends that you may not be able to see in Lambda metrics alone.
Analyze logs with CloudWatch
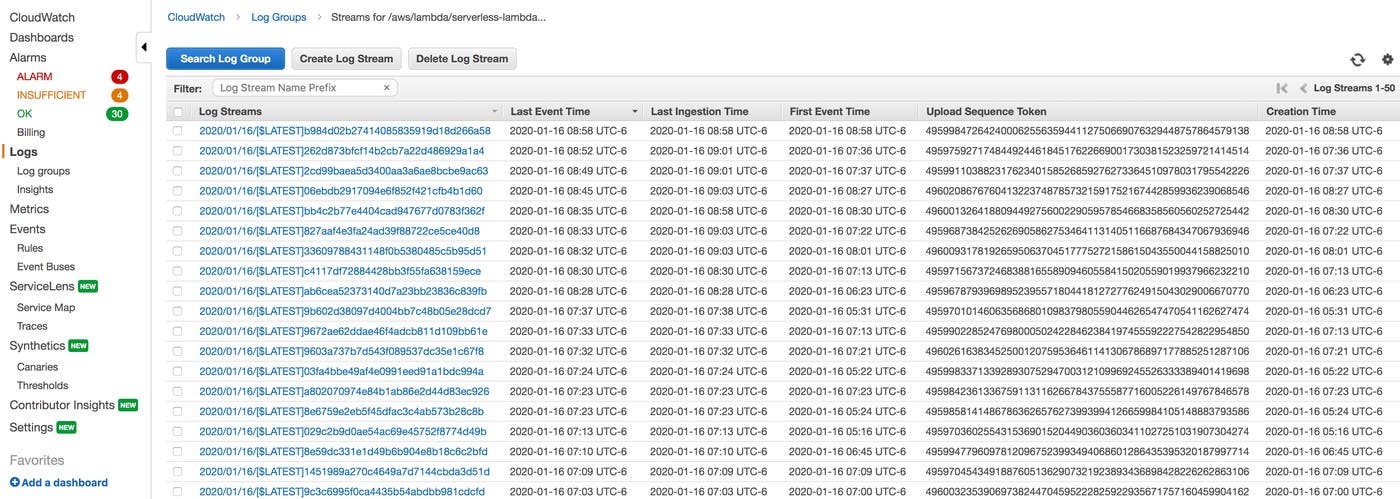
AWS Lambda automatically logs all requests processed by your functions and stores this data with CloudWatch Logs. If you want to view logs for your functions, you can click on View logs in CloudWatch from the Lambda console. This will redirect you to CloudWatch, where you can view a list of all log groups created by your function, create alarms, and get additional insights into your log data.
CloudWatch Logs Insights enables you to use query syntax to analyze trends in function activity. For example, you can use the following query to determine if you have overprovisioned memory for a function:
filter @type = "REPORT"| stats max(@memorySize / 1024 / 1024) as provisionedMemoryMB, min(@maxMemoryUsed / 1024 / 1024) as smallestMemoryRequestMB, avg(@maxMemoryUsed / 1024 / 1024) as avgMemoryUsedMB, max(@maxMemoryUsed / 1024 / 1024) as maxMemoryUsedMB, provisionedMemoryMB - maxMemoryUsedMB as overProvisionedMBThis query uses two log fields (@memorySize and @maxMemoryUsed) and statistical operators in order to calculate a custom overProvisionedMB value that tells you the difference between the memory size (provisioned memory) and maximum memory used. This query also includes additional fields (e.g., smallestMemoryRequestMB and avgMemoryUsedMB) to provide more context for your function’s memory usage. CloudWatch will automatically create a report that you can export to a dashboard.

In the example above, you can see that the serverless-lambda-kinesis function has 122 MB of provisioned memory but is only using an average of 60 MB for each invocation. With these types of queries, you can determine whether you can decrease the amount of allocated memory in order to reduce costs.
CloudWatch alarms
You can also create CloudWatch alarms to get notified of issues such as Lambda errors and overprovisioned functions. CloudWatch alarms send notifications to a Simple Notification Service (SNS) topic, which is used for email notifications.
Analyze and debug Lambda performance with AWS X-Ray
In addition to collecting Lambda metrics and logs, you can use AWS X-Ray to trace requests as they move through your applications, so you can identify bottlenecks in serverless workflows.
By default, X-Ray captures traces for the first request each second, and then samples 5 percent of any additional requests in the same time period. You can customize X-Ray’s sampling rules if you need more control over what is traced. Check out Amazon’s documentation for more information.
Keep in mind that you have to enable X-Ray for every function you want to trace, and AWS charges for additional traces outside of its free tier.
Once enabled, you can view a list of a function’s individual traces by clicking on the View traces in X-Ray button and then drill down to a trace map for a specific trace. The trace map shows the path of the request, including any services that were involved in fulfilling the request.
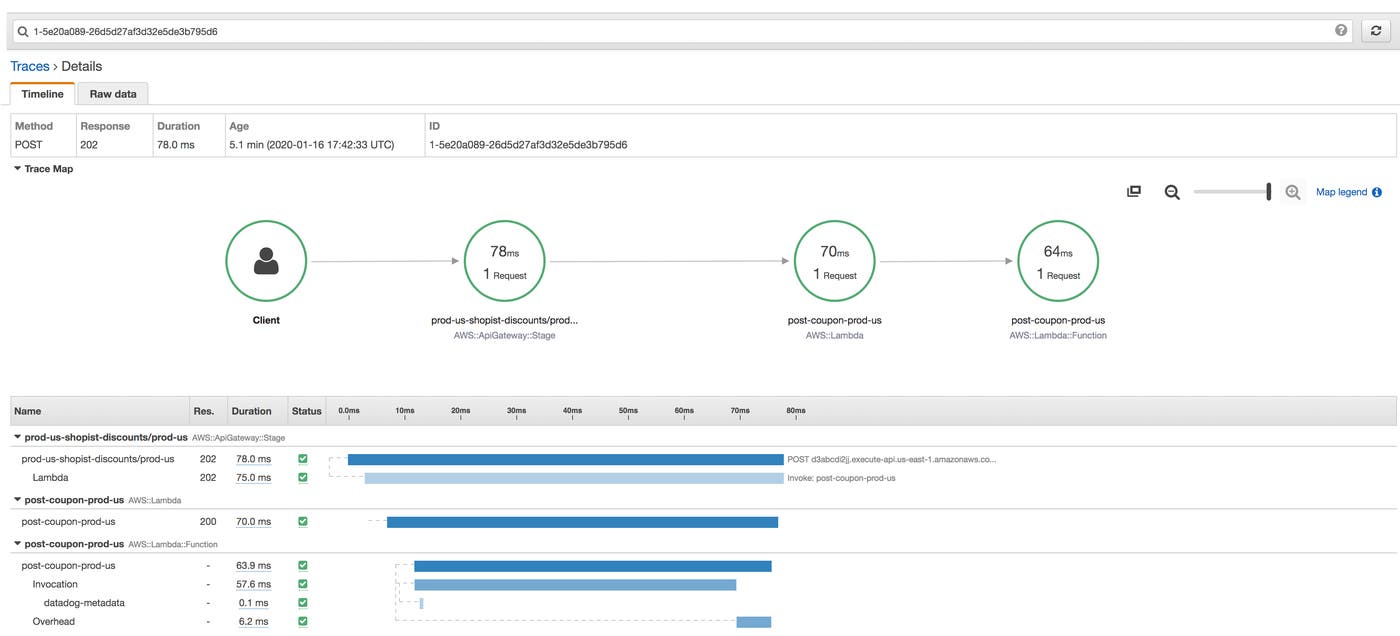
This enables you to view requests that are handled by your function as well as high-level performance metrics such as the error and request rate. You can read more about analyzing traces in Amazon’s documentation.
Retrieve information about functions with the AWS CLI
The AWS CLI enables you to retrieve information about your Lambda functions, including logs and metrics for any function you specify. Make sure you’ve installed the CLI locally and configured it before proceeding.
Through the CLI, you have access to your AWS services’ APIs, including the Lambda API. For example, you can retrieve a list of all of your functions with the following command:
aws lambda list-functionsYou can also view the amount of reserved concurrency configured for a function:
aws lambda get-function-concurrency --function-name <FUNCTION_NAME>CloudWatch also provides an API for retrieving metric data from Lambda and other AWS services. Monitoring platforms like Datadog can automatically query this API to retrieve metric data for your functions so you can correlate that data with other AWS services as well as the other technologies in your stack. In Part 3 of this series, we’ll look at how you can get deep visibility into metrics, logs, and traces from your Lambda functions—alongside all the other components of your environment—with Datadog.
Monitor every dimension of your data in one platform
Amazon CloudWatch and AWS X-Ray allow you to monitor applications built on the AWS platform. However, if your application also relies on services outside of AWS, then you will need to use a monitoring service that provides visibility into AWS and all your other application components in one place. Datadog’s AWS Lambda integration enables you to monitor all of the metrics covered in Part 1, plus logs and traces, so you can get full context when troubleshooting an issue. And, because Datadog integrates with more than 1,000 other technologies such as Amazon Step Functions and AWS CloudFront, you can easily monitor all your services in one platform. Learn more in Part 3 of this series or get started with a free 14-day trial.

