Mallory Mooney
AWS Lambda is a compute service that enables you to build serverless applications without the need to provision or maintain infrastructure resources (e.g., server capacity, network, security patches). AWS Lambda is event driven, meaning it triggers in response to events from other services, such as API calls from Amazon API Gateway or changes to a DynamoDB table. AWS Lambda can perform specific tasks within your existing architecture, including:
- automatically resizing images after they are uploaded to an Amazon S3 bucket
- serving as a cron job to schedule the startup or shutdown of EC2 instances with AWS CloudWatch Events
- creating AWS CloudTrail security policies for newly launched EC2 instances
- serving as a backend to process API requests and retrieve data from a data store like DynamoDB
AWS Lambda only runs serverless code—known as functions—when needed, which helps reduce costs as you no longer have to pay for idle servers. At the same time, serverless architectures also face new challenges for monitoring. Because AWS Lambda manages infrastructure resources for you, you won’t be able to capture typical system metrics such as CPU usage. Instead, Lambda reports the performance and efficiency of your functions as they are used.
To effectively monitor Lambda, you need to understand how your functions are used and the type of resources they need to run efficiently. As you monitor your serverless architecture, you should be mindful of how requests and other services interact with your functions as well as how your functions are configured to respond to requests. A burst of new requests, for instance, could throttle your function if it does not have enough concurrency to process that traffic. Or, errors from an upstream service could stop your function code from executing. A function will also experience longer execution times if it doesn’t have enough memory.
AWS charges based on the time it takes for a function to execute, how much memory is allocated to each function, and the number of requests for your function. This means that your costs could quickly increase if, for instance, a function makes a call to an API service experiencing service or network outages and has to wait for a response.
Lambda provides metrics that enable you to identify bottlenecks and errors as well as manage costs. In this post, we’ll discuss how you can monitor the efficiency of your Lambda code with metrics for the following:
This guide refers to metric categories from our Monitoring 101 series, which provides a framework for metric collection and alerting. We will also look at the data you can extract from Lambda logs and traces so you can get full visibility into your application and how your functions interact with other services in your stack.
Before we dive into what metrics we should monitor, let’s take a look at how Lambda works.
How AWS Lambda works
AWS Lambda functions invoke in response to events from other services. Each event is simply a JSON document that contains the data your function will process. When a service invokes a function for the first time, it initializes the function’s runtime and handler method. AWS Lambda supports a range of runtimes, so you can write functions in the programming language of your choice (e.g., Go, Python, Node.js) and execute them within the same environment. When a service passes an event to the function, the runtime will convert the service’s event into an object that the handler method can process and use to return an appropriate response.
For example, a GET request to Amazon API Gateway might create the following event:
{ "resource": "/helloworld", "path": "/helloworld", "httpMethod": "GET", "headers": null, "multiValueHeaders": null, "queryStringParameters": { "city": "Dallas", "name": "Maddie" }, "multiValueQueryStringParameters": { "city": ["Dallas"], "name": ["Maddie"] }, "pathParameters": null, "stageVariables": null}You could configure this event to automatically invoke a Lambda function, which generates a response like this:
{ "message": "Good day, Maddie of Dallas. Happy Monday!", "input": { "resource": "/loginwelcome", "path": "/loginwelcome", "httpMethod": "GET", "headers": null, "multiValueHeaders": null, "queryStringParameters": { "city": "Dallas", "name": "Maddie" }, "multiValueQueryStringParameters": { "city": ["Dallas"], "name": ["Maddie"] }, "pathParameters": null, "stageVariables": null, "requestContext": {} }}The Lambda function can be configured to send the response to a downstream service that creates custom welcome messages for users who log into an application. Lambda enables you to create application services that are easy to track, manage, and troubleshoot when an issue occurs. In the next few sections, we’ll dive into how Lambda manages requests.
Concurrency
The number of requests that your Lambda function serves at any given time is called concurrency. Lambda automatically scales your functions based on the number of incoming requests. When a service invokes a function for the first time, Lambda creates a new instance of the function to process the event. If the service invokes the function again, while it is still processing an event, Lambda creates another instance. This cycle continues until there are enough function instances to serve incoming requests, or the function reaches its concurrency limit and is throttled.
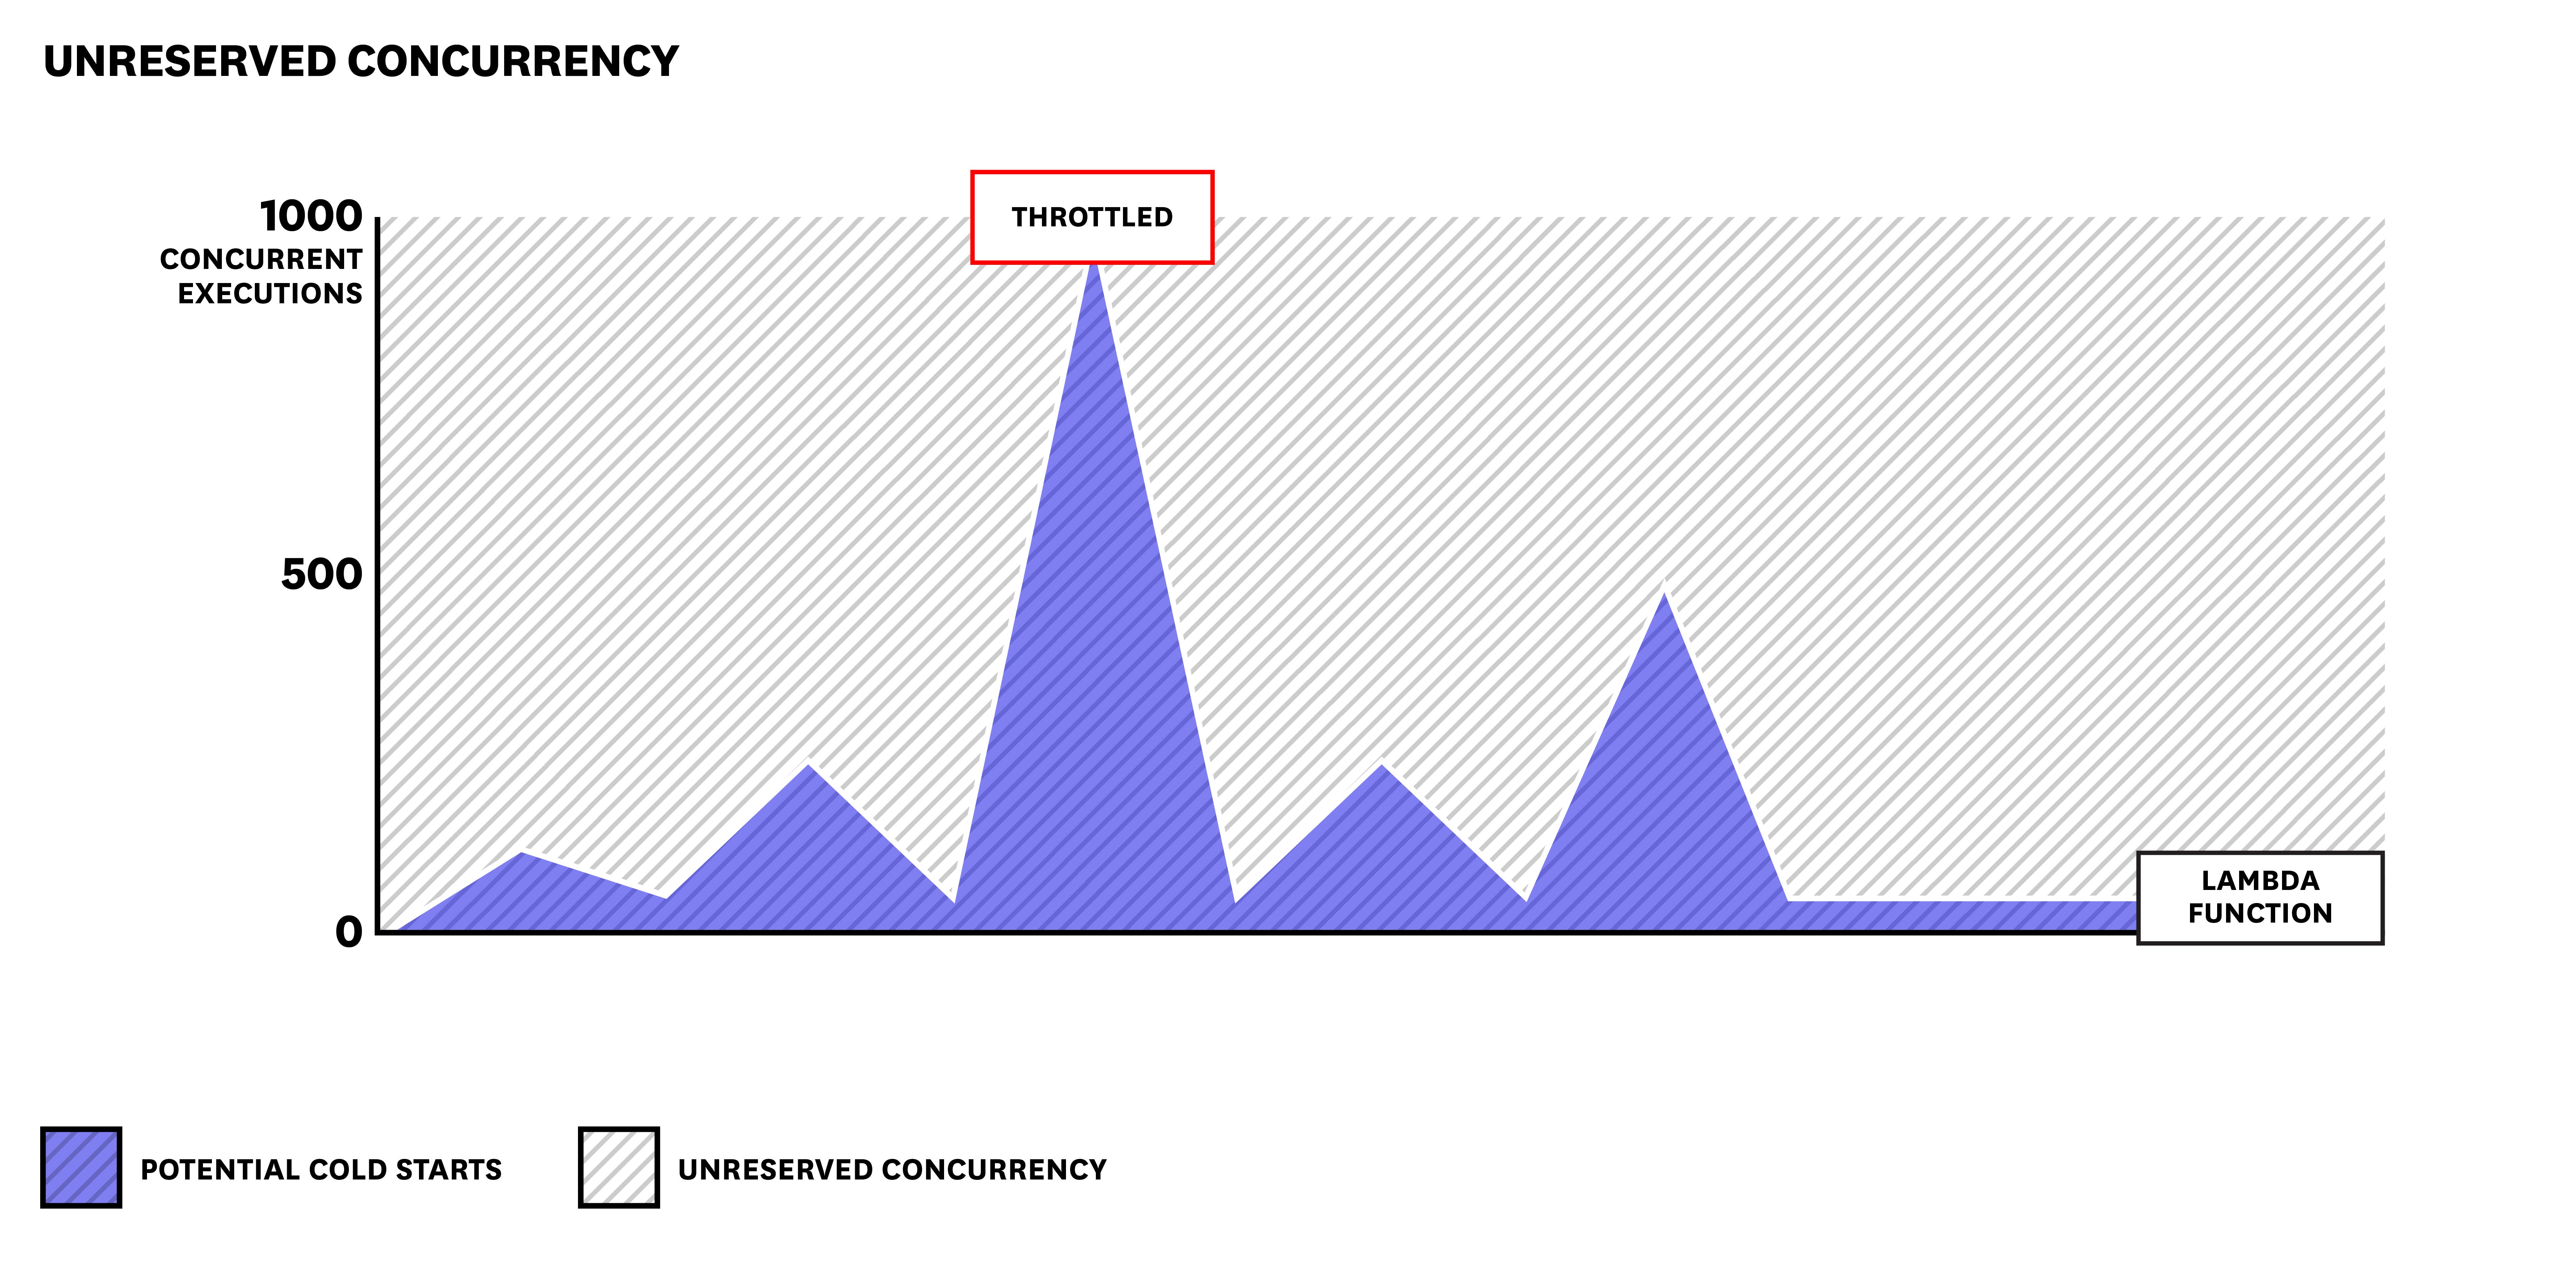
To manage the number of requests a function will be able to handle at a time, you can configure reserved or provisioned concurrency, which we’ll discuss in more detail in a later section.
Invocations
There are a few different ways to invoke Lambda functions for processing requests. Depending on the service that invokes your function, you may need to reserve a certain amount of concurrency in order to handle incoming requests. If one service typically handles more traffic than others, you can easily adjust the concurrency configuration (i.e., by reserving more concurrency for the frequently invoked function) in order to process incoming requests more efficiently.
You can invoke functions directly in the Lambda console or by using other AWS toolkits. Other AWS services can also invoke functions through a few different methods:
- synchronously
- asynchronously
- by streaming data that creates an event to invoke a function
Lambda provides different metrics for monitoring your invocations, depending on the method. We’ll look at these in more detail in a later section.
Key AWS Lambda metrics to monitor
There are many moving pieces with AWS Lambda—from the services that invoke your functions to how Lambda processes requests. Lambda emits metrics that enable you to monitor the efficiency of your code, as well as invocations and concurrency. Some of these metrics are automatically available through CloudWatch while others need to be extracted from Lambda logs. See the “Availability” column of each metric table below for details. You can view Lambda metrics in Amazon CloudWatch, which we will look at in more detail in the next part of this series, or in another monitoring platform like Datadog. In this section, we will look at metrics for:
- function utilization and performance
- invocations
- concurrency
- provisioned concurrency usage
Function utilization and performance metrics
Lambda automatically tracks utilization and performance metrics for your functions. Monitoring this data can help you optimize your functions and manage costs.
| Name | Description | Metric type | Availability |
|---|---|---|---|
| Duration | The elapsed time for a function’s execution, in milliseconds | Work: Performance | CloudWatch & Logs |
| Billed duration | Execution time billed in 1 ms increments, rounded up to the nearest millisecond | Work: Performance | Logs |
| Memory size | The amount of memory that is allocated to a function, in megabytes | Resource: Utilization | Logs |
| Max memory used | The maximum amount of memory used for an invocation, in megabytes | Resource: Utilization | Logs |
| Errors | The number of failed invocations due to function errors | Work: Error | CloudWatch |
You can find these metrics in your CloudWatch logs, as seen in the example log below:
REPORT RequestId: f1d3fc9a-4875-4c34-b280-a5fae40abcf9 Duration: 72.51 ms Billed Duration: 100 ms Memory Size: 128 MB Max Memory Used: 58 MB Init Duration: 2.04 msIn this section, we’ll discuss the key metrics for monitoring the efficiency of your Lambda functions. Though we won’t focus on the init duration metric, it’s important to understand what it measures: how long it took to initialize the Lambda function. If a function is consistently taking a long time to initialize (i.e., frequent cold starts), you can configure Lambda to reduce initialization latency by using provisioned concurrency.
Metrics to watch: duration and billed duration
Monitoring a function’s duration, or execution time, can help you manage costs and determine which functions can (or should) be optimized. Slow code execution could be the result of cold starts or code complexity. If your function relies on third-party services or other AWS services, factors such as network latency could also affect execution time. Lambda also limits how long a function can run (15 minutes) before it will terminate the function and throw a timeout error. Monitoring duration helps you see when you are about to reach this execution threshold.
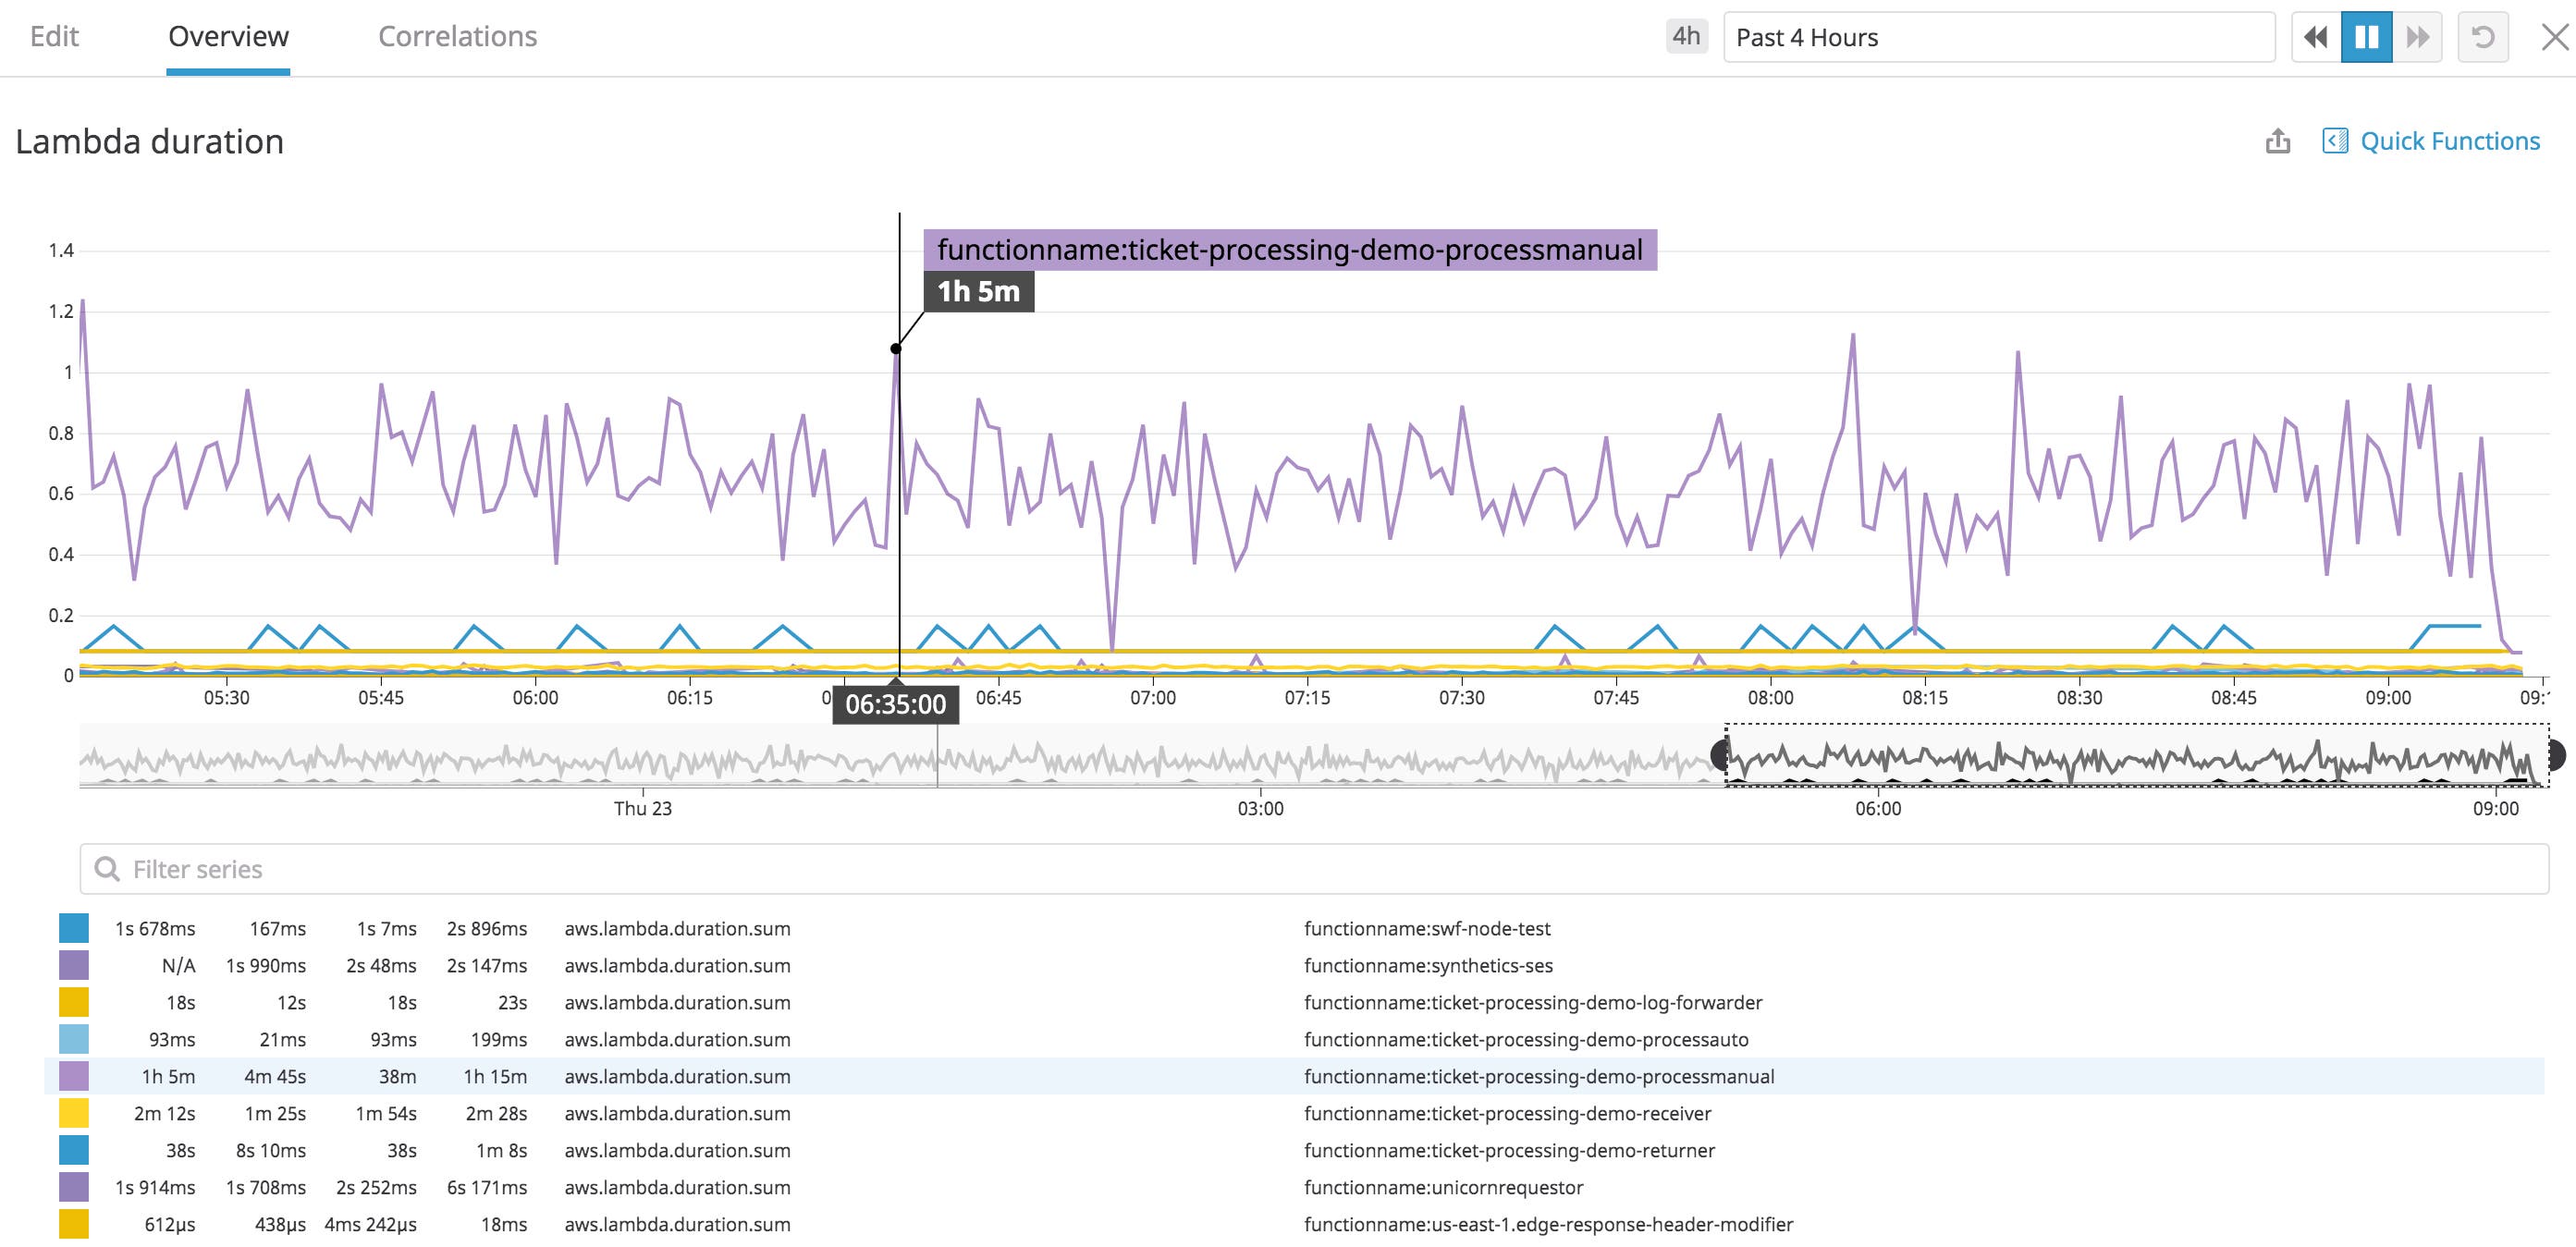
While duration measures the execution time of each invocation of the function, the billed duration (i.e., what you pay for) reflects the execution time rounded up to the nearest 1 ms. AWS Lambda pricing is based on the billed duration and the function’s memory size.
Monitoring the billed duration can help you optimize your functions and track overall costs for running them. For instance, let’s look at this function’s log:
REPORT RequestId: f1d3fc9a-4875-4c34-b280-a5fae40abcf9 Duration: 102.25 ms Billed Duration: 103 ms Memory Size: 128 MB Max Memory Used: 58 MB Init Duration: 2.04 msIn this case, the function’s duration was 102.25 ms, the billed duration was 103 ms, and the allocated memory was 128 MB. You can cross-reference this information with your function’s architecture (e.g., x86 or Arm) to determine what AWS will charge based on its pricing model. If you notice that the duration has been consistent (e.g., around 102 ms), you may be able to add more memory in order to decrease the duration (and the resulting billed duration) going forward.
Though we used a simple example, monitoring these two metrics can help you manage costs, especially if you are managing large volumes of requests across hundreds of functions. Later in this series, we’ll show you how to use Datadog’s Lambda Layer to collect this data at even higher granularity than CloudWatch.
Metrics to watch: memory size and max memory used
Though Lambda limits how much computing power a function has, you can allot memory for your function, or the memory size, within AWS Lambda limits. Memory usage is important to monitor because a function’s duration (and billed duration) is partially affected by how much memory it has—not enough memory results in slower execution times. On the other hand, you may have allocated more memory than needed. Both scenarios affect costs, so monitoring memory usage helps you strike a balance between processing power and execution time.
You can look at this data in your CloudWatch logs, as seen below:
REPORT RequestId: f1d3fc9a-4875-4c34-b280-a5fae40abcf9 Duration: 20.21 ms Billed Duration: 100 ms Memory Size: 512 MB Max Memory Used: 58 MB Init Duration: 2.04 msYou can see that the function uses (max memory used) only a fraction of the available memory. If you notice this happening consistently, you may want to adjust the amount of memory allocated to the function to reduce costs.
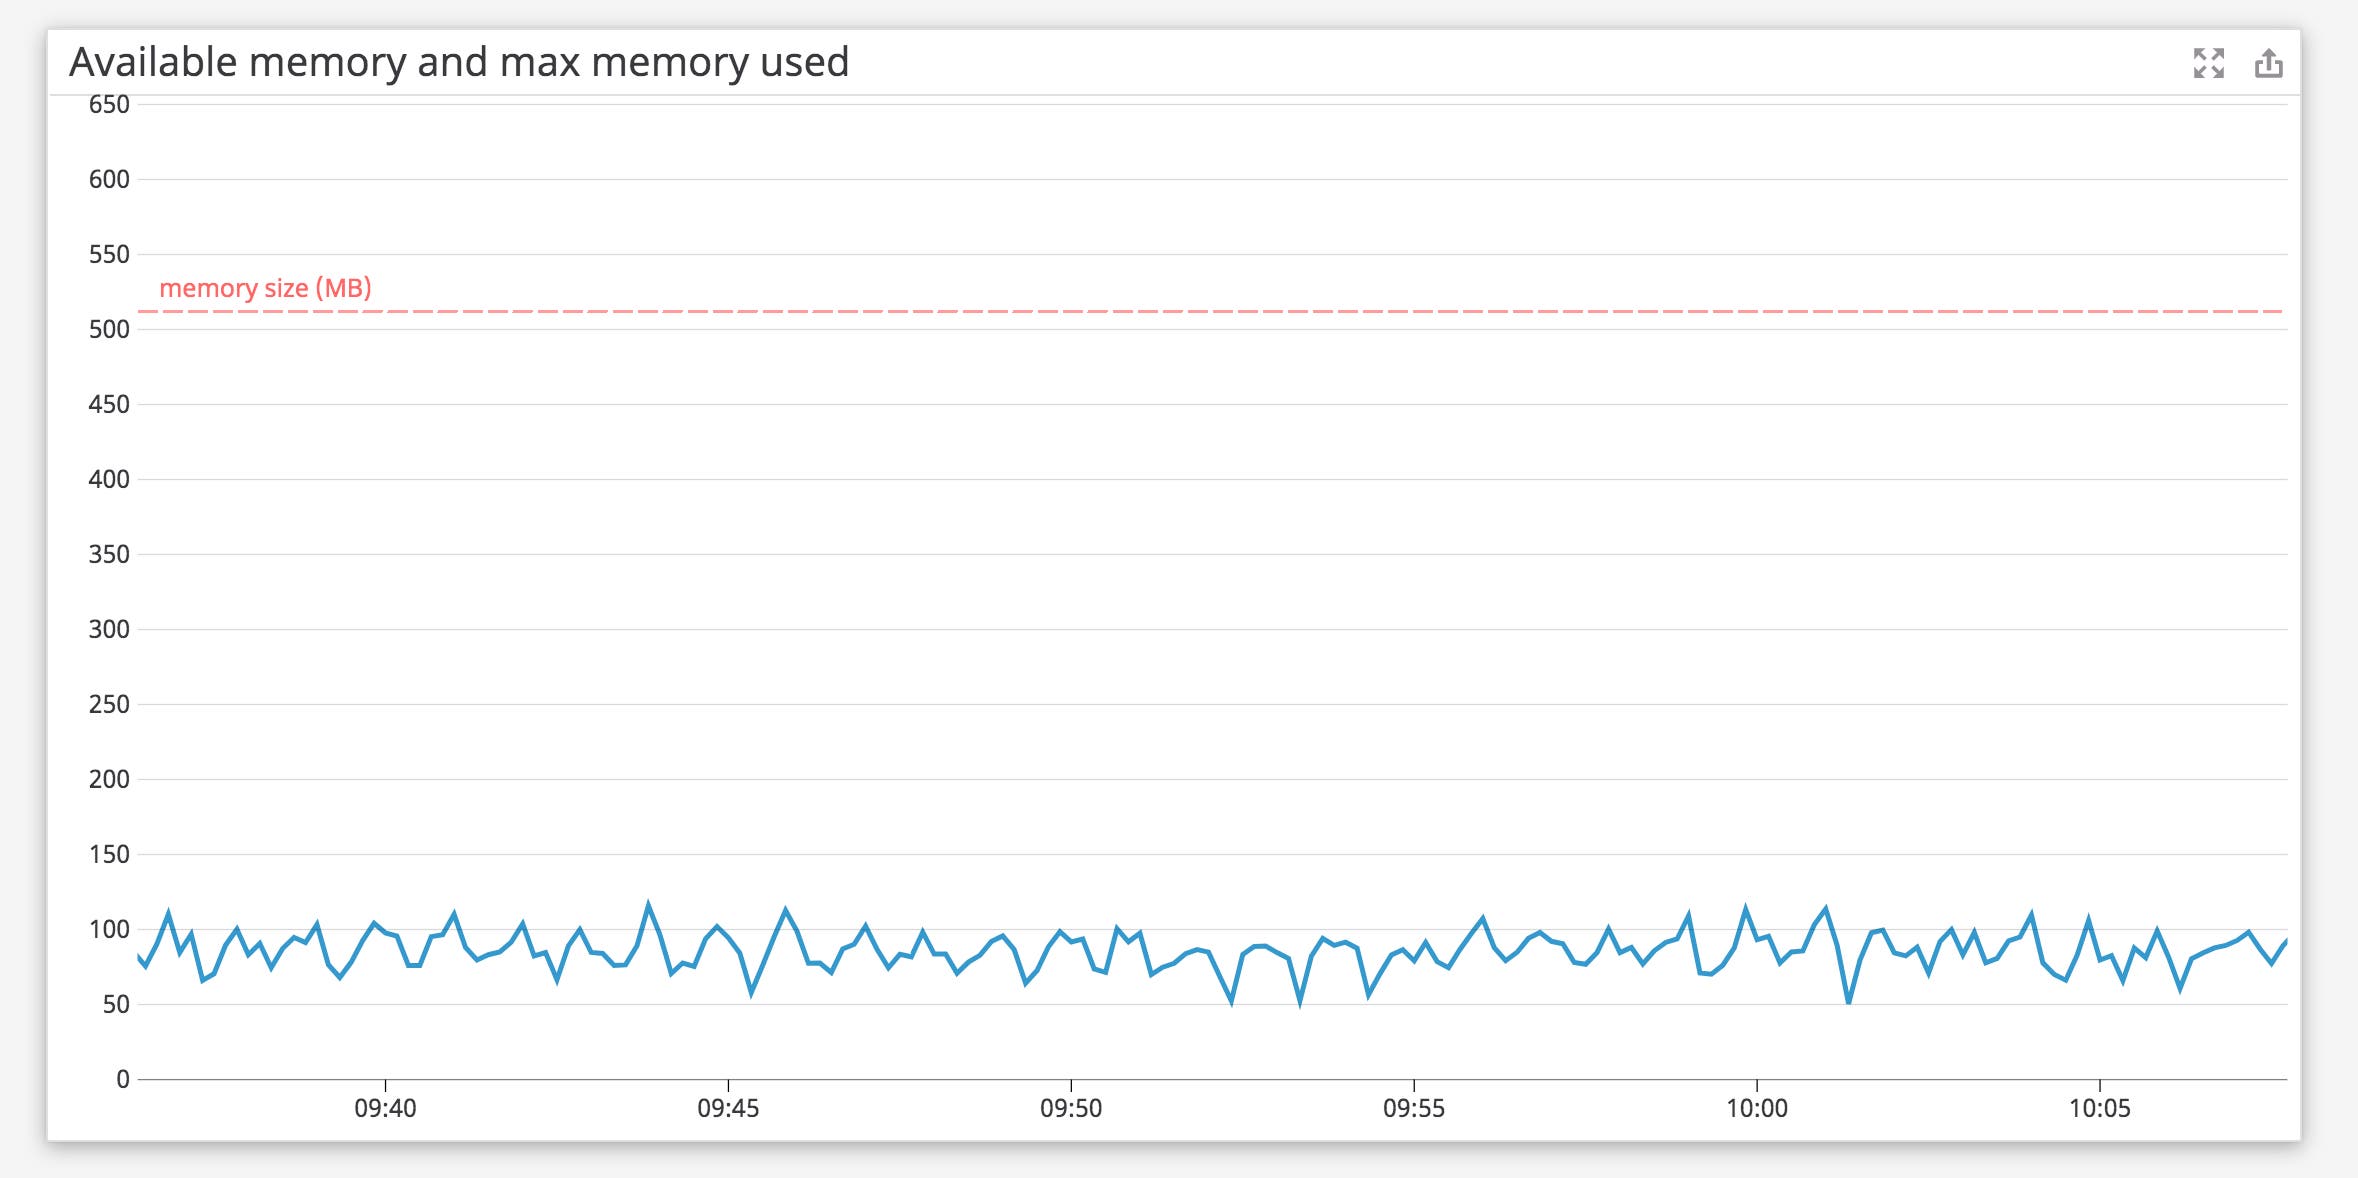
Or, if you see that the execution time for a function is taking longer than expected, it could indicate that there isn’t enough available memory for the function to process the request; the function’s memory usage will consistently reach its memory size.
Metric to watch: errors
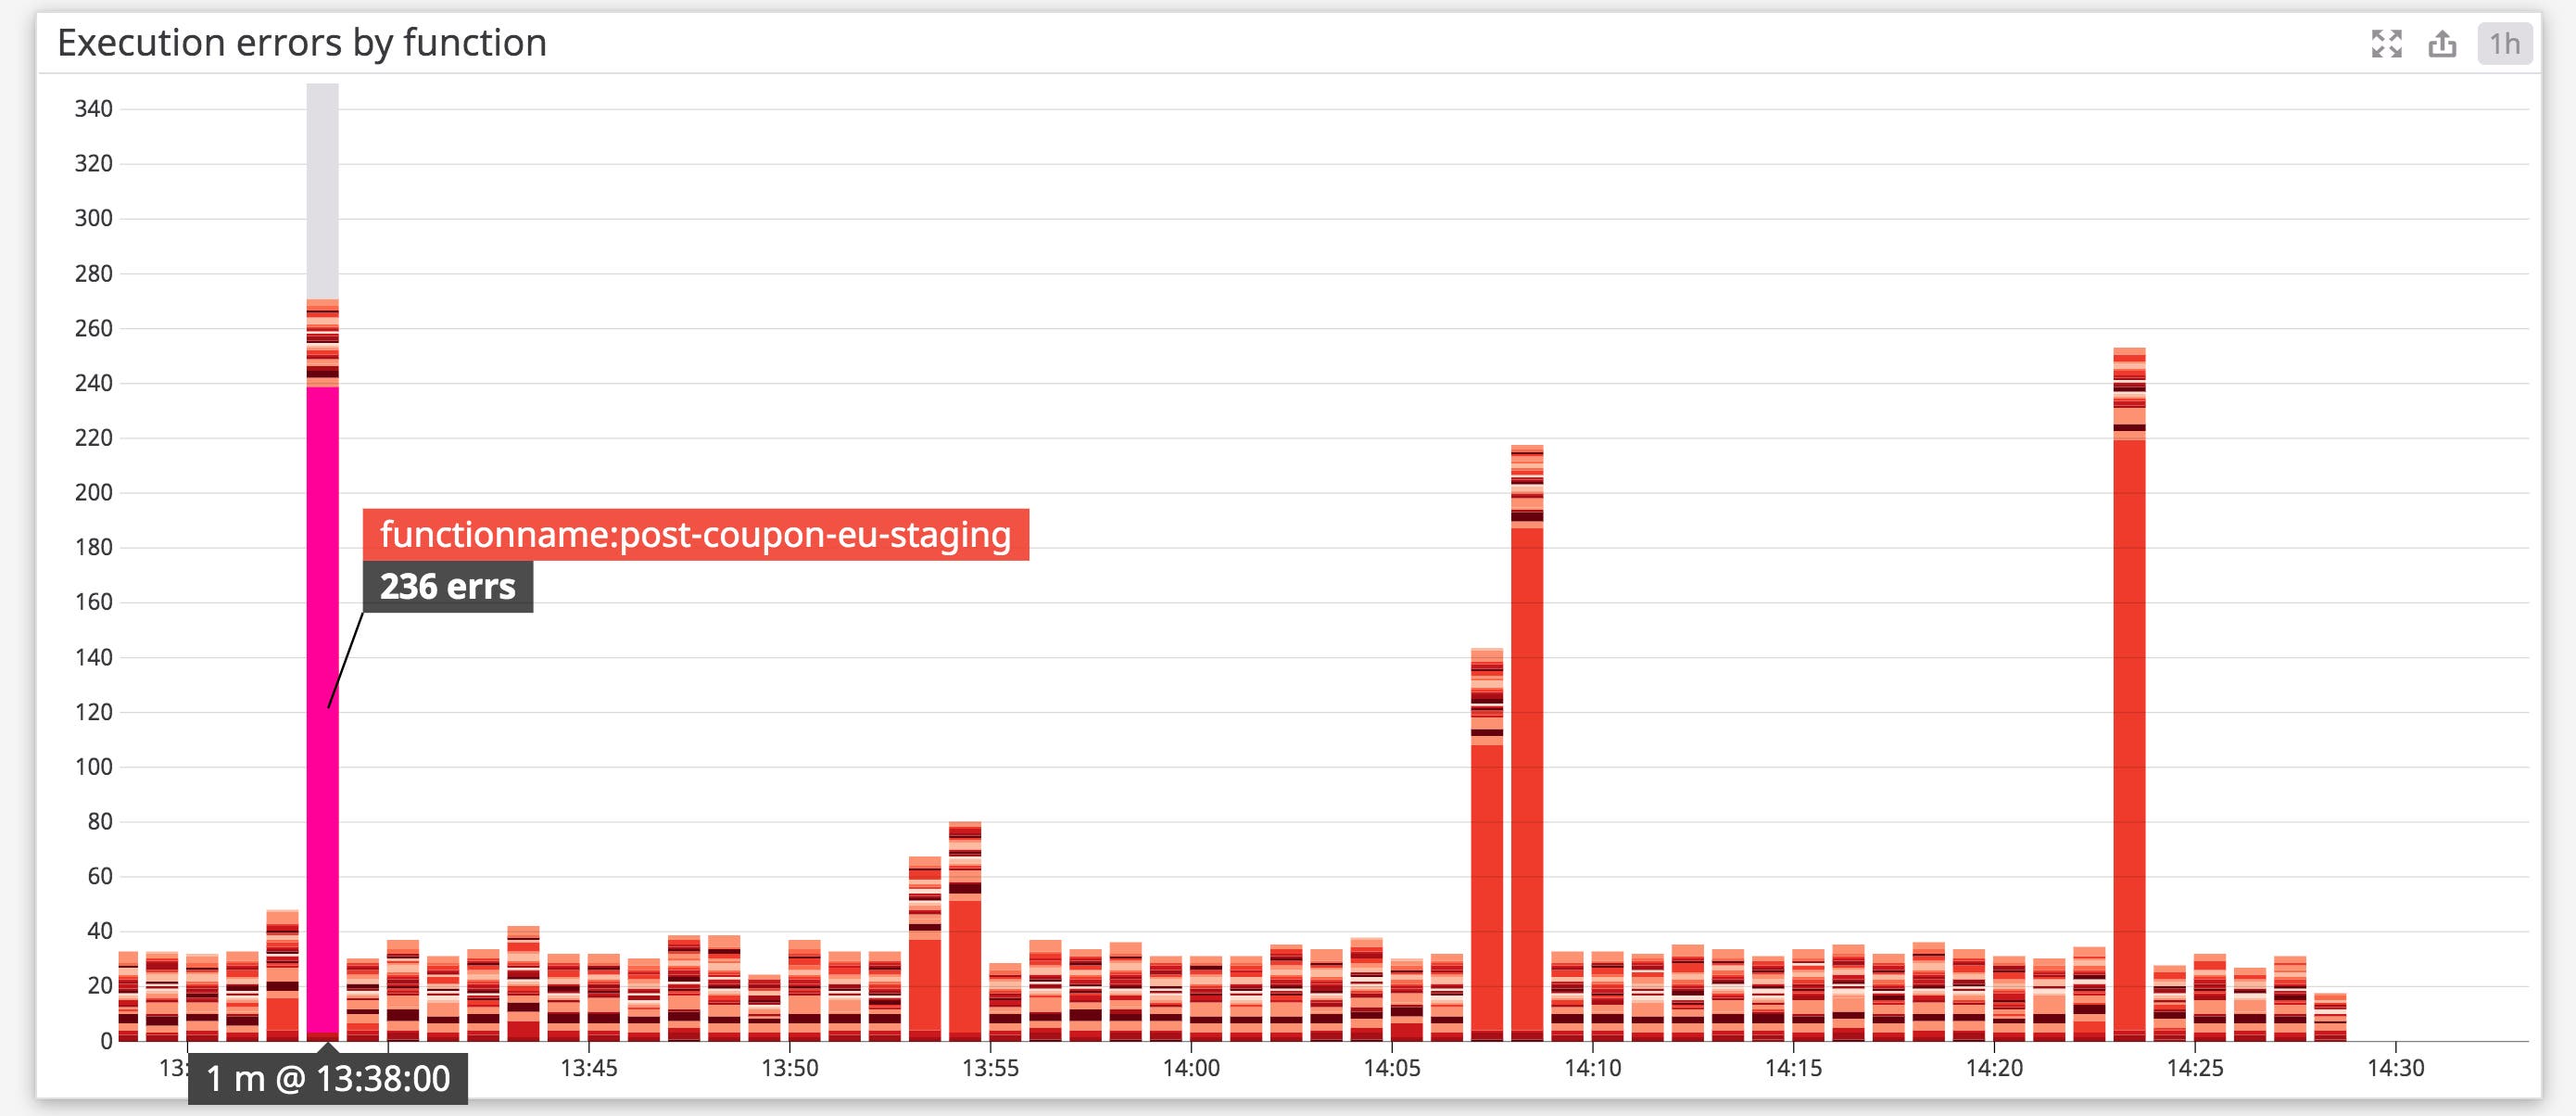
There are two types of errors that can occur with Lambda: invocation and function. Invocation errors can include when a service doesn’t have the appropriate permissions to invoke the function or if you hit the concurrent execution limit for your account. Function errors can occur when there are issues with your code (e.g., throwing an exception, syntax issues) or if a function times out. Lambda’s error metric counts the number of invocations that failed due to function errors. The metric doesn’t include invocation errors or internal service errors from other AWS services.
If your application relies on several Lambda functions, monitoring error counts can help you pinpoint which functions are causing the problem.
In addition to monitoring function performance, it’s important to monitor concurrency and how other services are invoking functions. Lambda provides different metrics for managing invocations and concurrency, which we will explore in further detail below.
Invocation metrics
As mentioned earlier, you can invoke a function synchronously, asynchronously, or via a stream. Depending on the invocation method, you may have different metrics to monitor. We’ll take a look at each type next.
Synchronously
Services that synchronously invoke Lambda functions include AWS ELB, Amazon API Gateway, and Amazon Alexa. These services create the event, which Lambda passes directly to a function and waits for the function to execute before passing the result back to the service. This is useful if you need the results of a function before moving on to the next step in the application workflow.
If an error occurs, the AWS service that originally sent Lambda the event will retry the invocation.
Asynchronously
AWS services that can invoke functions asynchronously include Amazon Simple Email Service (SES), Amazon Simple Notification Service (SNS), or Amazon S3. These services will invoke Lambda and immediately hand off the event for Lambda to add to a queue. As soon as an event is queued, the service receives a response that the event was added to the queue successfully. Asynchronous invocations can help decrease wait times for a service because it doesn’t need to wait for Lambda to finish processing a request—instead, it can move on to the next request as soon as it receives confirmation that Lambda has queued the event.
Once an event is queued, Lambda handles the rest. If a function returns an error—as a result of a timeout or an issue in the function code—Lambda will retry processing the event up to two times before discarding it. Lambda may also return events to the queue—and throw an error—if the function doesn’t have enough concurrency to process them.
You can configure Lambda to send discarded events to a dead-letter queue (DLQ) in order to analyze the cause of the failure. AWS enables you to choose between two types of dead-letter queues: Amazon SQS or SNS. The SQS queue will hold the discarded events until you retrieve them while the SNS queue will send the failed event to a destination such as an email address. You can learn more about these queues in Amazon’s documentation.
Event source mapping
You can also use event source mapping to configure an AWS service, such as Amazon Kinesis or DynamoDB, to create a data stream or queue that serves as a trigger for a Lambda function. The event source mapping in Lambda will read batches of events, or records, from the shards in a stream and then send those batches (referred to as the event batches) to the function for processing.
By default, if a function returns an error and cannot process the batch, it will retry the batch until it is successful or records in the batch expire. You can configure the number of retry attempts and the maximum age of a record in a batch. This ensures that a function doesn’t stall when processing records.
Whether you are invoking your Lambda functions synchronously, asynchronously, or via a data stream or queue, Lambda generates metrics and logs to help you monitor all of your invocations in real time. Lambda emits standard metrics such as invocation count, errors, and throttles for all of your functions, regardless of invocation type.
Lambda also generates different metrics depending on the invocation type and how a function handles errors. For example, you can monitor the age of batched records for stream-based invocations and when a discarded event is not added to a dead-letter queue. And, when you correlate these metrics with Lambda logs, you get a complete picture of an issue.
| Name | Description | Metric type | Availability |
|---|---|---|---|
| Iterator age | The age of the last record for each batch of processed records for a stream, in milliseconds | Work: Performance | CloudWatch |
| Invocations | The number of times a function was invoked by either an API call or an event response from another AWS service | Work: Throughput | CloudWatch |
| Dead-letter errors | The number of times Lambda was not able to send an event to a function’s dead-letter queue | Work: Error | CloudWatch |
Metric to alert on: iterator age
Lambda emits the iterator age metric for stream-based invocations. The iterator age is the time between when the last record in a batch was written to a stream (e.g., Kinesis, DynamoDB) and when Lambda received the batch. This metric lets you know when the amount of data that is being written to a stream is too much for a function to process; if you see it increase, it means the function is taking too long to process a batch of data and your application is building a large backlog of unprocessed events.
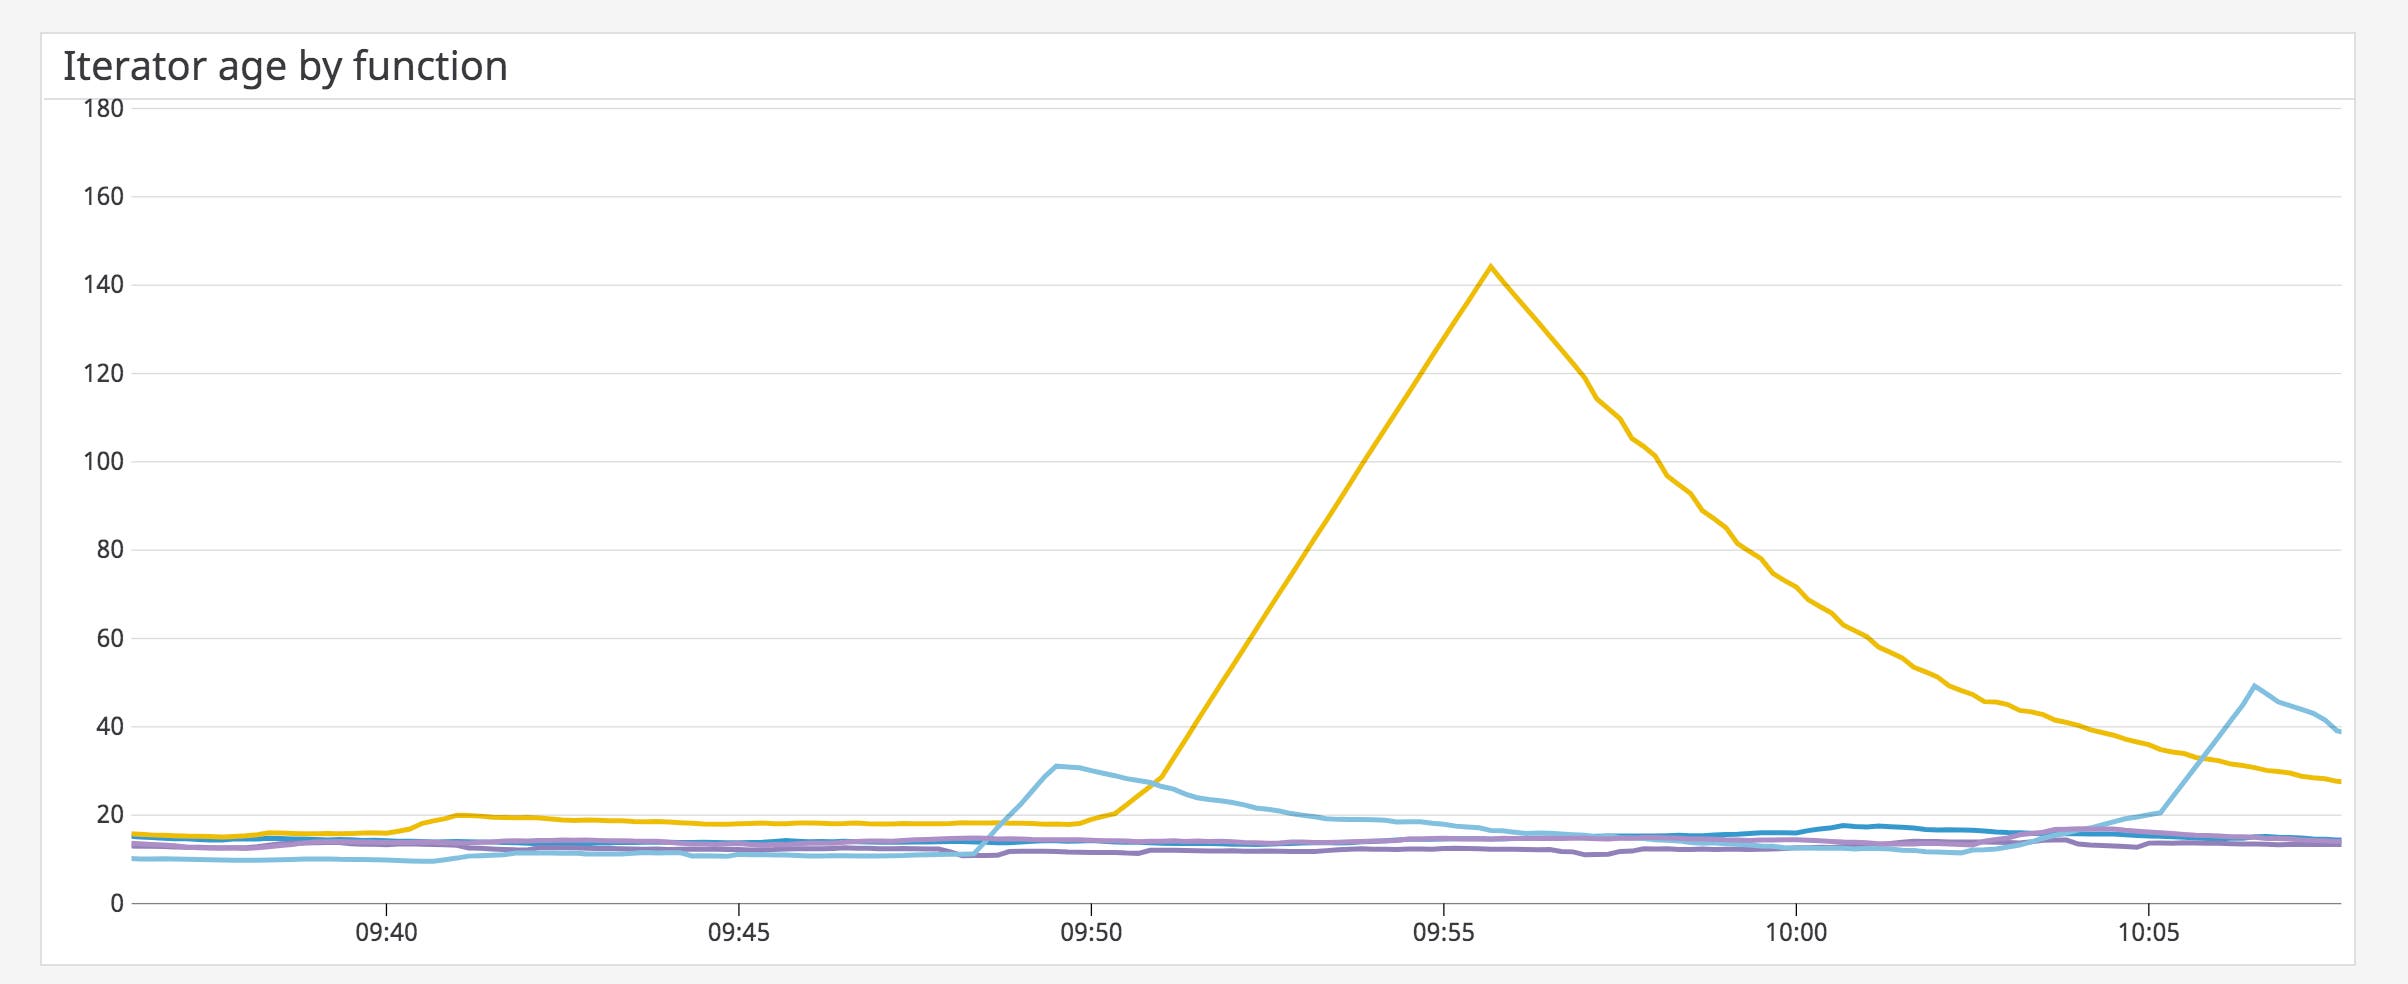
There are a few scenarios that could increase the iterator age:
- a high execution duration for a function
- not enough shards in a stream
- invocation errors
- insufficient batch size
To decrease the iterator age, you need to decrease the time it takes for a function to process records in a batch. Long durations could result from not having enough memory for the function to operate efficiently. You can allocate more memory to the function or find ways to optimize your function code.
If your function has adequate memory, then there may not be enough shards in the stream to manage the volume of incoming records. You can increase the number of shards in a stream to increase concurrency, enabling your function to process more requests at any given time.
Adjusting a stream’s batch size can also help decrease the iterator age in some cases. The batch size determines the maximum number of records that can be batched for processing. If a batch consists of mostly downstream calls, increasing the batch size allows functions to process more records in a single invocation, increasing throughput. However, if a batch contains records that require additional processing, then you may need to reduce the batch size to avoid stalled shards. Keep in mind that the actual batch size may still be smaller than what you specify for your function. For example, Lambda has an invocation payload limit of 6 MB. If records are large in size, then fewer records can be added to a batch.
Since Lambda processes batches as soon as there is at least one record in a batch, you can add a batch window to specify how long Lambda should wait before processing one (up to five minutes). This can be helpful if you want to ensure a batch has a certain number of records before being processed—providing that you do not exceed Lambda’s payload limit.
Invocation errors—which you can track in Lambda’s logs—can impact the time it takes for a function to process an event. If a batch of records consistently generates an error, the function cannot continue to the next batch, which increases the iterator age. Invocation errors may indicate issues with a stream accessing the function (e.g., incorrect permissions) or exceeding Lambda’s concurrent execution limit. After a function has exhausted its retry limit, you can send all failed events to a failure destination (such as an Amazon SNS topic or Amazon SQS queue), which allows Lambda to retry processing up to three additional times before sending the failed events to a dead-letter queue if one is available.
Sending records to wait in a separate topic or queue is useful if a downstream service is not available when Lambda processes the records. This enables Lambda to temporarily filter affected records out of a batch quickly so it can move on to process others. Once a failed event reaches a dead-letter queue, you can look at related logs to view the cause of the failure.
Metric to watch: invocations
Monitoring the number of invocations can help you understand application activity and how your functions are performing overall. If your functions are located in multiple regions, you can use the invocation count to determine if functions are used efficiently. For example, you can quickly see which function is invoked most frequently and evaluate if you need to move resources or modify load balancing in order to improve latency. Services like Lambda@Edge can automatically run your code in regions that are closer to your customers, improving latency.
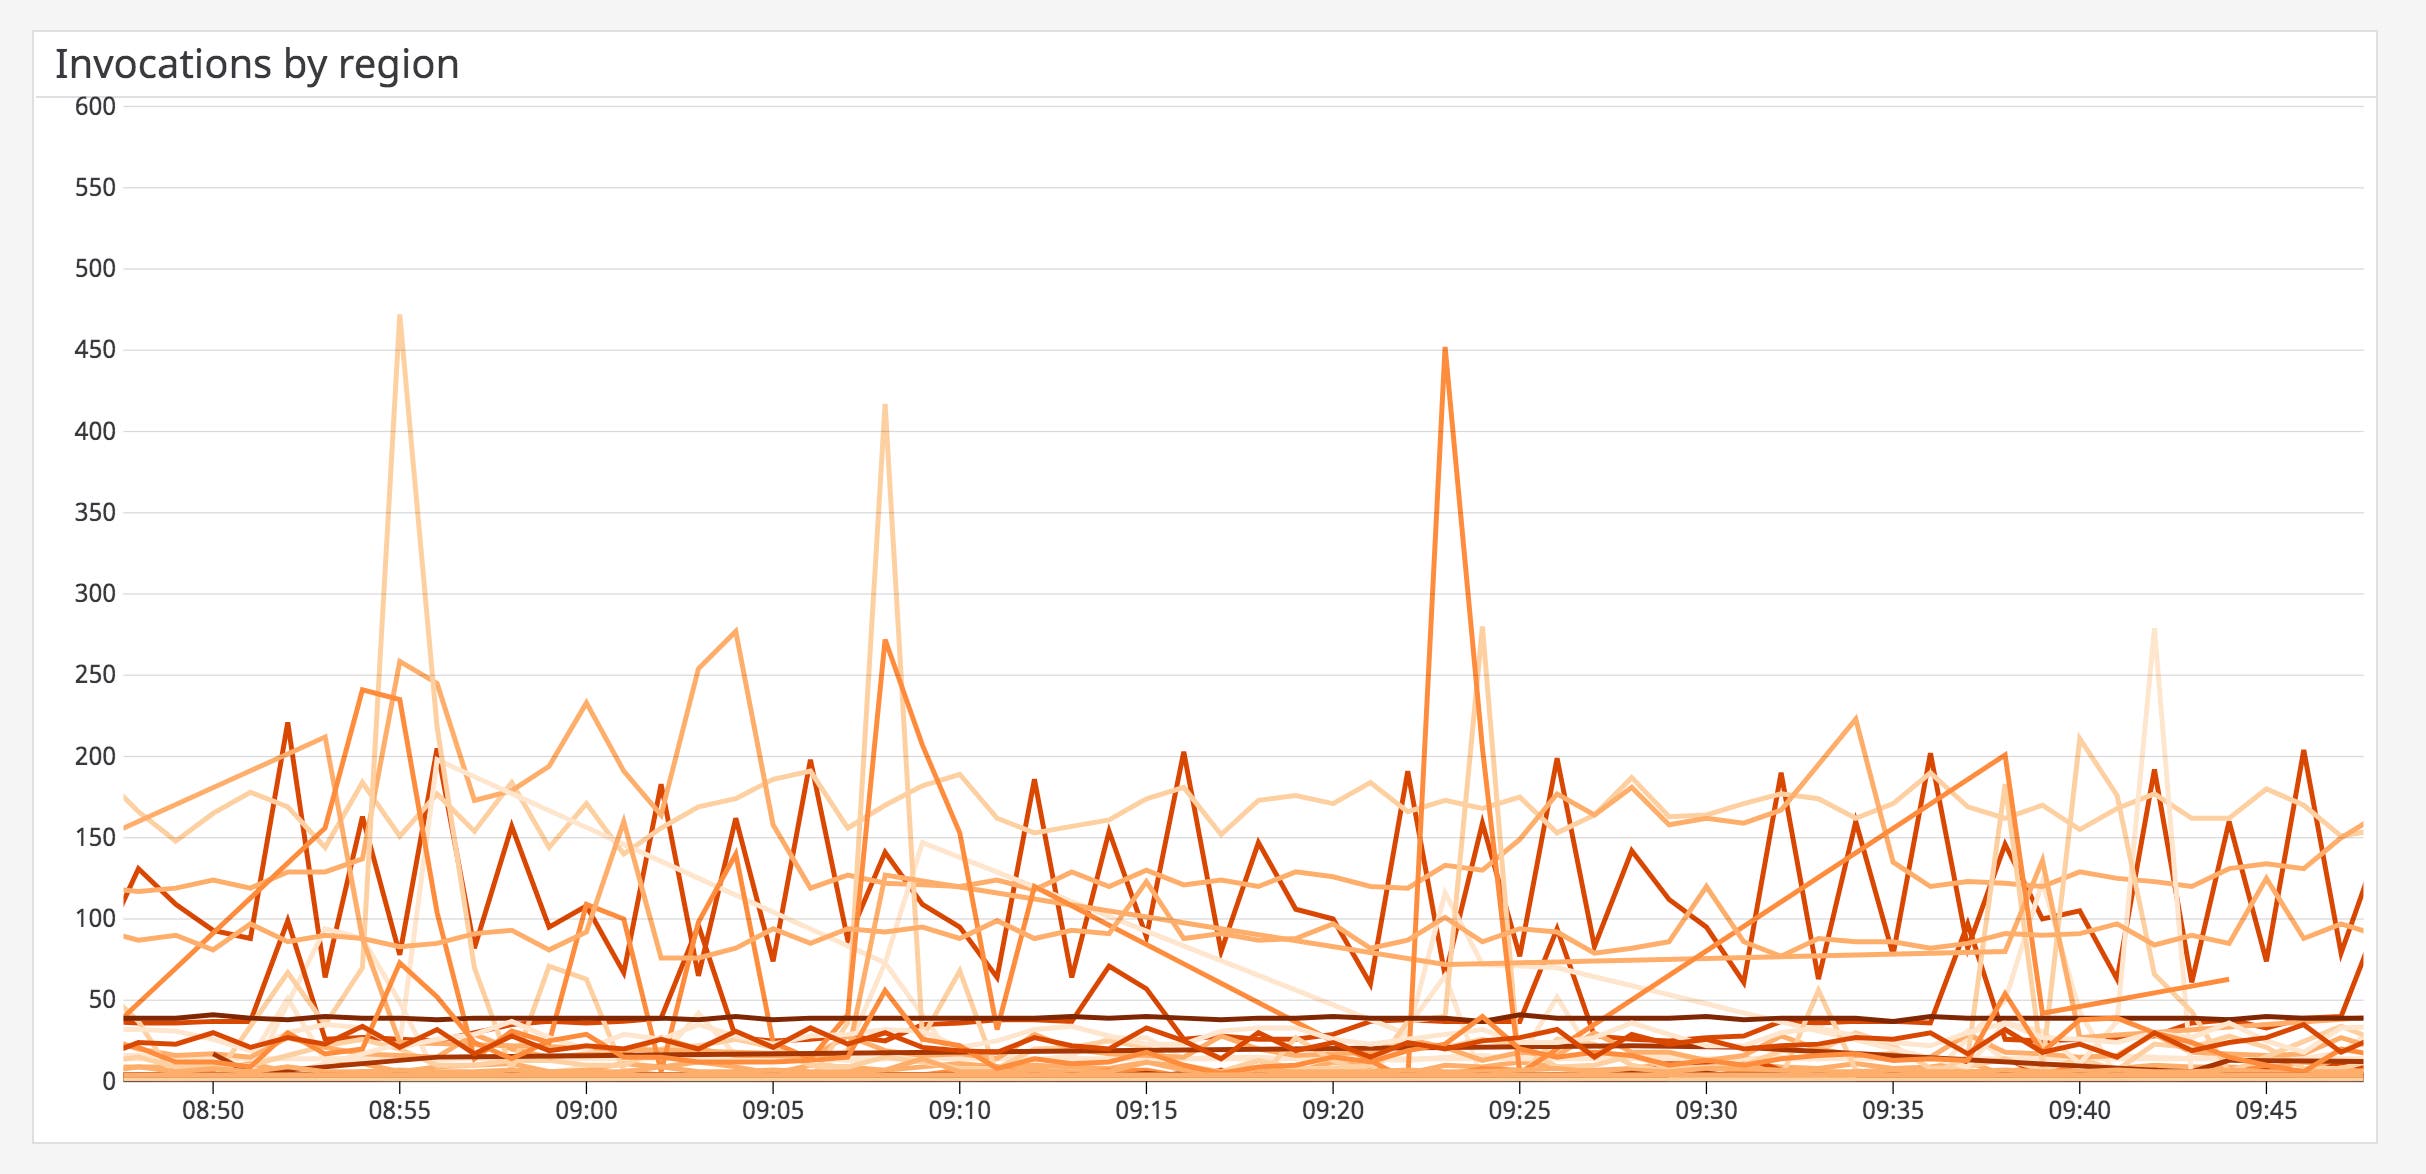
A sudden drop in invocations could indicate either an issue with the function or a connected AWS service. You can correlate this drop with other datapoints such as Lambda logs to troubleshoot further.
Metric to watch: dead-letter errors
Functions that are invoked asynchronously or from event source mapping use a dead-letter queue (DLQ) to handle discarded events: events that could not be processed and that were unsuccessfully retried. The dead-letter errors metric tracks how many times Lambda could not send an event to the dead-letter queue. If you notice an increase in this metric, there may be an issue with your function’s permissions, or a downstream service could be throttled.
Concurrency metrics
Monitoring concurrency can help you manage overprovisioned functions and scale your functions to support the flow of application traffic. By default, Lambda provides a pool of 1,000 concurrent executions per region, which are shared by all of your functions in that region.
Lambda also requires the per-region concurrency pool to always have at least 100 available concurrent executions for all of your functions at all times.
Functions can automatically scale instances to manage bursts of traffic, though there is a limit on how many requests can be served during an initial burst. Once that limit is reached, functions will scale at a rate of 500 instances per minute until they exhaust all available concurrency. This can come from the per-region 1,000 concurrent executions limit or a function’s reserved concurrency (the portion of the available pool of concurrent executions that you allocate to one or more functions). You can configure reserved concurrency to ensure that functions have enough concurrency to scale—or that they don’t scale out of control and hog the concurrency pool.
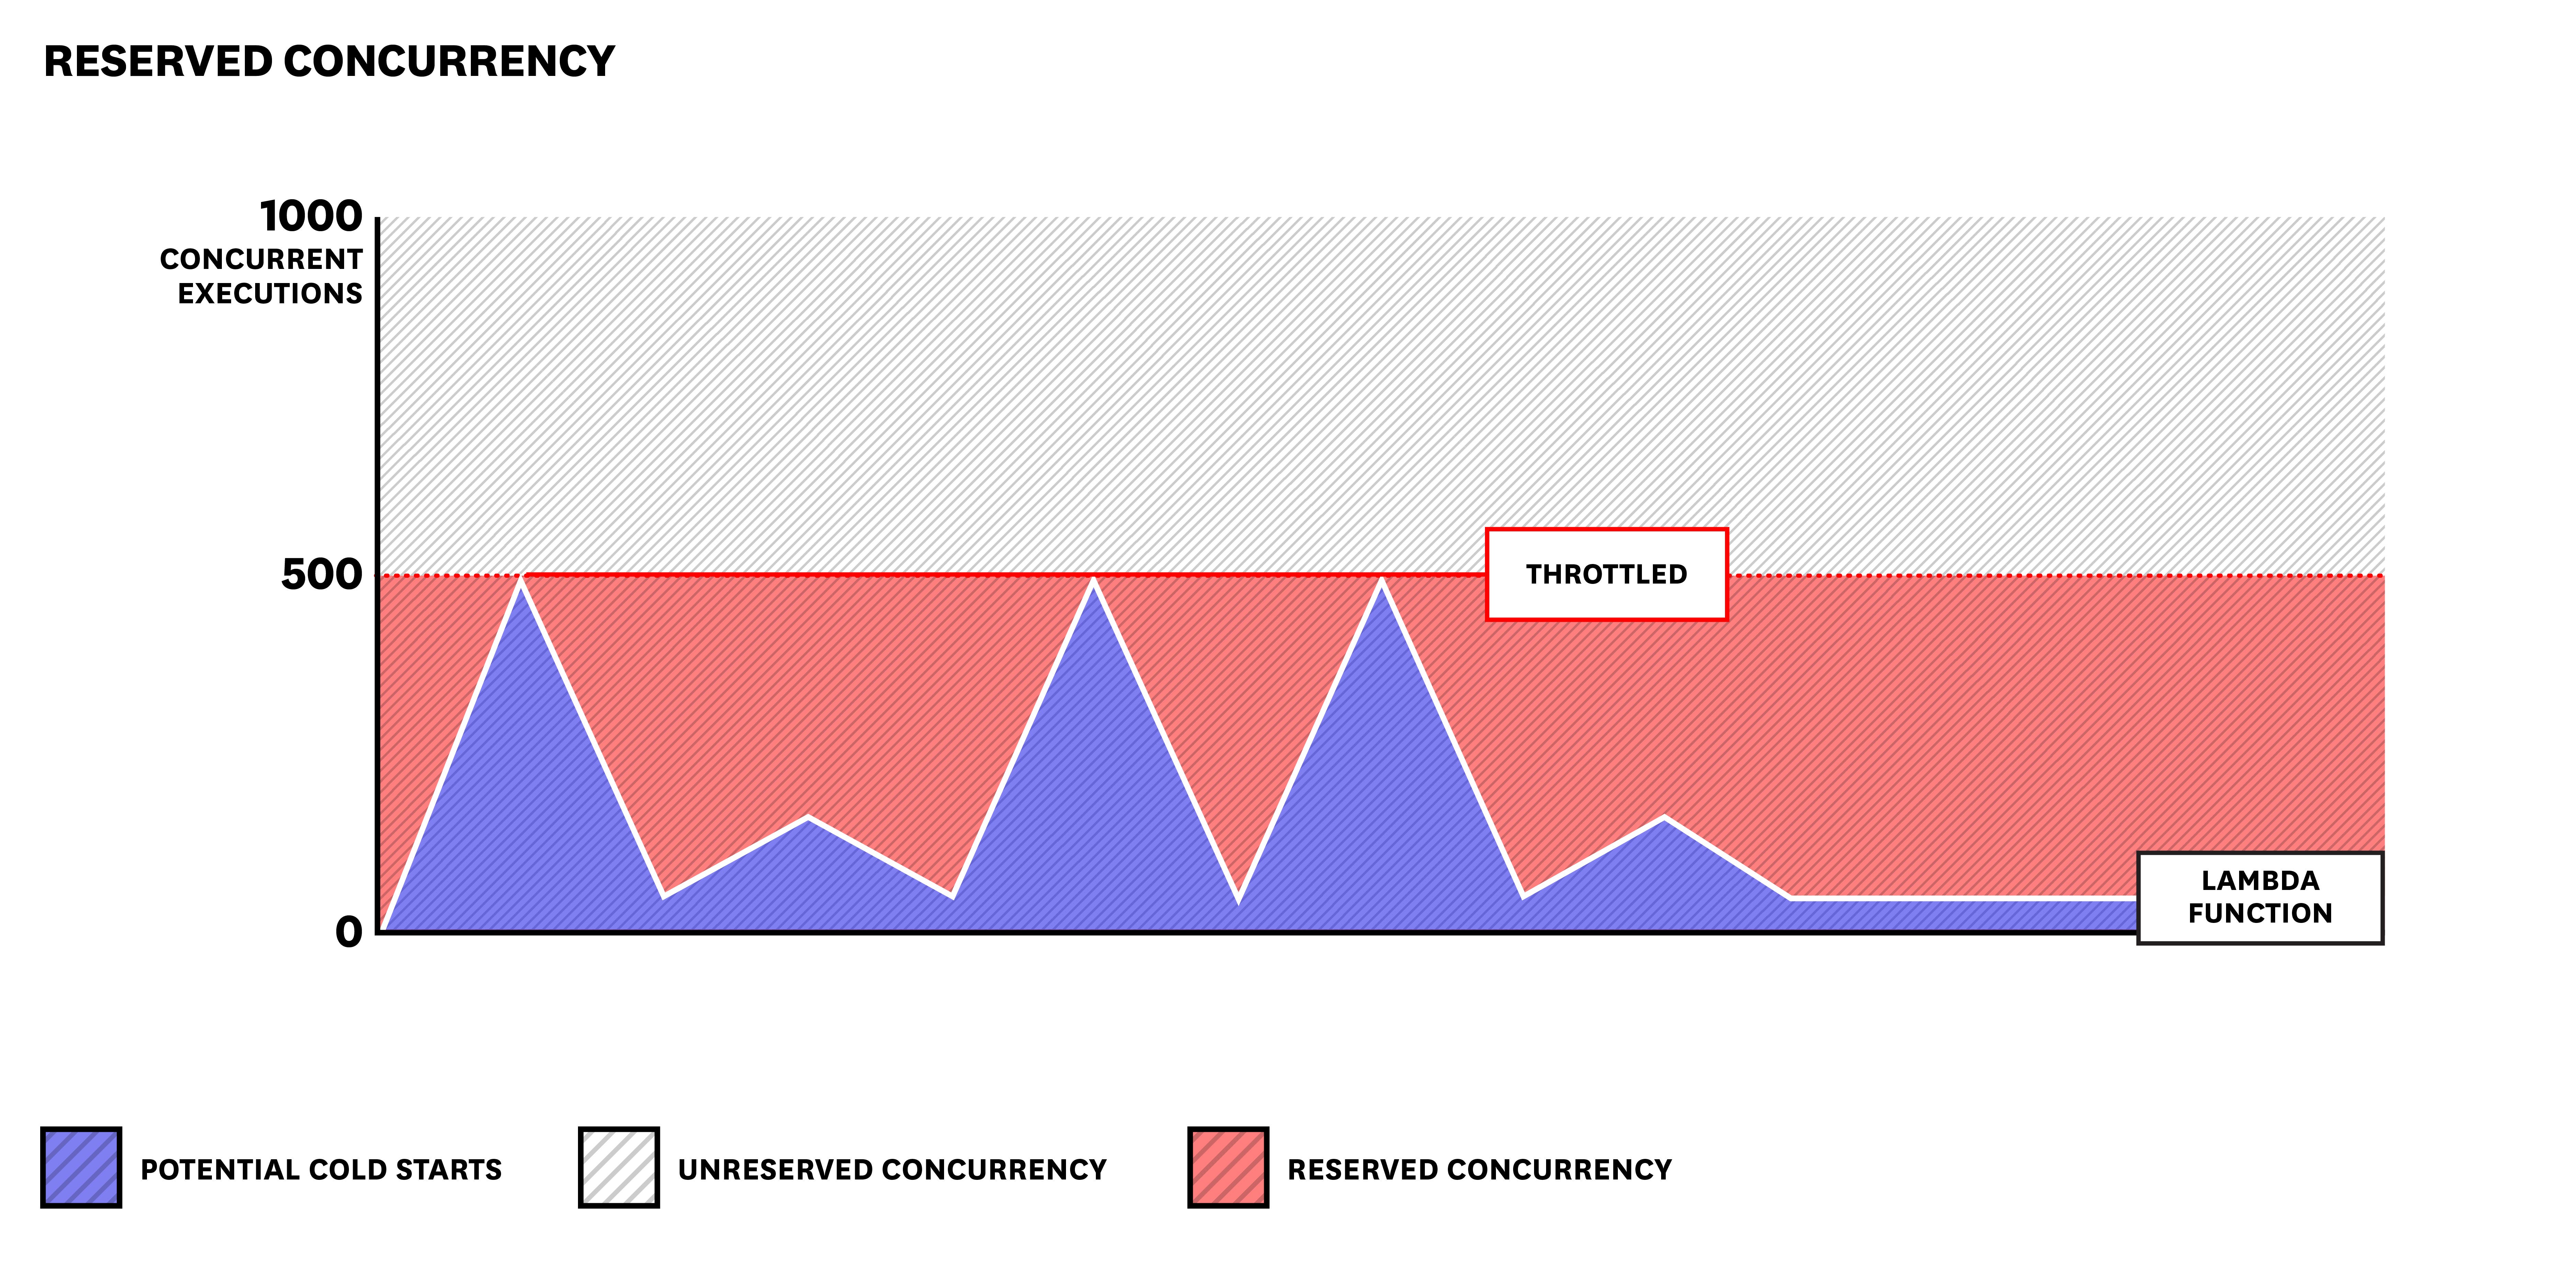
Note that if a function uses all of its reserved concurrency, it cannot access additional concurrency from the unreserved pool. This is especially useful if you know a specific function regularly requires more concurrency than others. You can also reserve concurrency to ensure that a function doesn’t process too many requests and overwhelm a downstream service.
Make sure you only reserve concurrency for your function(s) if it does not impact the performance of your other functions, as it will reduce the size of the available concurrency pool.
Lambda emits the following metrics to help you track concurrency:
| Name | Description | Metric type | Availability |
|---|---|---|---|
| Concurrent executions | The sum of concurrent executions for a function at any point in time | Work: Performance | CloudWatch |
| Unreserved concurrent executions | The total concurrency left available in the pool for functions | Work: Performance | CloudWatch |
| Throttles | The number of throttled invocations caused by invocation rates exceeding concurrent execution limits | Resource: Saturation | CloudWatch |
Metric to alert on: concurrent executions
Functions can execute multiple processes at the same time, or concurrent executions. Monitoring this metric allows you to track when functions are using up all of the concurrency in the pool. You can also create an alert to notify you if this metric reaches a certain threshold.
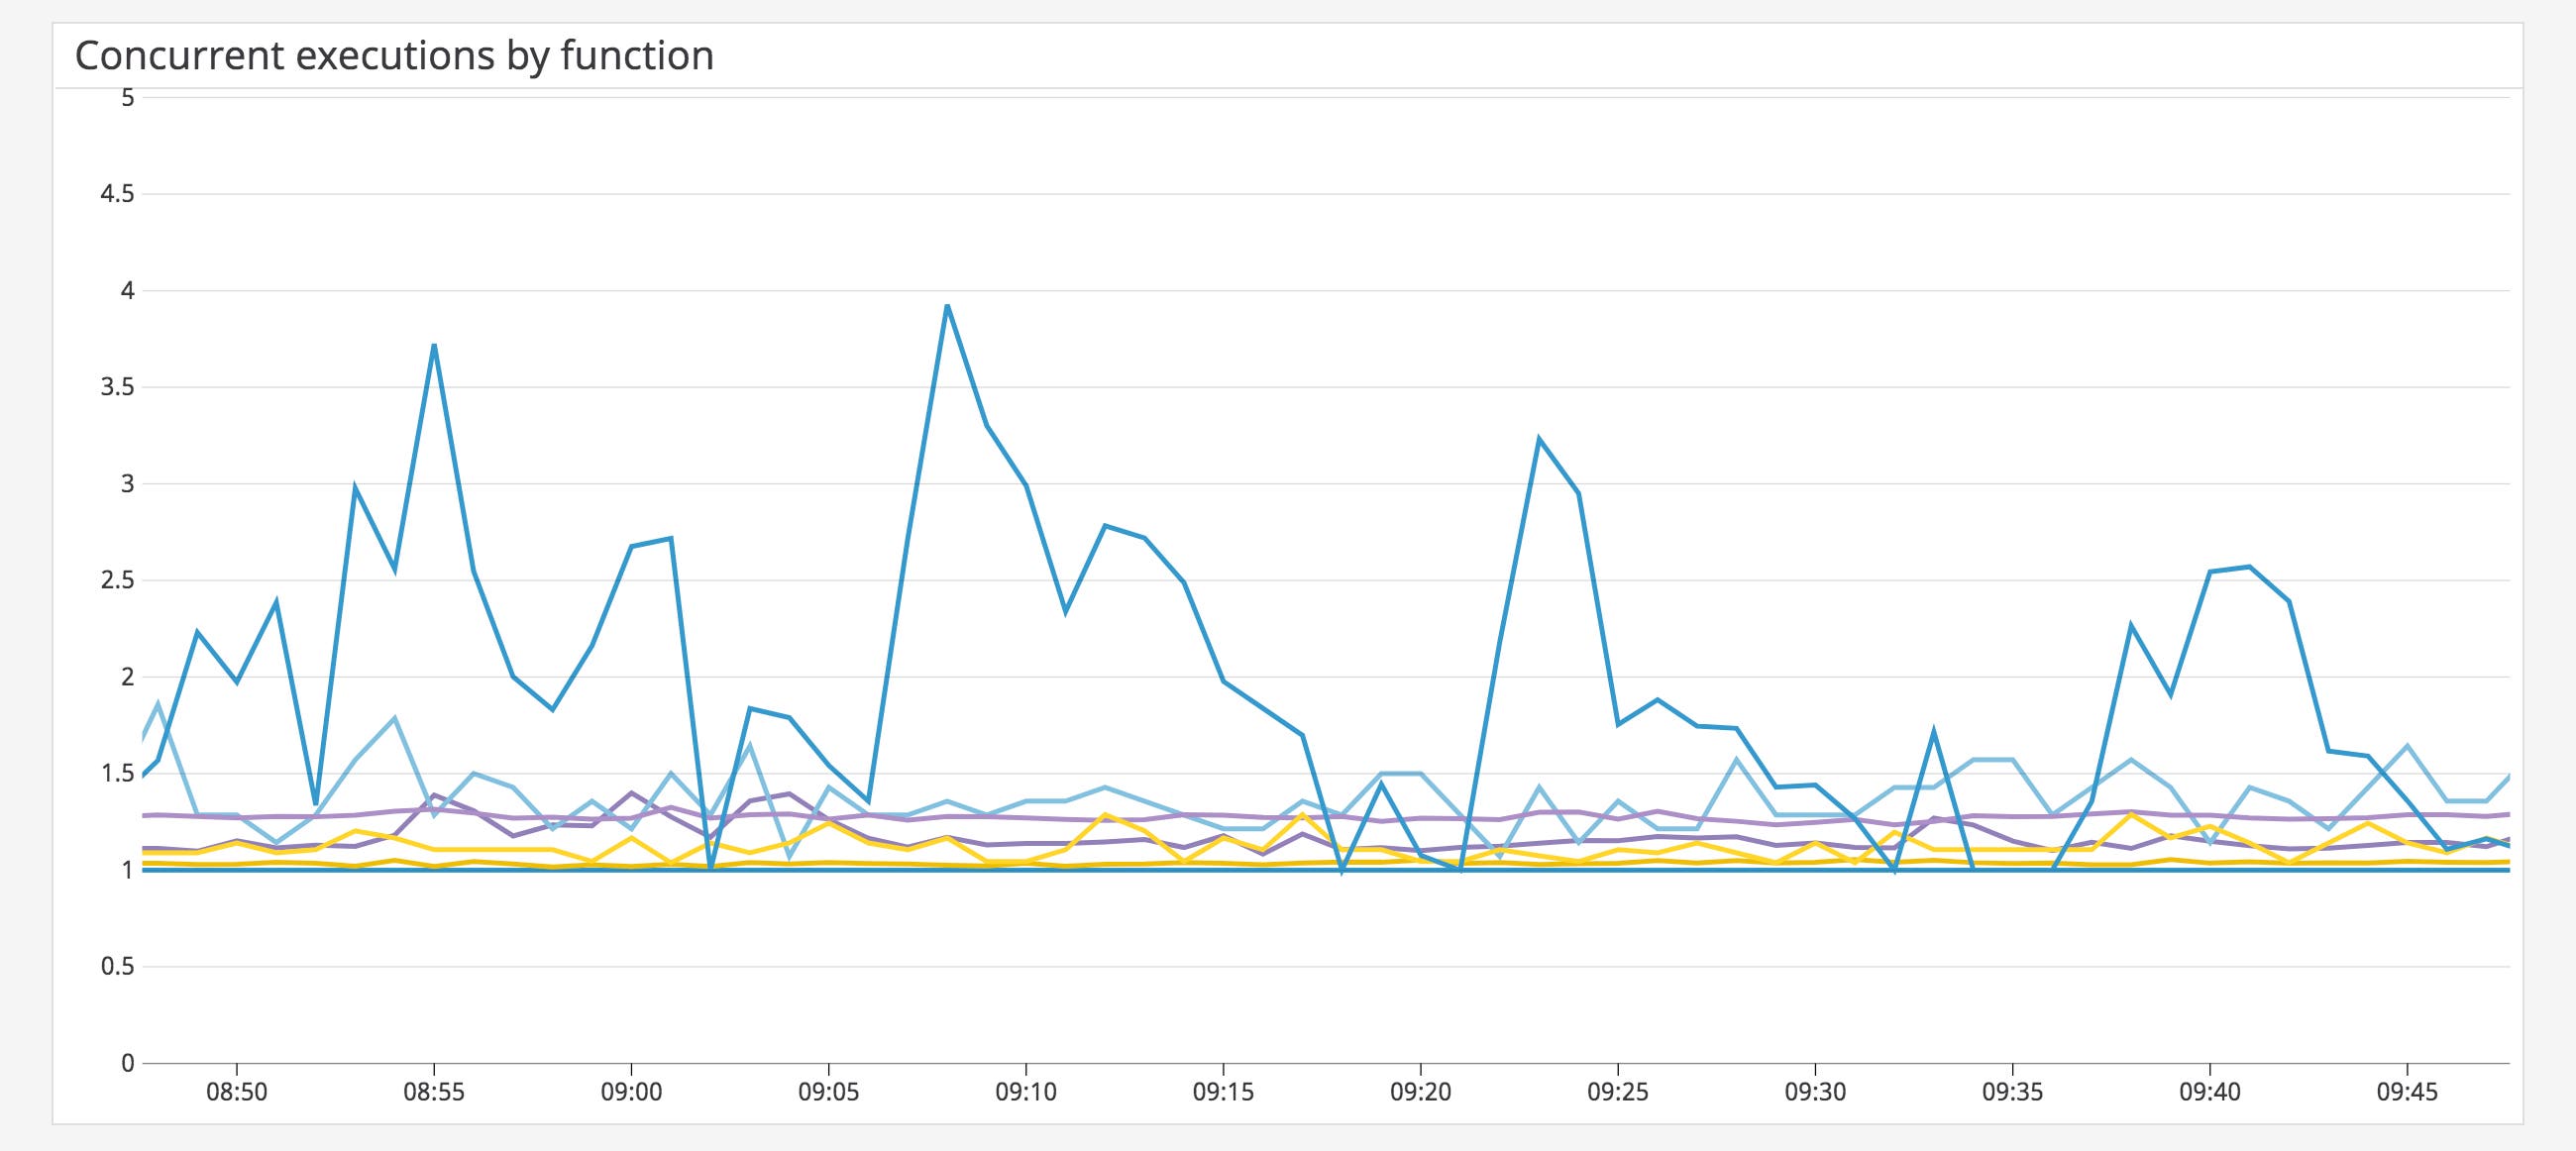
In the example above, you can see a spike in executions for a specific function. As mentioned previously, you can limit concurrent executions for a function by reserving concurrency from the common execution pool. This can be useful if you need to ensure that a function doesn’t process too many requests simultaneously.
Metric to watch: unreserved concurrent executions
You can also track unreserved concurrent executions, equivalent to the total number of available concurrent executions for your account. If you reserved concurrency for any of your functions then this metric would equal the total available concurrent executions, minus any reserved concurrency.
You can compare the unreserved concurrent executions metric with the concurrent executions metric to monitor when functions are exhausting the remaining concurrency pool during heavier workloads.
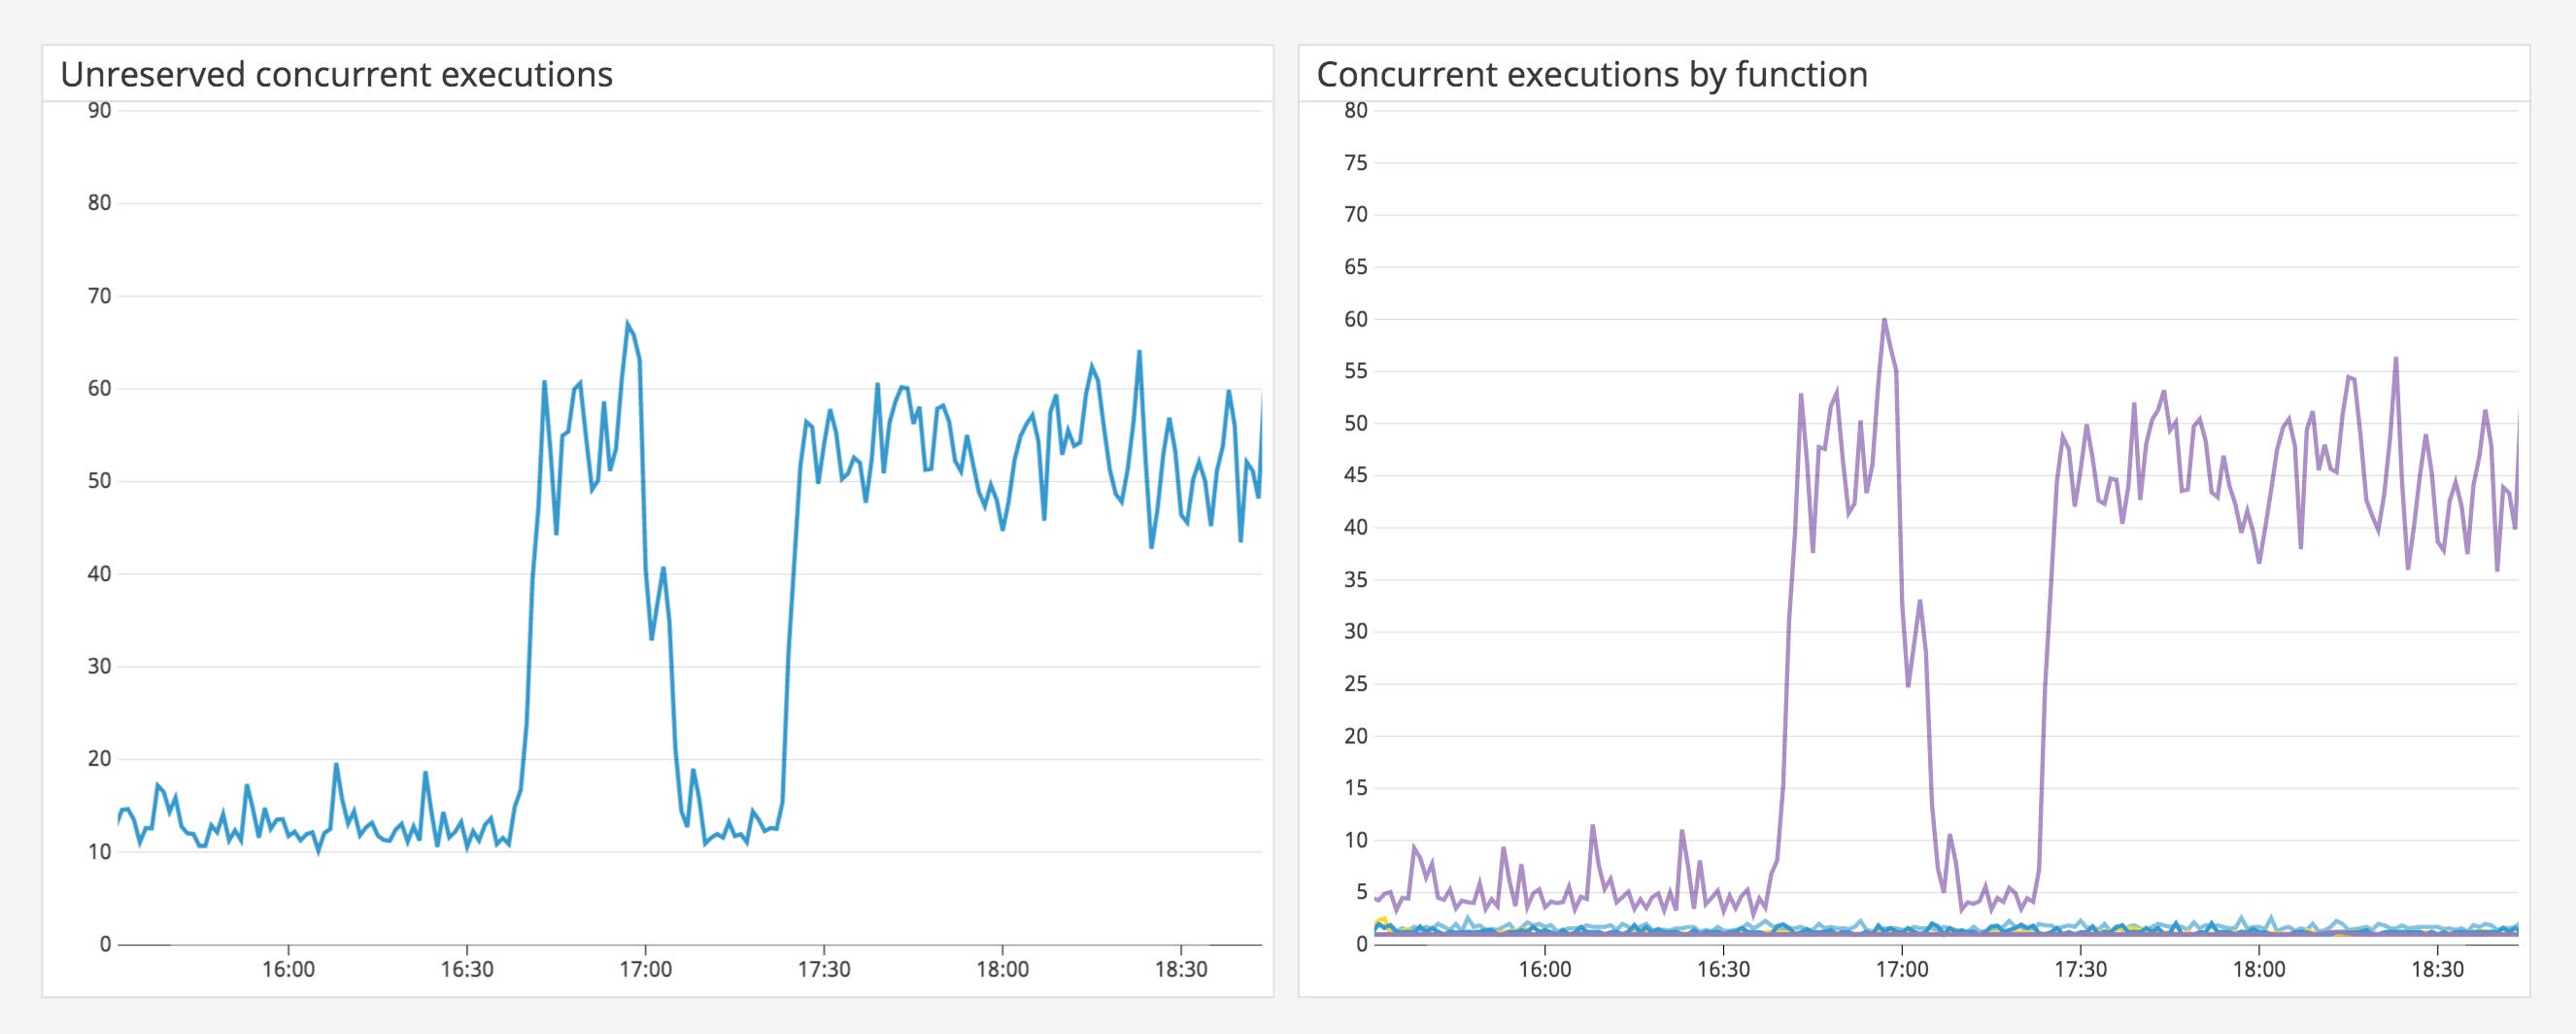
The graphs above show a spike in unreserved concurrency and one function using most of the available concurrency. This could be due to an upstream service sending too many requests to the function. In order to ensure that other functions have enough concurrency to operate efficiently, you can reserve concurrency for this function. However, keep in mind that Lambda will throttle the function if it uses all of its reserved concurrency.
Metric to alert on: throttles
As requests come in, your function will scale to meet demand, either by pulling from the unreserved concurrency pool (if it does not have any reserved concurrency) or from its reserved concurrency pool (if available). Once the pool is exhausted, Lambda will start throttling all functions in that region and reject all incoming requests. You should alert on function throttles so that you can proactively monitor capacity and the efficiency of your functions.
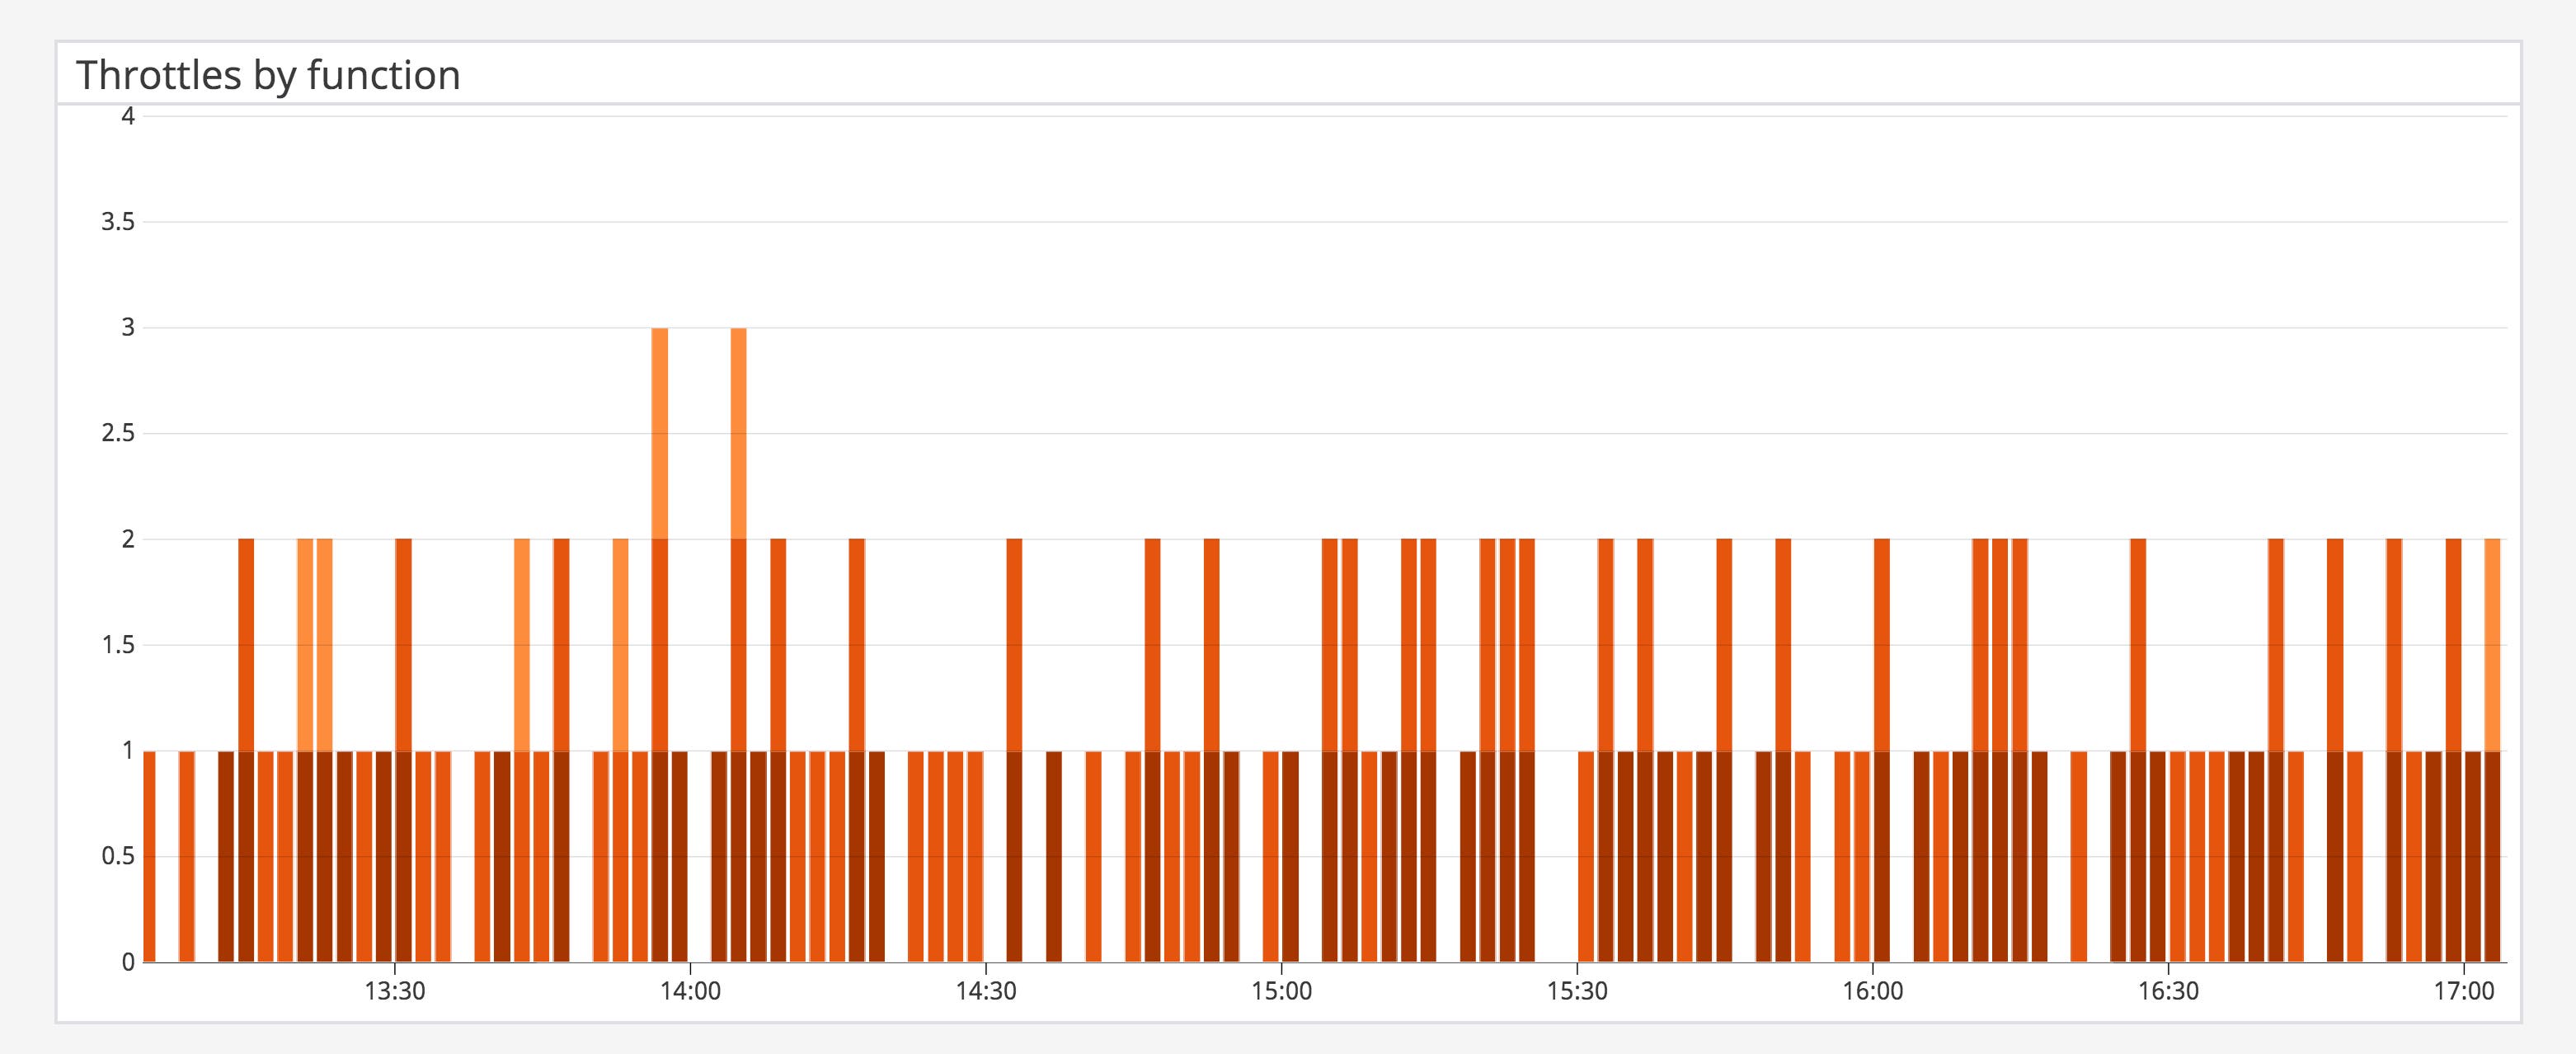
Constant throttling could indicate that there are more requests than your functions can handle and that there is not enough capacity for your functions. If you have a function that is critical for your application, you can assign reserved concurrency for it. This will help ensure that your function will have enough concurrent executions to handle incoming requests. Alternatively, you can reserve concurrency for a function if you want to limit how many requests it processes. Monitoring throttles will help you see if (and where) you are still hitting concurrency limits for your functions. If you are consistently exhausting the concurrency pool, you can request an increase to the per-region concurrent executions limit in your account.
Depending on how the function was invoked, Lambda will handle failures from throttles differently. For example, Lambda will not retry throttled requests from synchronous sources (e.g., API Gateway). It’s important to keep that in mind as you manage concurrency for your functions.
Provisioned concurrency metrics
Since Lambda only runs your function code when needed, you may notice additional latency (cold starts) if your functions haven’t been used in a while. This is because Lambda needs to initialize a new container and provision packaged dependencies for any inactive functions, which can add several seconds of latency for each initialization. Lambda will keep containers alive for approximately 45 minutes, though that time may vary depending on your region or if you are using VPCs.
If a function has a long startup time (e.g., it has a large number of dependencies), requests may experience higher latency—especially if Lambda needs to initialize new instances to support a burst of requests. You can mitigate this by using provisioned concurrency, which automatically keeps functions pre-initialized so that they’ll be ready to quickly process requests.
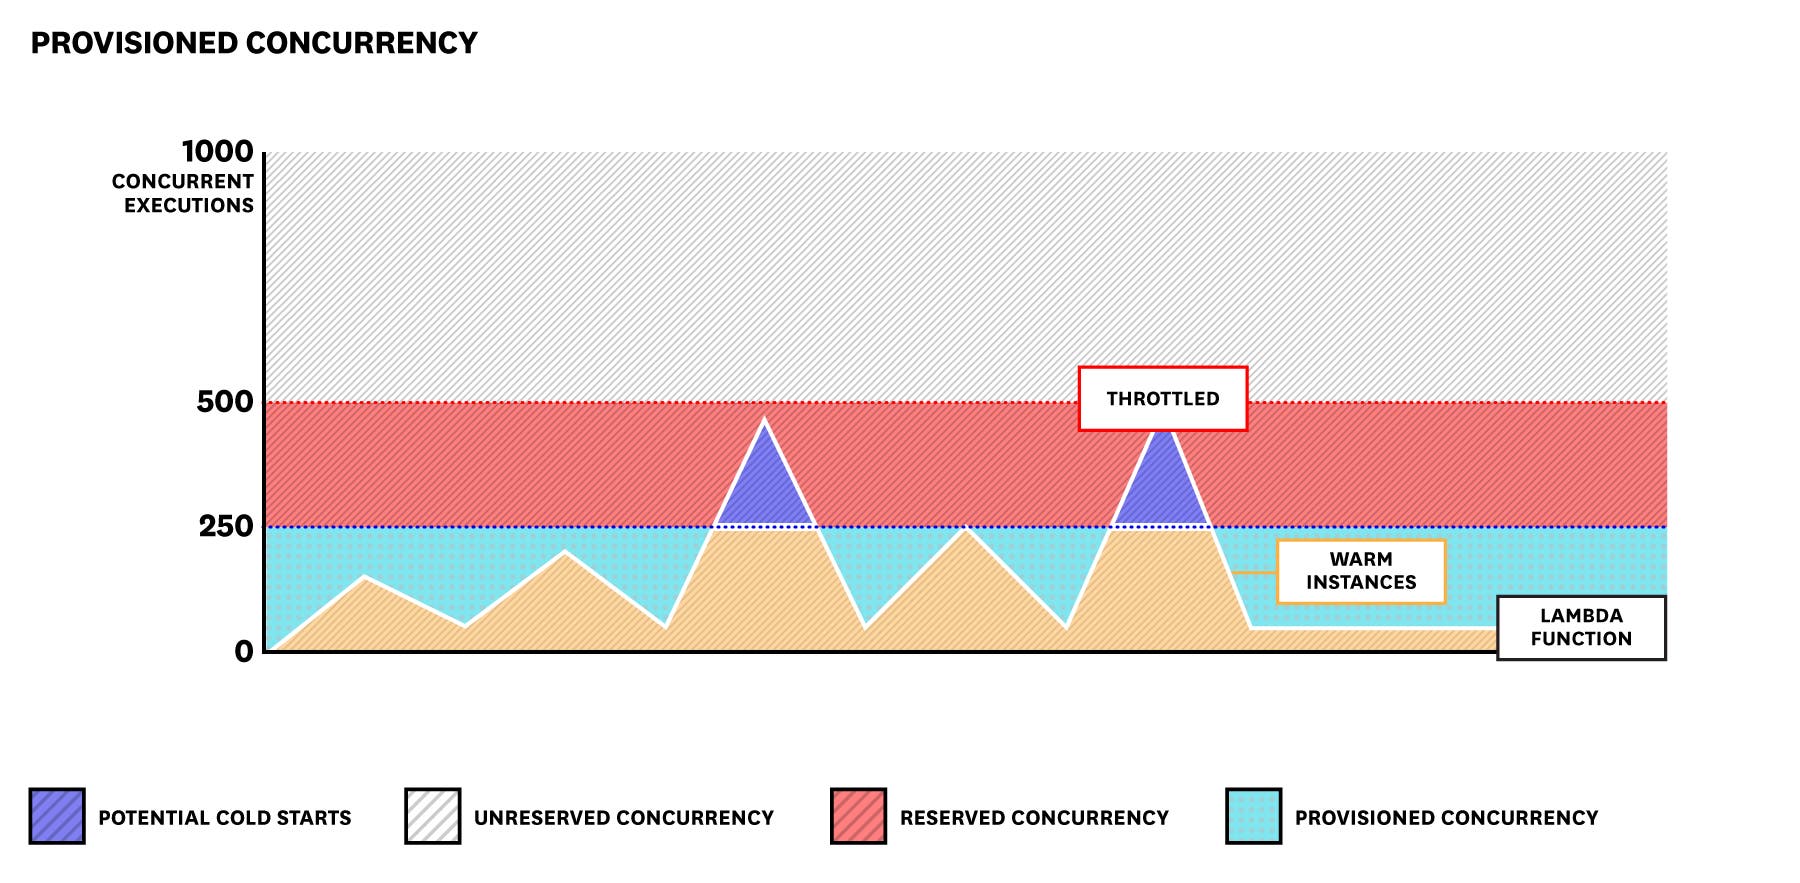
Allocating a sufficient level of provisioned concurrency for a function helps reduce the likelihood that it will encounter cold starts, which can be critical for applications that experience bursts in traffic during specific times of the day (e.g., a food delivery application). You can also configure target tracking, which uses Auto Scaling to meet expected spikes in traffic. Keep in mind that provisioned concurrency comes out of your account’s regional concurrency pool and uses a different pricing model.
There are some key metrics you can monitor if you configure provisioned concurrency for your Lambda functions.
| Name | Description | Metric type | Availability |
|---|---|---|---|
| Provisioned concurrency spillover invocations | The number of concurrent invocations that went over the provisioned concurrency limit | Work: Throughput | CloudWatch |
| Provisioned concurrency utilization | The percentage of its total allocated provisioned concurrency a function is currently using | Resource: Utilization | CloudWatch |
| Provisioned concurrency invocations | The number of invocations on provisioned concurrency | Work: Throughput | CloudWatch |
Metric to alert on: provisioned concurrency spillover invocations
The provisioned concurrency spillover invocations metric shows you if a function exceeds its allocated level of provisioned concurrency. When this occurs, the function will start running on non-provisioned concurrency, increasing the likelihood of cold starts.
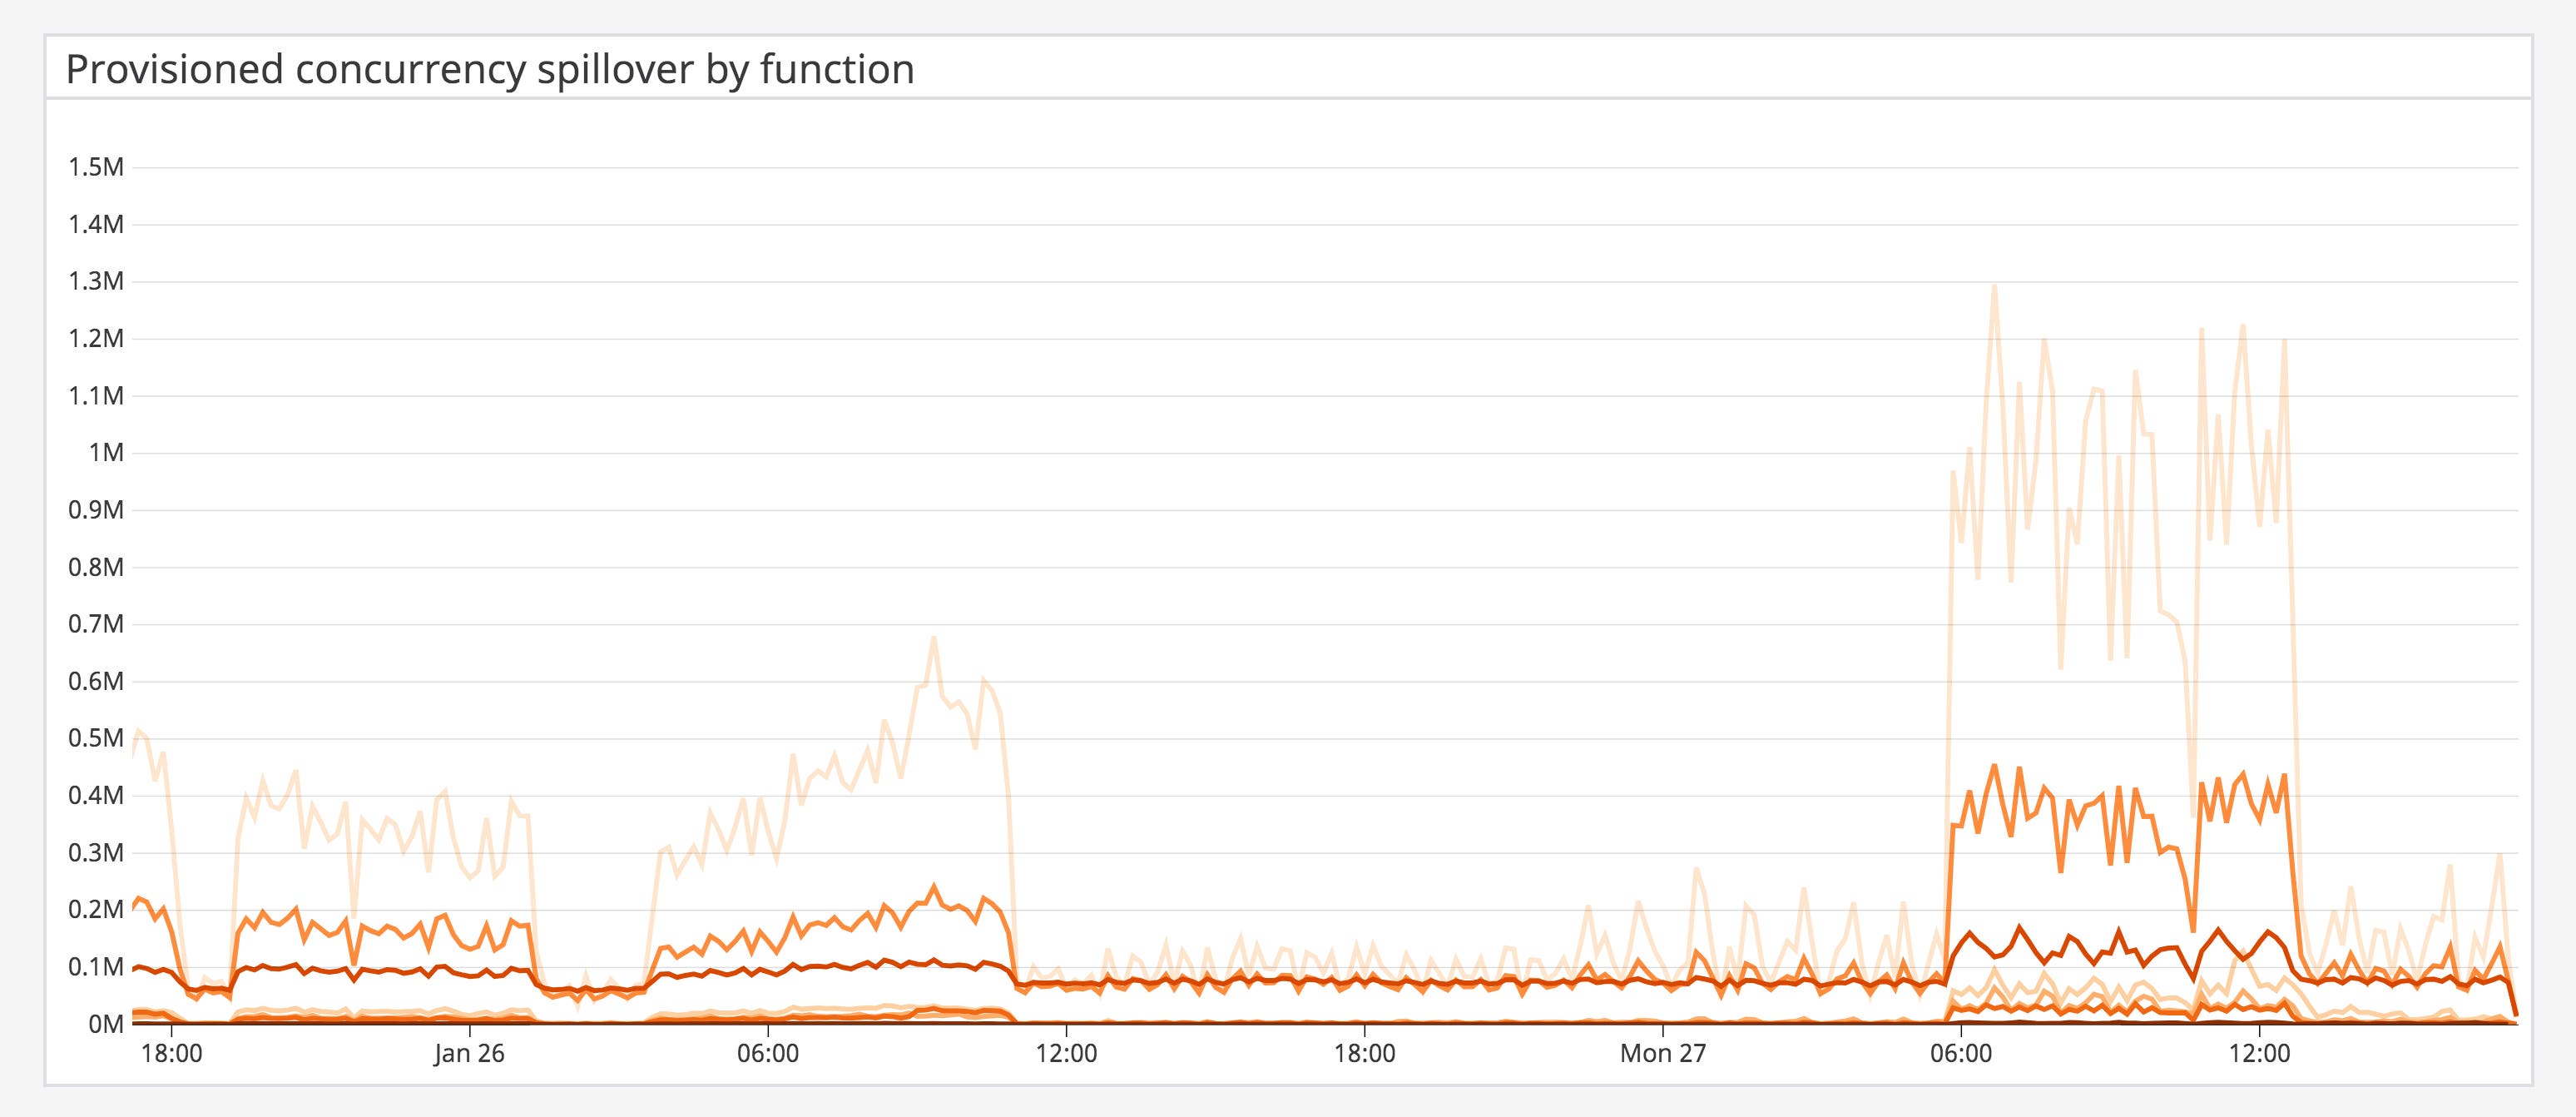
If a function is consistently spilling over its level of provisioned concurrency, you may need to adjust your configuration for that function. Note that the provisioned concurrency level across all aliases and versions cannot exceed the size of your reserved concurrency pool (if you configured one).
Metric to watch: provisioned concurrency utilization
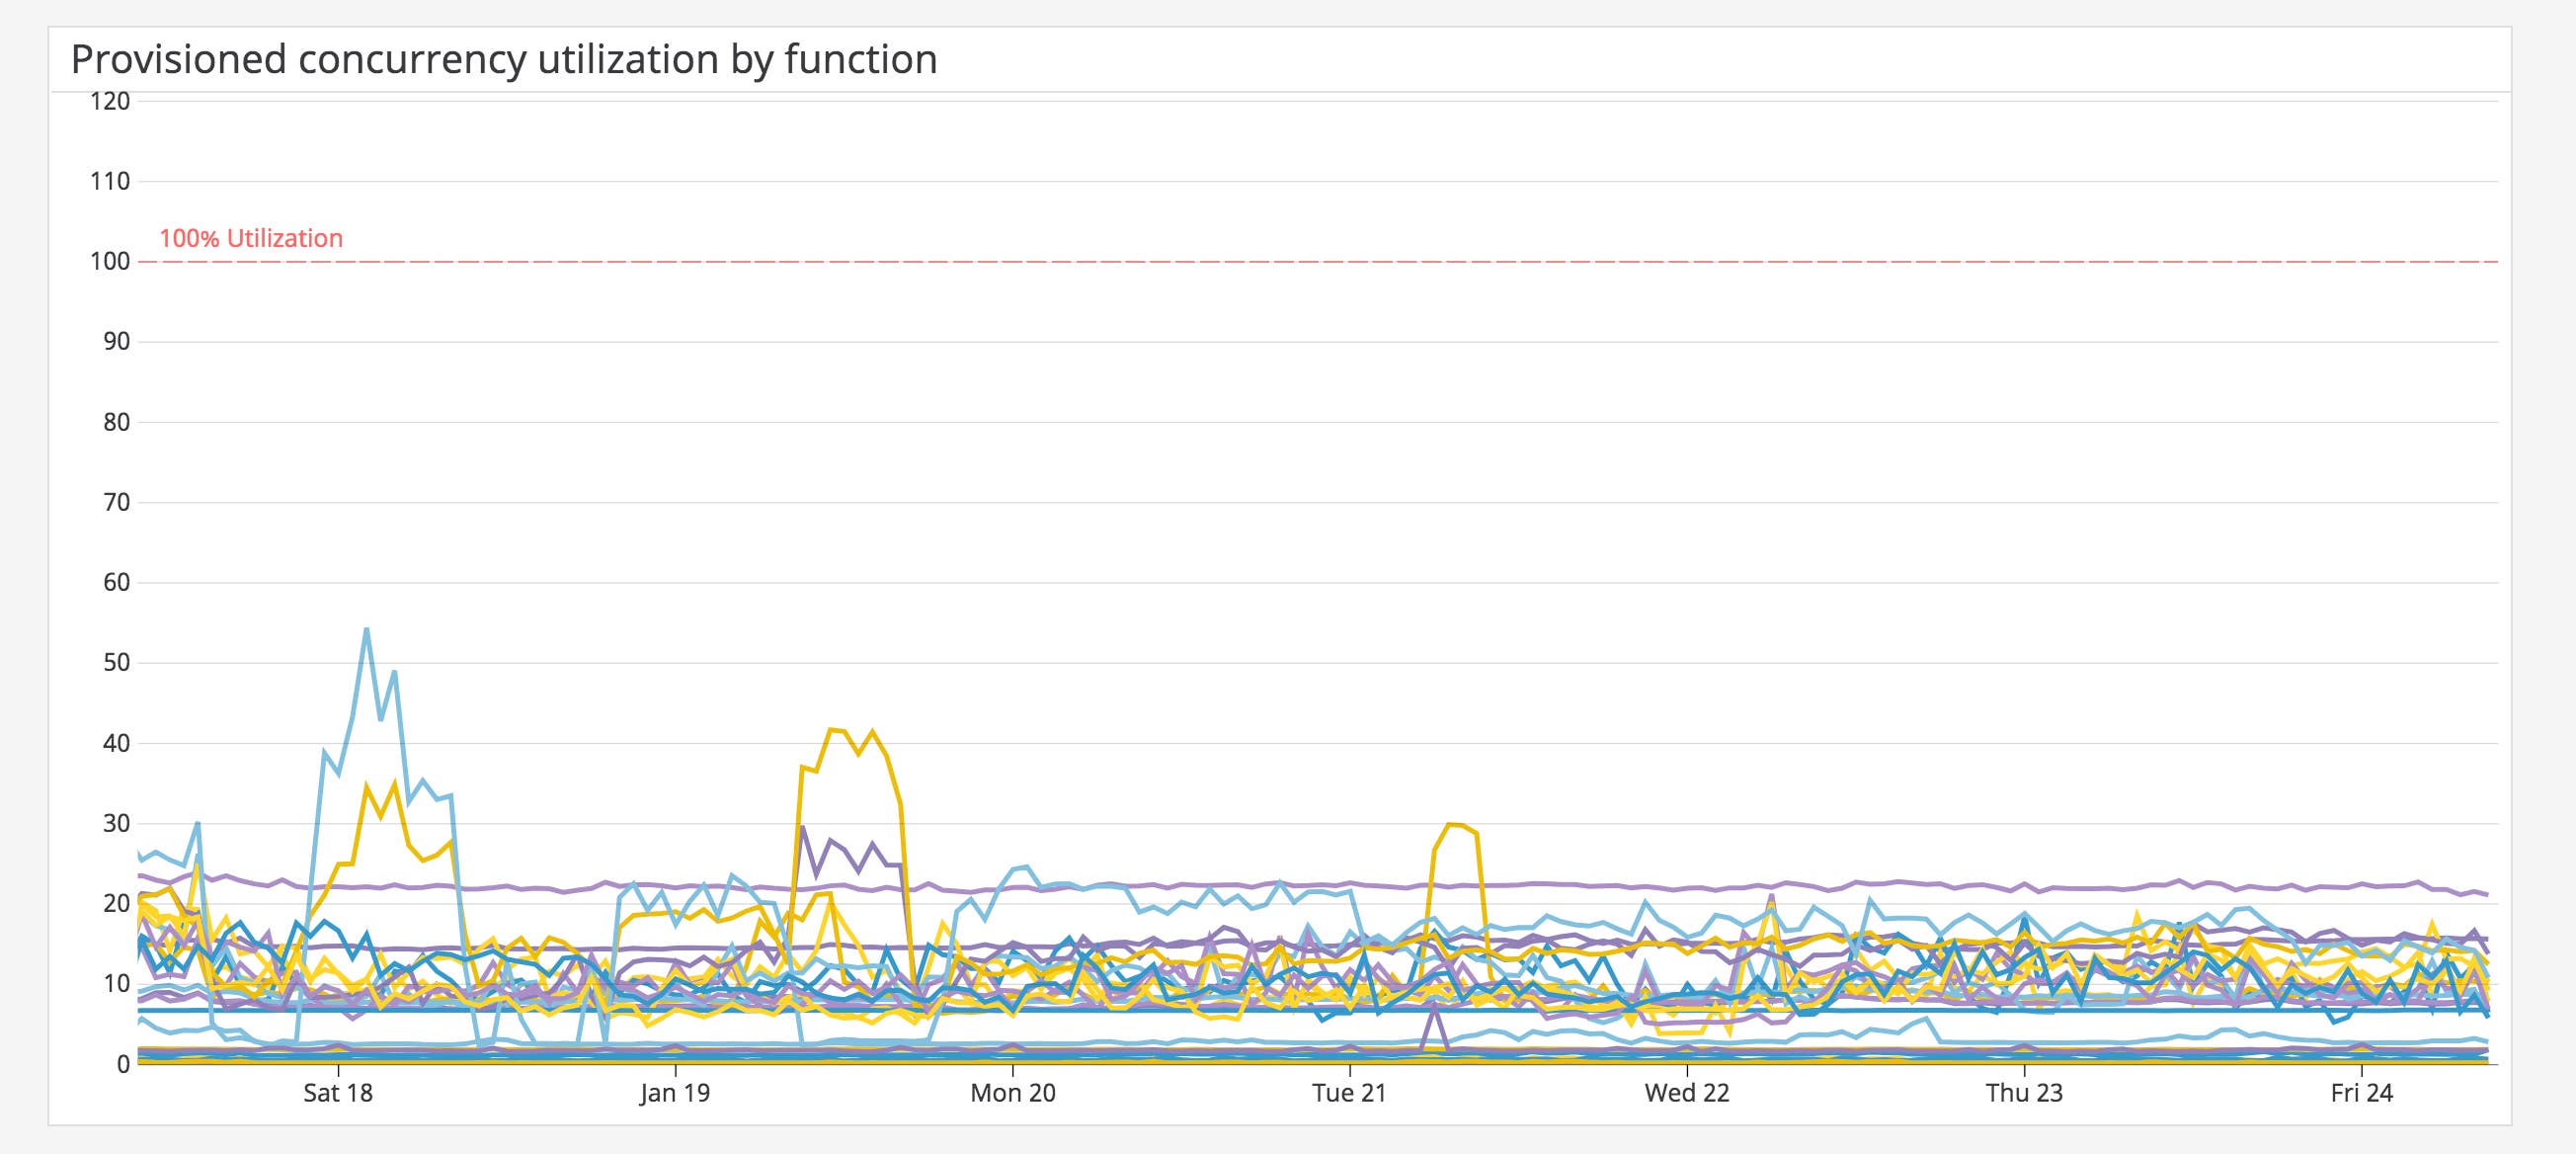
Monitoring provisioned concurrency utilization enables you to see if a function is using its provisioned concurrency efficiently. A function that is using up all of its available provisioned concurrency—its utilization threshold—may need additional concurrency. Or, if utilization is consistently low, you may have overprovisioned a function. You can disable or reduce provisioned concurrency for that function to manage costs.
Metric to watch: provisioned concurrency invocations
The invocations metric tracks the total number of invocations that use non-provisioned concurrency and provisioned concurrency (if the latter is configured). The provisioned concurrency invocations metric only tracks any invocations running on provisioned concurrency. Much like the invocations metric, a sudden drop in provisioned concurrency invocations could indicate an issue with the function or an upstream service.
Monitor Lambda with distributed tracing and APM
Applications that are built with serverless functions are broken down into several, smaller components. Monitoring your Lambda functions in isolation doesn’t provide full visibility into the path of your requests as they travel across components of your serverless architecture. You can get valuable insights into performance by tracing your functions, which enables you to identify bottlenecks in your applications and connected AWS services.
In Part 2 of this series, we’ll show you how you can use AWS X-Ray to instrument and trace your functions. In Part 3, we’ll show you how to use Datadog to get deep insights into your Lambda traces—and seamlessly correlate them with relevant metrics and logs to get full visibility into your serverless applications.
Next step: Collect the metrics
In this post, we’ve covered how AWS Lambda works and some key metrics you should monitor to optimize your serverless functions and manage costs. Next, we will show you how to collect and view your Lambda metrics, logs, and traces.

