Alain Rodriguez
This is a guest post from Alain Rodriguez, Apache Cassandra consultant at The Last Pickle.
We are happy to announce the release of a new set of dashboards in Datadog for monitoring Apache Cassandra. We have combined our expertise as Cassandra consultants with Datadog’s monitoring platform to provide Cassandra users with a set of clear, detailed, out-of-the-box dashboards.
The new dashboards fall into two categories, each serving different purposes:
- Overview dashboard: for easily detecting any unexpected behavior
- Themed dashboards: for efficiently troubleshooting, identifying bottlenecks, and fixing issues
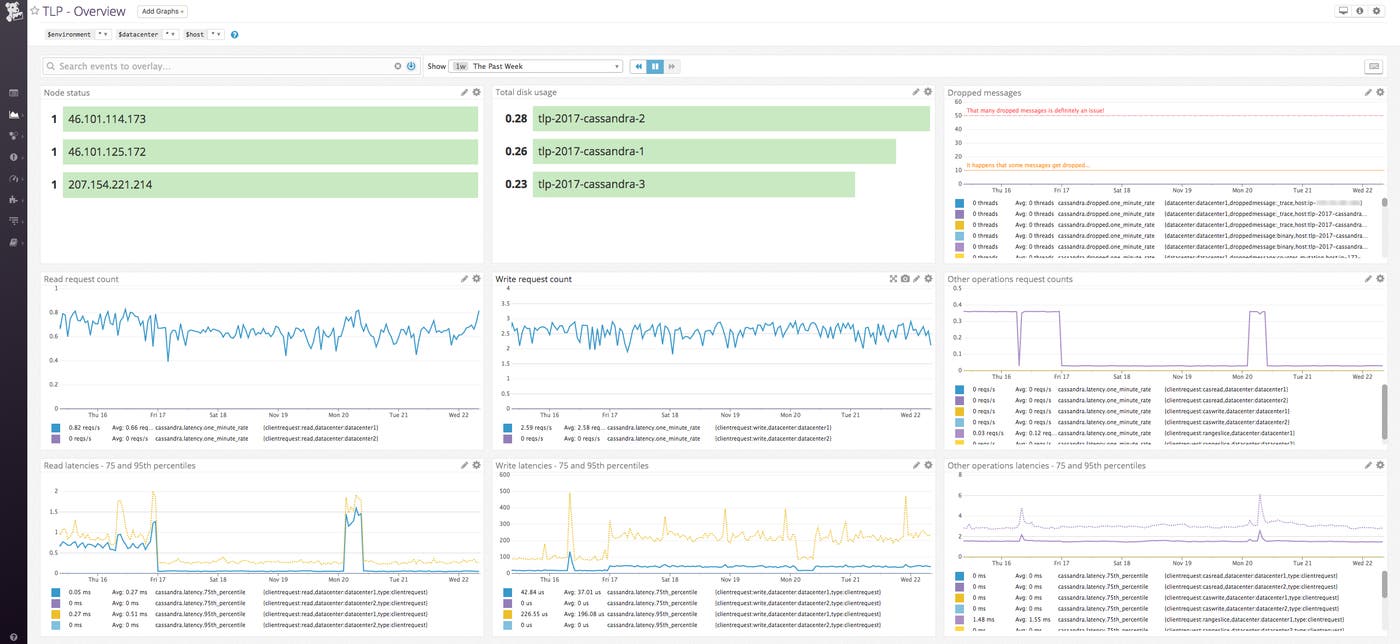
Overview dashboard

The goal of the overview dashboard is to easily detect problems. We don’t try to troubleshoot at this stage, but rather verify that the Cassandra cluster is healthy. The overview dashboard examines the minimal set of metrics necessary to achieve this goal.
As Cassandra operators, we want to be warned anytime “something is happening” in the Cassandra cluster, without losing any important information in a flood of noncritical events. These charts aim to answer the question “Is Cassandra globally healthy, or is something happening that’s affecting the cluster?” in a way that is immediately obvious.
Themed dashboards

The themed dashboards have been designed to troubleshoot and optimize Cassandra performance. Each of the dashboards targets a specific “theme,” or a perspective on one of Cassandra’s internal processes, maximizing their efficiency for focused troubleshooting. The three themed dashboards are:
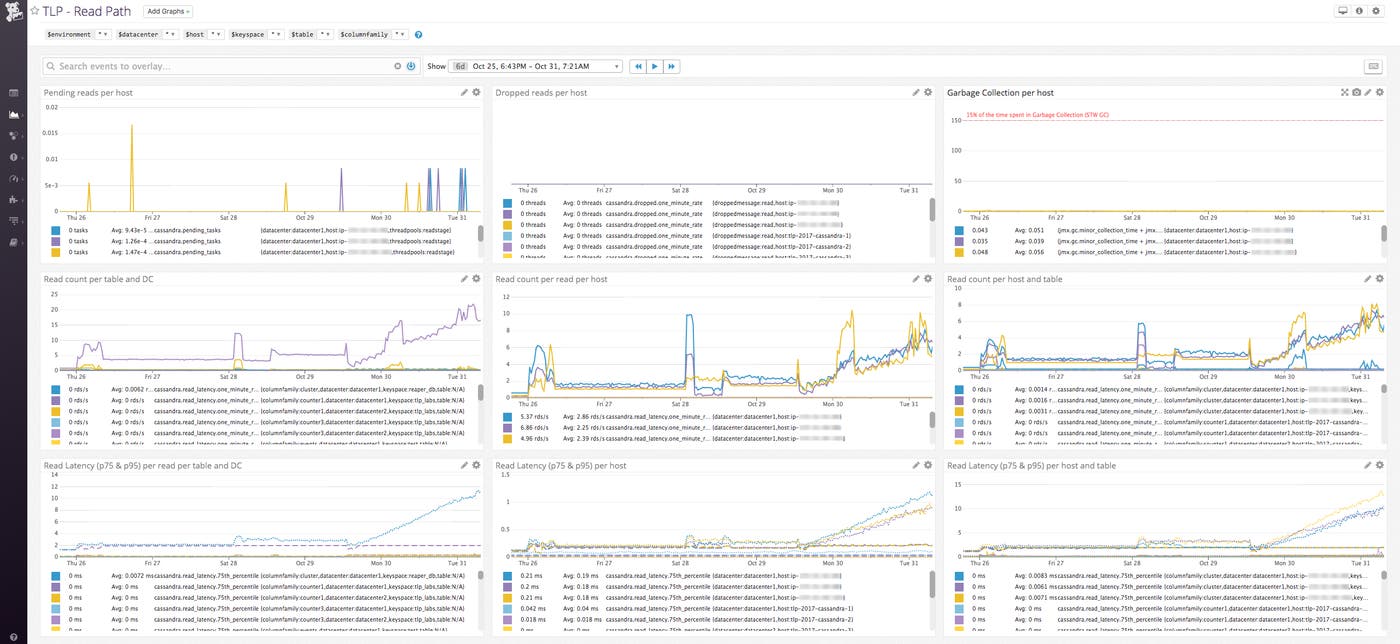
- Read path: This dashboard aims to display critical information on anything that could impact a high-level client read in Cassandra.
- Write path: Similar to the read path dashboard, this dashboard is focused on troubleshooting any issue that could affect writes.
- SSTable management: This dashboard aims to help you detect any issues related to the asynchronous management of Cassandra’s SSTables from the moment they are flushed to disk.
Metrics and aggregations
The themed dashboards have all been optimized for a three-column layout. We have selected combinations of aggregations and metrics based on our years of experience diagnosing Cassandra issues in production. These are, we believe, the most immediately effective ways to figure out what is happening in your cluster when an issue arises.
In these dashboards, you will notice the following commonalities of design:
- Per table: a metric aggregated over all the hosts in the same data center, to know how each table is performing.
- Per host: a metric aggregated over all the tables together to see how each host performs compared to others at a glance.
- Per host and table (without aggregation): the worst-case combinations of table and node for rapid troubleshooting.
These commonalities make it easier to understand the information presented in the context of the chosen theme.
Tracking complete cluster health in one place
The new suite of Cassandra dashboards is now available to all Datadog users. The overview and themed dashboards will appear in your list of Datadog dashboards as soon as you enable the Cassandra integration in your Datadog account. Learn more about the design of these new dashboards in the following presentation at Datadog Summit 2017 from The Last Pickle’s Joaquin Casares.
These dashboards are compatible with versions of Apache Cassandra from 2.0 to the latest 3.11.x release. However, some metrics are not available in the earlier versions, so some charts will be empty if you are using those versions.
About The Last Pickle
The Last Pickle was born out of our passion for the open source community and the firmly held belief that Cassandra would become the ubiquitous database platform of the next generation. We have maintained our focus since starting in March 2011 as the first pure Apache Cassandra consultancy in the world.
We work to deliver and improve Apache Cassandra–based solutions. We have built a team that enjoys learning, sharing their knowledge with others, and participating in open source communities. This has allowed us to accumulate over fifty years of Apache Cassandra experience that we invest in our clients’ success.


