David M. Lentz
Apache Druid is a data warehouse and analytics platform that can capture streaming data from message queues like Apache Kafka and batch data from static files. Druid can be a valuable component in your technology stack if you need to collect real-time data for online analytical processing (OLAP) tasks like reporting, ad-hoc querying, and dashboarding.
We’re pleased to announce that Datadog now integrates with Druid, so it’s easy to monitor the performance of your Druid queries and data ingestion, as well as the health of your Druid infrastructure.
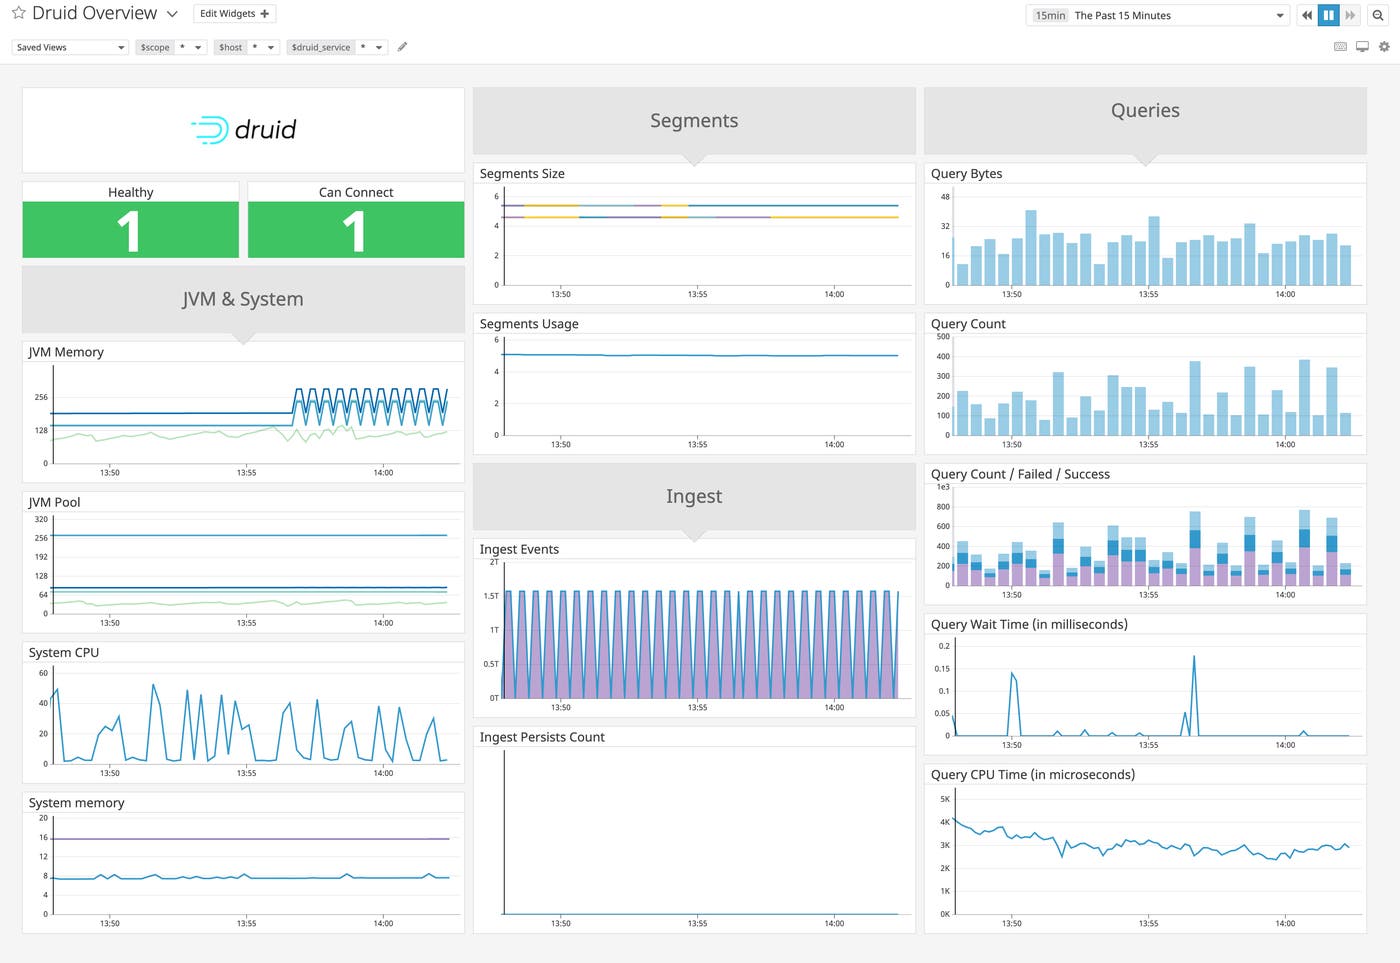
Monitor Druid data ingestion
Druid can ingest data streams from message queues like Amazon Kinesis and Apache Kafka, and batch data from local or shared file systems. Datadog helps you monitor Druid’s ingestion activity to ensure that your data is loading as expected. This lets you spot any changes in the rate of ingestion that could indicate an infrastructure problem such as a failed realtime node.
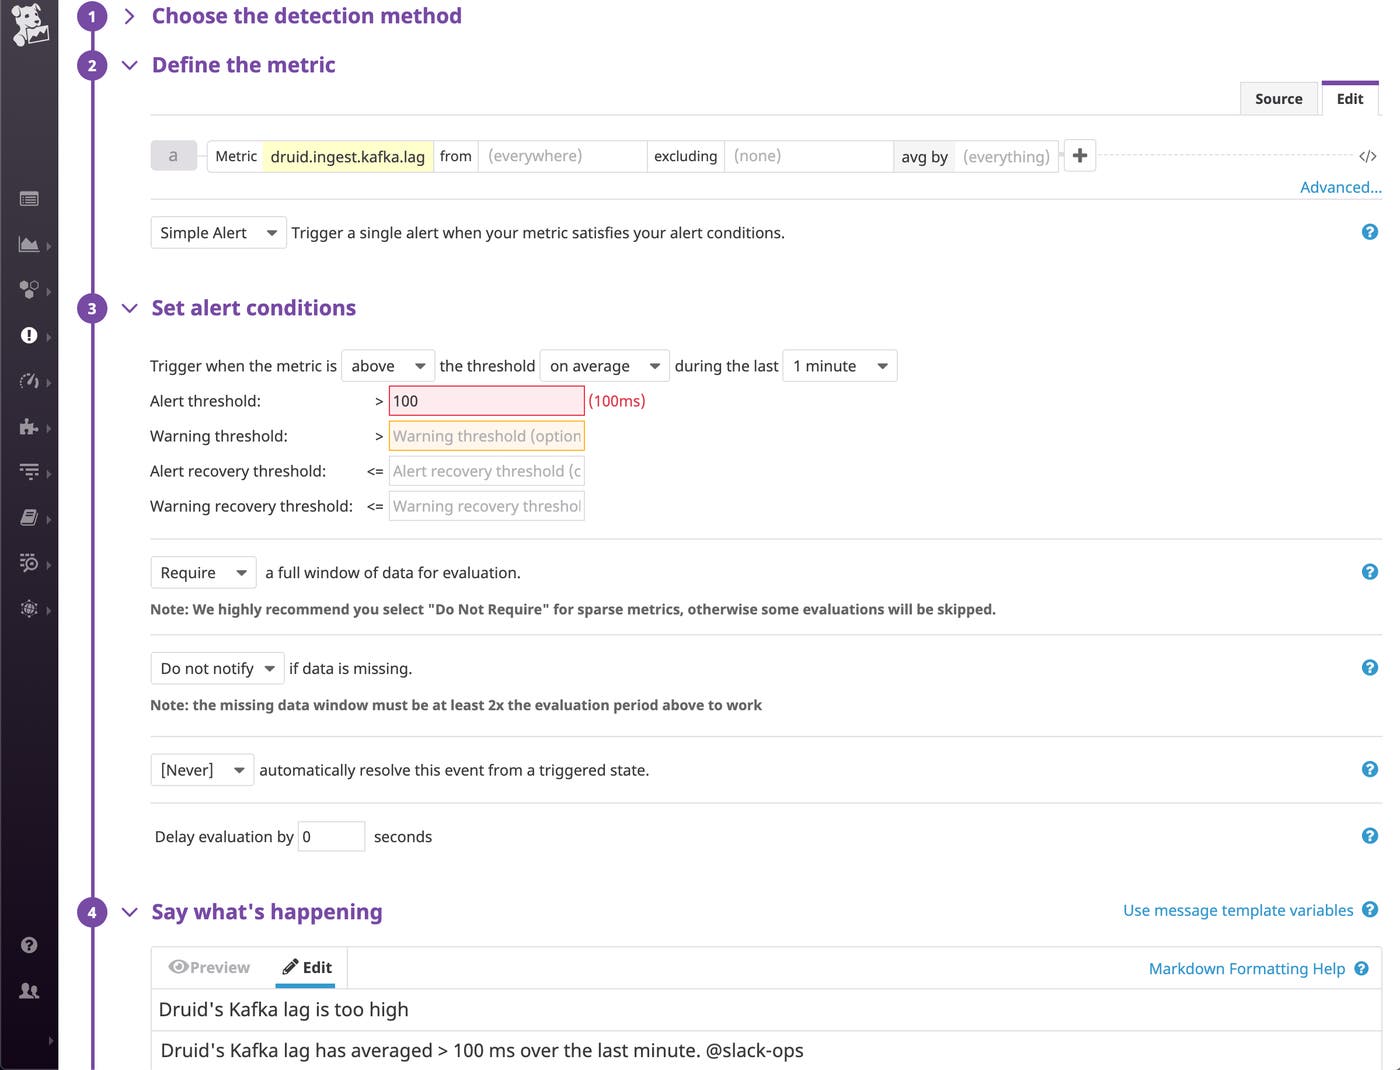
When you’re ingesting a Kafka data stream, it’s important to know whether your Druid nodes are keeping up with the rate of messages published to the Kafka topics you’re reading from. You can monitor the druid.ingest.kafka.lag metric—which measures the difference between the time a message is published by Kafka and the time it is ingested by Druid’s Kafka indexing service—to see how long Druid’s ingestion task is taking. You can easily create an alert to notify you if this metric rises above a defined threshold, which would indicate that the Druid ingestion task is falling behind. In the screenshot below, we’ve set an alert to send a message to a Slack channel if Druid’s Kafka lag rises above 100 ms. You may be able to reduce lag by adding Druid nodes to your infrastructure, increasing the rate at which Druid consumes Kafka messages.
Monitor Druid queries and caches
While you’re monitoring to ensure that Druid is ingesting data successfully, you also need to make sure that your users can explore that data. Monitoring the performance of your queries can alert you to user-experience problems like unresponsive dashboards. The graphs in the screenshot below track the average latency and amount of data returned by each Druid query. Correlating these two metrics can reveal slow queries and help you determine if you need to tune your cluster’s configuration to improve performance.

Druid relies on caches to serve data as quickly as possible, so it’s important to understand the activity of your Druid caches. You can monitor the druid.query.cache.total.hitRate metric to see the percentage of queries that are served from cache instead of from disk. If your cache hit rate is low and query latency is high, you can expand your cache by adding a distributed key-value store such as Redis.
You can also improve query performance by defining high-priority and low-priority queries and configuring your historical nodes—which execute most of Druid’s queries—into separate tiers to process each priority. The nodes in the high-priority tier should have more CPU cores and RAM to ensure that those queries are processed quickly, and nodes in the low-priority tier can be smaller and more cost effective. If you tag each node with its tier, you can filter your Druid data in Datadog to see the performance of specific tiers—for example by aggregating the average execution time of all the queries in the high-priority tier.
Monitor Druid system resources
To understand the health of your Druid infrastructure, you should monitor its resource consumption. Druid is written in Java, so it runs inside a JVM and uses resources that the JVM provides. Monitoring the memory usage of Druid’s JVM can help you troubleshoot performance problems and spot resource usage trends that could affect Druid’s performance. The screenshot below shows two graphs from Datadog’s built-in Druid dashboard that illustrate the JVM’s memory usage over time.

If Druid is using increasing amounts of memory (and if your host has any unused memory), you can increase the memory available to Druid’s JVM by updating the jvm.config file.
You should also monitor Druid’s storage utilization to prevent outgrowing your available disk space. Druid nodes periodically create segments to store ingested data to disk. Druid stores segments in deep storage, which is storage infrastructure external to Druid, such as a local file system or cloud storage like Amazon S3. As Druid creates segments, its storage utilization increases, so you should monitor the druid.segment.used metric to see the amount of space currently used to store the segments.
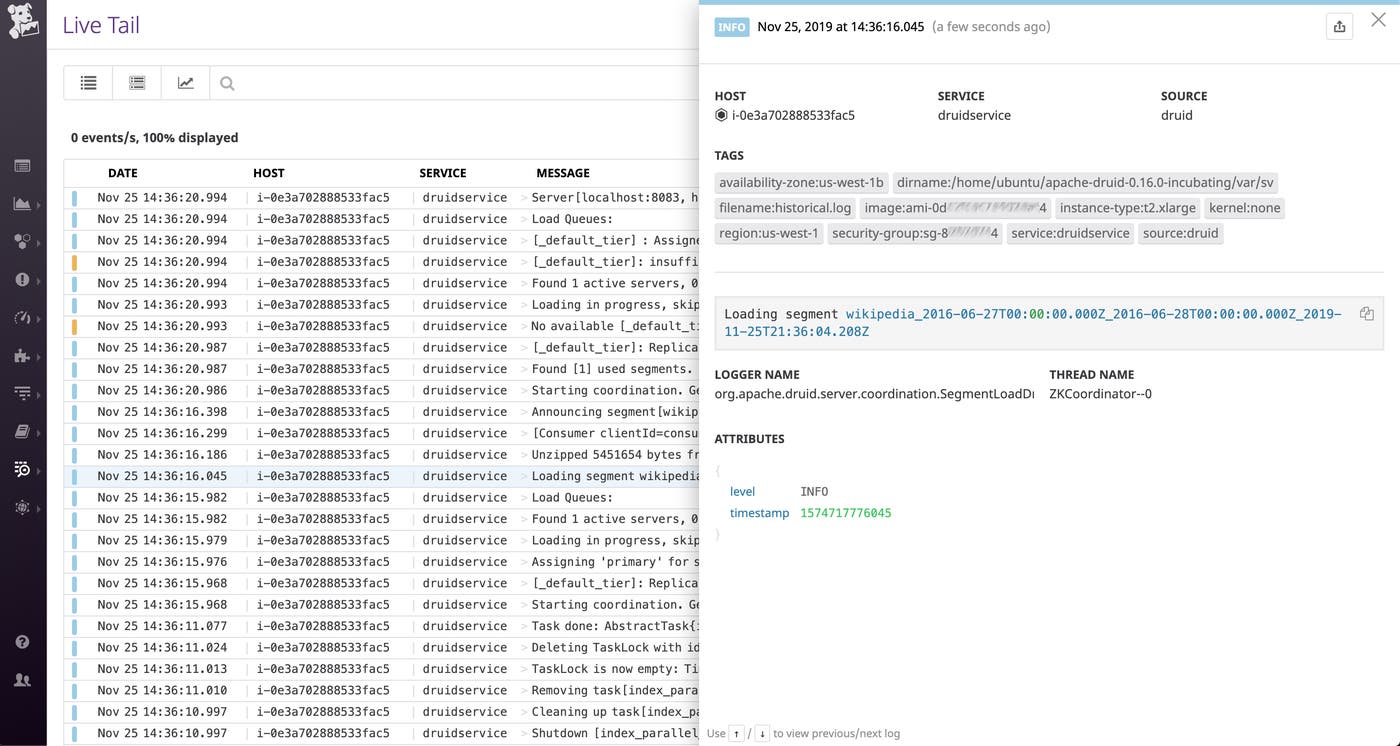
You can configure the Druid integration to collect logs to help you see the details of your cluster’s activity. You can gain deeper visibility into Druid’s data-loading tasks by correlating logs with metrics such as druid.ingest.events.processed to see both the number of data ingestion tasks executed and the details of any particular ingestion task. The screenshot below shows an example of a log created by a Druid historical node when it loads a data segment, confirming that the segment is queryable. This type of log can be helpful when you’re troubleshooting an issue in which you suspect a problem with the availability of your data.
The amount of deep storage Druid uses can influence your infrastructure costs, so you should monitor it alongside disk space metrics from your S3 buckets or your HDFS DataNodes and determine whether it’s time to drop unused segments from your Druid cluster.
Maximize your visibility into Druid
Apache Druid can ingest and query huge volumes of data quickly and reliably. Datadog now has more than 1,000 integrations, so you can monitor Druid alongside related technologies like Kafka, Zookeeper, Amazon S3, and HDFS. If you’re not already using Datadog, you can start today with a free 14-day trial.

