Lauren Zuniga
When an application slows down or fails, pinpointing the cause isn’t always simple. Is it a backend regression, a misbehaving API, or a bottleneck somewhere deep in the network? Without full visibility, teams waste precious time troubleshooting across disconnected tools and layers.
Datadog Synthetic Monitoring now supports Network Path to help you proactively identify whether user-facing issues stem from your code or from the underlying network. With end-to-end testing coverage to validate every step of the user journey, you can detect degradations faster, resolve issues sooner, and deliver the reliable digital experiences that your users expect.
In this post, we’ll show how you can use Network Path in Synthetic Monitoring to:
- Pinpoint root causes fast and immediately understand issues that originate from the network
- Test from global locations to replicate real-world conditions and mirror user traffic
- Proactively catch issues early with alerts for latency and packet loss before users are impacted
Pinpoint root causes to resolve issues quickly
Even when your application tests pass, issues like packet loss and upstream latency can still impact users. Traceroute utilities and network monitoring tools can help uncover these issues, but these tools often live outside your application context, forcing your teams to manually correlate data across multiple systems.
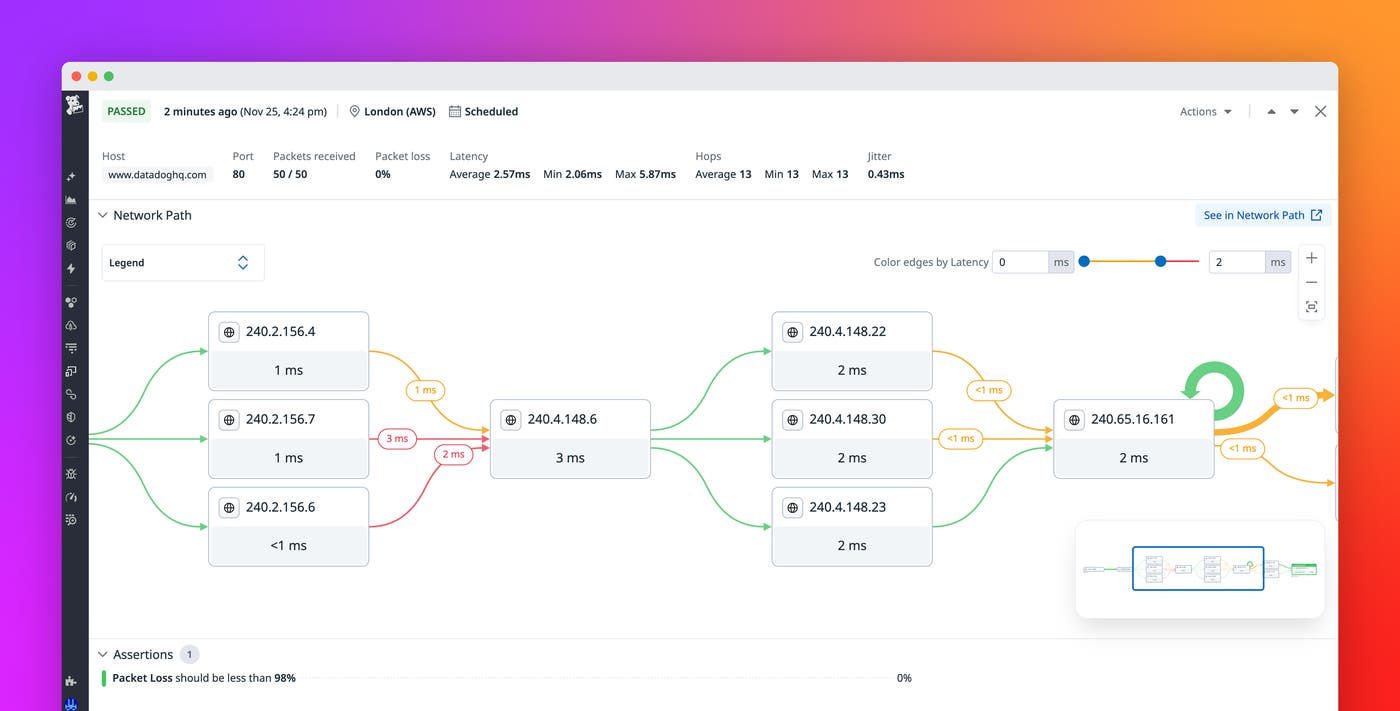
With Network Path tests, you can view both sides of the equation in one place. When a Synthetic browser or API test detects a slowdown, you can pivot directly to a correlated Network Path view to trace hop-by-hop performance and pinpoint where latency or packet loss occurs. You receive a historical view of path changes and additional detailed metrics, making it easier to identify recurring patterns over time. This unified context helps you resolve cross-layer issues in minutes instead of hours and strengthen the collaboration across your SRE, DevOps, and network operations teams.
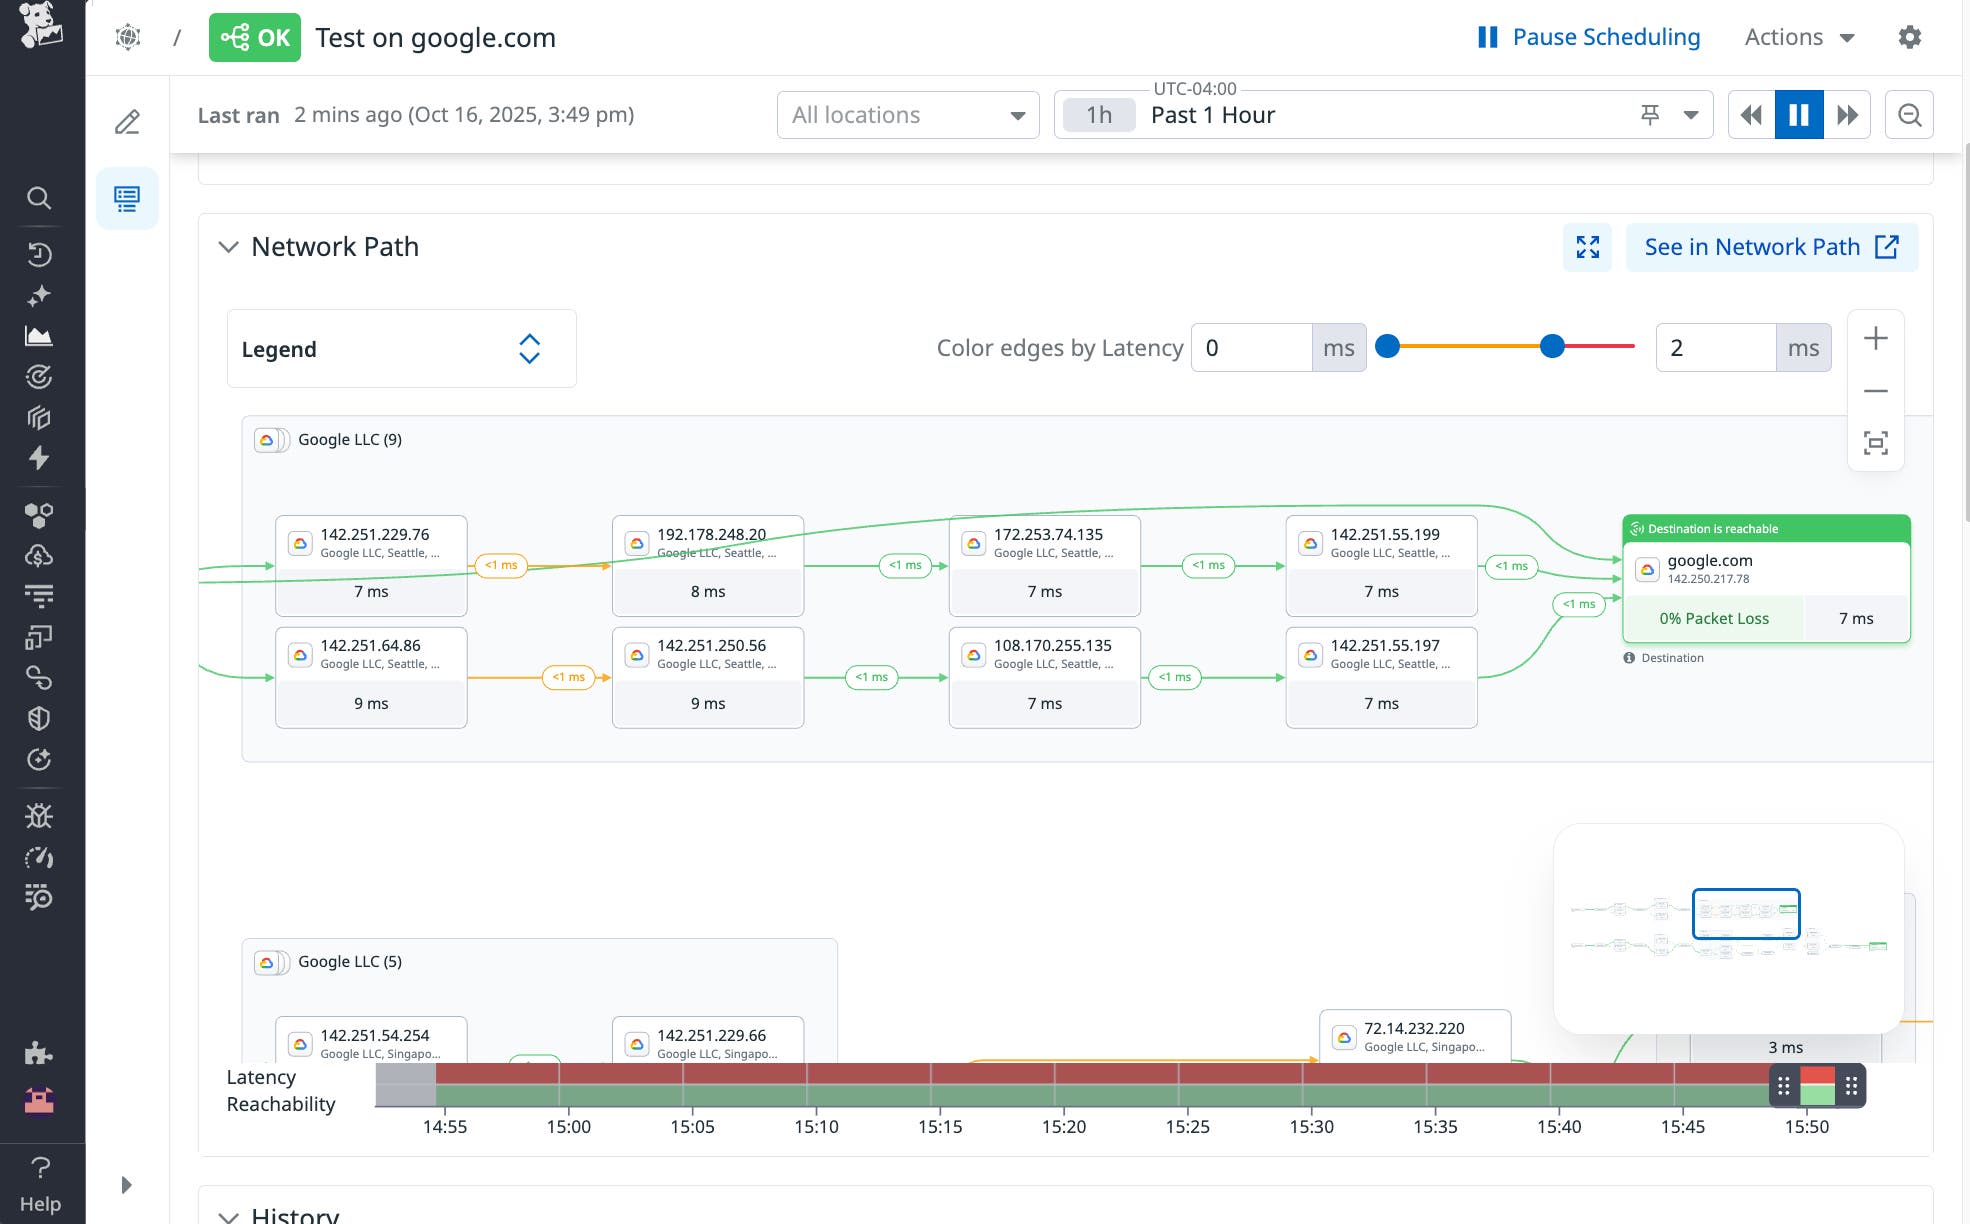
By viewing related browser, API, and network tests together, you can more easily understand how each layer contributes to an issue. Whether the slowdown stems from the application, an upstream service, or the underlying network, you can quickly see where the problem lies without switching tools or losing context.
Diagnose with real-world testing conditions
Modern cloud-native applications depend on complex, distributed networks, which can introduce performance variability that affects the user experience. With Network Path, you can simulate real-world conditions by testing from Datadog’s global managed locations and private networks. You can visualize each hop along the path between your test location and your service endpoint, monitor round-trip latency, and see where changes occur over time.
Whether you’re troubleshooting intermittent slowdowns or validating the health of your infrastructure, Network Path gives you a continuous, data-driven view of network performance that mirrors what your users actually experience.
Proactively detect network issues before they impact users
Reactive troubleshooting costs time and user trust. Network Path in Synthetic Monitoring turns what used to be reactive investigations into proactive monitoring by enabling you to set assertions and alerts on network-level conditions such as latency and packet loss.
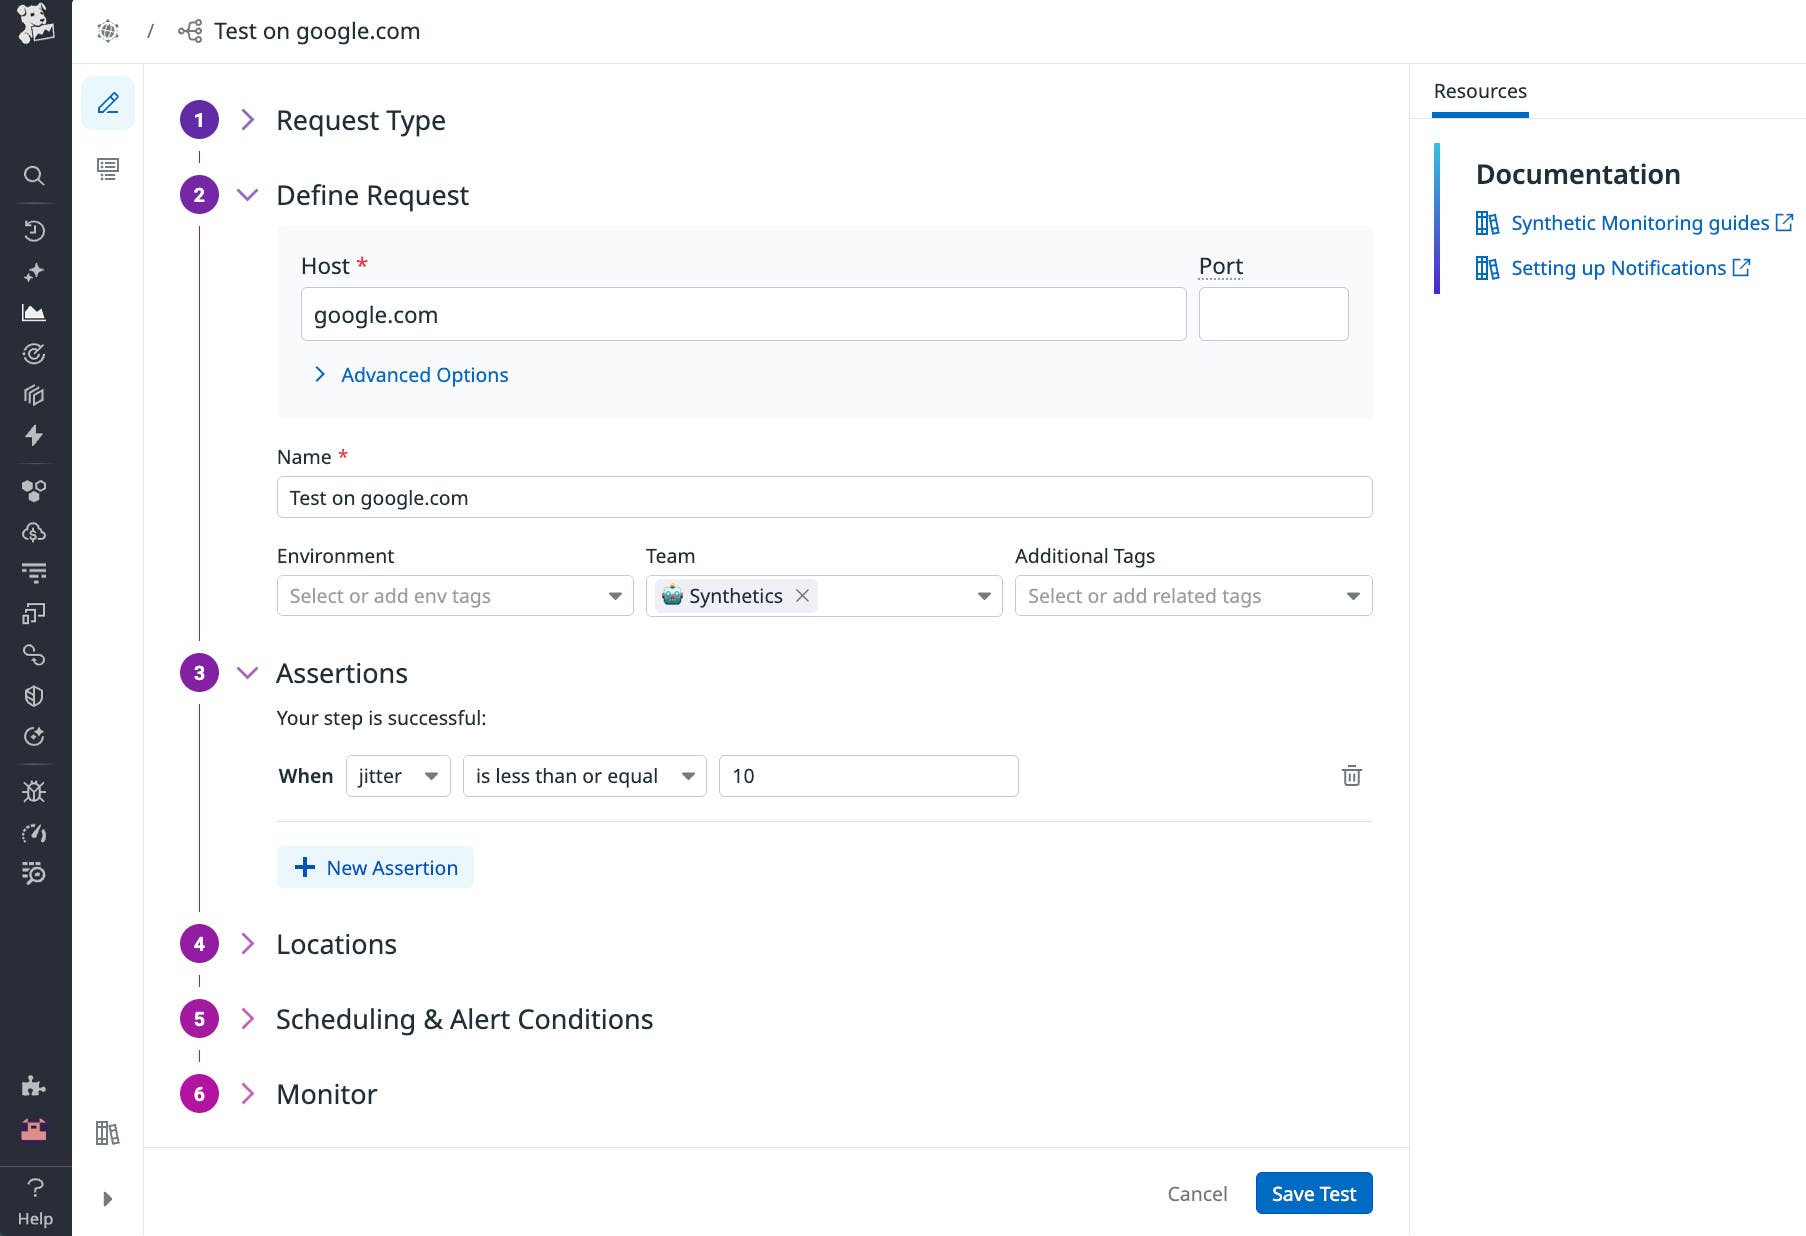
If thresholds are breached, Datadog automatically alerts your teams to help you detect and remediate problems before they cascade into user-facing incidents. You can identify early warning signs of connectivity degradation, validate network migrations, and maintain service-level health without having to run ad hoc diagnostics.
Get started with Synthetic Monitoring and Network Path
With Synthetic Monitoring and Network Path, your teams can test, monitor, and correlate every layer that shapes the user experience, from application logic to the network backbone. You gain end-to-end testing across applications and network layers, enabling faster root cause analysis, shorter downtime, and more resilient digital experiences.
Network Path tests are available today for all Synthetic Monitoring customers. To create your first test, navigate to Synthetic Monitoring and select New Test → Network Path. From there, you can choose to run tests from managed locations or hosts running the Datadog Agent, define your assertions, and view your results alongside the browser and API tests that you already rely on.
To learn more, check out the Network Path documentation. If you don’t already have a Datadog account, you can sign up for a 14-day free trial to get started.
